Osteoarthritis is a disease process which not only affects the cartilage but involves the entire joint, including the subchondral bone, ligaments, capsule, synovial membrane and the periarticular muscles leading to cartilage degeneration with fibrillation, fissures, ulcerations and full thickness loss of the joint surface. Knee joint is involved most commonly followed by hand and hip. Clinical testing of new therapies is complicated by highly variable way that osteoarthritis is manifested in individual patients. The diagnosis of OA is mainly based on physical examination and radiograph (K-L Grading) supported by laboratory tests such as C- reactive protein (CRP) and erythrocyte sedimentation rate (ESR). Radiographs provide positive results only after significant progression of disease [1]. Though C- reactive protein and ESR are indicators of inflammation but these are not site specific and arthroscopy reveals damage to cartilage that is not visible on radiographs but is an invasive technique. Magnetic resonance imaging is a non-invasive technique but cost and availability prevents routine use.
Most patients with arthritis are identified relatively late in the disease process when the disease is beyond the point at which pharmacological or surgical interventions can delay or reverse the process. The ability to detect the disease in its early stages may open the door for more effective interventions. Biomarkers are an indicator of normal biologic process, pathogenic process, or pharmacologic response to a therapeutic intervention [2,3]. These biomarkers are released in biological fluids during bone turnover process [4]. As biomarkers are direct and indirect markers of skeletal turnovers, and hence they can differentiate between affected and non-affected joints, and distinguish between the degrees of degradation in the articular cartilage [5]. Bone markers indicate the changes in serum levels can be seen earlier than radiological changes. There are few biomarkers available for the diagnosis of early stage of OA and, so far, none has entered routine clinical use for monitoring disease activity in OA patients. Hyaluronan, also known as Hyaluronic acid (HA) or hyaluronate is one such marker and is synthesized by fibroblasts and other specialized connective tissue cells. In patients with knee OA the serological Hyaluronan level correlated with the degree of synovial proliferation and the length of Osteophytes and with the degree of joint space narrowing but not with the femoral cartilage thickness [6].
The aims of this study are to assess the efficacy of serum hyaluronic acid levels in early detection and grading of the severity of primary knee osteoarthritis and it’s co-relation with Western Ontario and McMaster university osteoarthritis index (WOMAC scores) and Kellgren -Lawrence grading (K-L grade).
Materials and Methods
The study was designed as a case control study and conducted in the Orthopaedics Department of a medical college of north India during a period of two years after clearance from ethical committee of the medical college. All patients(men and non-pregnant women between 40 and 85 y of age) reporting to outpatients department of Orthopaedics department with complaints of non- traumatic knee pain and those who fit into the clinical criteria of American college of rheumatology were included in this study. Patients were excluded if they had a) secondary osteoarthritis, b) any other pathology affecting knee joint, c) renal, hepatic or malignant disease, d) were on treatment of osteoarthritis, e) alcohol or drug abuse, f) have hypersensitivity to non-steroidal anti-inflammatory drugs, g) pregnant and lactating mothers or h) active sportsperson. All healthy subjects between 40 and 85 y of age with no signs and symptoms of knee osteoarthritis, preferably first degree relatives of the cases were enrolled as controls.
The recruited subjects (cases and controls) were explained the purpose and relevance of the study and those who volunteered were included in the study after informed and written consent. After screening we finally selected 100 osteoarthritis cases and 50 normal controls to meet our objective.
All subjects were asked to fill the WOMAC questionnaire to access the presence and severity of the disease and were subjected to bilateral knee radiography to ascertain Kellgren-Lawrence grade (K-L Grading). Five ml whole venous blood sample of the recruited cases and controls was drawn in syringe and collected in plain vial taking all aseptic precautions and the samples were tested for serum levels of Hyaluronic acid (HA) by enzyme linked immuno-sorbent assay (ELISA). The samples taken were kept in plain vial at room temperature before sending in to laboratory. The blood samples were centrifuged and serum was separated and stored in small capped vials for long term use at -200C until tested. In Case Group the assessment of severity was done on the basis K-L grades and the group was subdivided as mild grade (K-L Grade II), moderate grade (K-L grade III) and severe grade (K-L grade IV) of the disease. K-L grading of the Control group was also done.
Results
The average age in Case Group was 51.28+ 7.93 y and in Control Group was 46.08+4.81y (p<0.001). There were 34 males and 66 females in Case Group while Control Group consisted of 16 males (32%) and 34 females (68%). Male to female ratio was 1:2 in the study. All cases except three had a bilateral knee joint involvement.
Among cases both males and females had significantly higher mean HA levels as compared to corresponding patients of same gender among controls (p<0.001). However, within case group as well as in control group, statistically no significant difference in HA levels between two genders was observed (p>0.05).The mean BMI of Control Group was 21.20+2.08 kg/m2 as compared to Case Group in which the mean was 21.22+2.25 kg/m2. This difference in BMI was not significant (p = 0.438). HA levels in in both controls and cases increased with increasing BMI but this was not significant statistically (p>0.050).
Number of cases in different K-L grades in Controls Group and Control Group are given in [Table/Fig-1]. The difference in K-L grades of Cases and Controls was statistically significant (p<0.001).Mean WOMAC score of Control Group was 17.19+7.18ng/dl and in Cases Group was 55.66+17.01 ng/dl and this was statistically significant [Table/Fig-1]. Mean HA levels of Control Group were 3.46+2.46ng/dl and in Case Group was 41.94+68.79 ng/dl and this difference was significant [Table/Fig-1]
Comparison of K-L Grade, womac score and serum ha levels in controls and cases
| | Controls (n=50) | Cases (n=100) | Statistical significance |
|---|
| K-L GRADE | 0 | 12 | 0 | X2 - 130.116 ‘p’ - <0.001 |
| I | 38 | 5 |
| II | 0 | 39 |
| III | 0 | 43 |
| IV | 0 | 13 |
| WOMAC SCORE | Min. | 0 | 15.6 | ‘t’ - 15.307 ‘p’ - <0.001 |
| Max. | 32.3 | 92.7 |
| Mean | 17.19 | 55.66 |
| Standard deviation | 7.18 | 17.01 |
| HA LEVEL | Min. | 0.1 | 3.5 | ‘t’ - 3.906 ‘p’ - <0.001 |
| Max. | 9.0 | 429.7 |
| Mean | 3.46 | 41.94 |
| Standard deviation | 2.46 | 68.79 |
Correlation coefficient was calculated for age, womac score and K-L grade. It showed a mild association of age with HA (r=0.387) and womac score with HA (r=0.421) was found which was highly significant (p<0.001). A strong association between KL-Grade and HA was found (0.921) which again statistically significant (p<0.001) [Table/Fig-2].
Showing correlation coefficient in different Age, K-L grade and WOMAC score
| Correlation coefficient (Pearson's correlation coefficient – "r") | "p" | Power of Correlation |
|---|
| Age | 0.387 | <0.001 | Mild |
| KL-Grade* | 0.921 | <0.001 | Strong |
| WOMAC Score | 0.421 | <0.001 | Mild |
*Spearman's correlation coefficient
Mean HA levels of Cases and Control subjects showed increasing trends with increasing grades of K-L Grades [Table/Fig-3]. HA levels and WOMAC scores were found to be higher for higher grades of severity and this difference was statistically significant (p<0.001). Similarly, WOMAC scores also showed a significant increasing trend from doubtful to severe knee OA cases (p<0.001) [Table/Fig-4].
Comparison of HA levels between Cases and Controls in different KL-Grades
| KL-Grade | Cases (n=100) | Controls (n=50) | Significance of Difference |
|---|
| No. | Mean | SD | No. | Mean | SD | "t"-test | "p" value |
|---|
| 0 | 0 | . | . | 12 | 1.06 | 1.15 | - | - |
| I | 5 | 8.64 | 3.79 | 38 | 4.21 | 2.27 | 3.780 | <0.001 |
| II | 39 | 14.77 | 7.08 | – | – | – | – | – |
| III | 43 | 38.28 | 41.34 | – | – | – | – | – |
| IV | 13 | 148.41 | 133.06 | – | – | – | – | – |
| F=20.39; p<0.001 | F=3.64; p=0.063 | |
Comparison of Severity of Primary Knee Osteoarthritis and HA levels
| Severity | N | Mean HA levels | WOMAC scores |
|---|
| Mean | SD | Min | Max | Mean | SD | Min | Max |
|---|
| Doubtful | 5 | 8.64 | 3.79 | 4.1 | 12.3 | 18.95 | 3.86 | 15.6 | 25.0 |
| Mild | 39 | 14.77 | 7.08 | 3.5 | 32.7 | 44.66 | 9.57 | 25.0 | 70.8 |
| Moderate | 43 | 38.28 | 41.34 | 15.70 | 289.50 | 64.54 | 9.04 | 44.8 | 82.3 |
| Severe | 13 | 148.41 | 133.06 | 37.70 | 429.70 | 73.40 | 15.07 | 35.4 | 92.7 |
| Total | 100 | 41.94 | 68.79 | 4.1 | 429.70 | 55.66 | 17.01 | 15.6 | 92.7 |
| Significance | F =20.381; p<0.001 | F=20.747; p<0.001 |
Multivariate analysis was also done and it showed that between the two independent variables i.e. age >50 y and WOMAC score <60), only WOMAC score>60 was independently associated with the outcome. Age <50 y as well as interaction of age <50 y and WOMAC score>60 combined did not show a significant association with the dependent variable HA levels [Table/Fig-5].
Multivariate Analysis to find out association of HA with different independent predictors
| Source | Type III Sum of Squares | Df | Mean Square | F | Sig. |
|---|
| Corrected Model | 81093.319(a) | 3 | 27031.106 | 9.030 | <0.001 |
| Intercept | 122902.776 | 1 | 122902.776 | 41.058 | <0.001 |
| Age>50 | 2031.925 | 1 | 2031.925 | .679 | 0.411 |
| WOMAC>60 | 47803.390 | 1 | 47803.390 | 15.970 | <0.001 |
| Age>50 & WOMAC>60 | 1861.000 | 1 | 1861.000 | .622 | 0.432 |
| Error | 437037.869 | 146 | 2993.410 | | |
| Total | 645280.760 | 150 | | | |
| Corrected Total | 518131.188 | 149 | | | |
Receiver operator curve analysis was done based on the direction of assessment. HA level was evaluated for prediction of cut-off values between Control group and Case group and also between mild and moderate and between moderate and severe cases [Table/Fig-6]. The results suggested a cut-off value of <06.65 ng/ml(95.0% sensitive and 90.0% specific with accuracy of 97.9%) between Control group and Case group; of>21.30 ng/ml (87.6% sensitive and 86.0% specific with accuracy of 93.9%) between mild and moderate cases and of>42.01 ng/ml (92.3% sensitive and 93.1% specific with accuracy of 97.1%) between moderate and severe cases [Table/Fig-7].
Receiver – Operator Curve analysis – Severity assessment A) Controls Vs Cases B) Mild Vs Moderate C) Moderate Vs Severe Cases
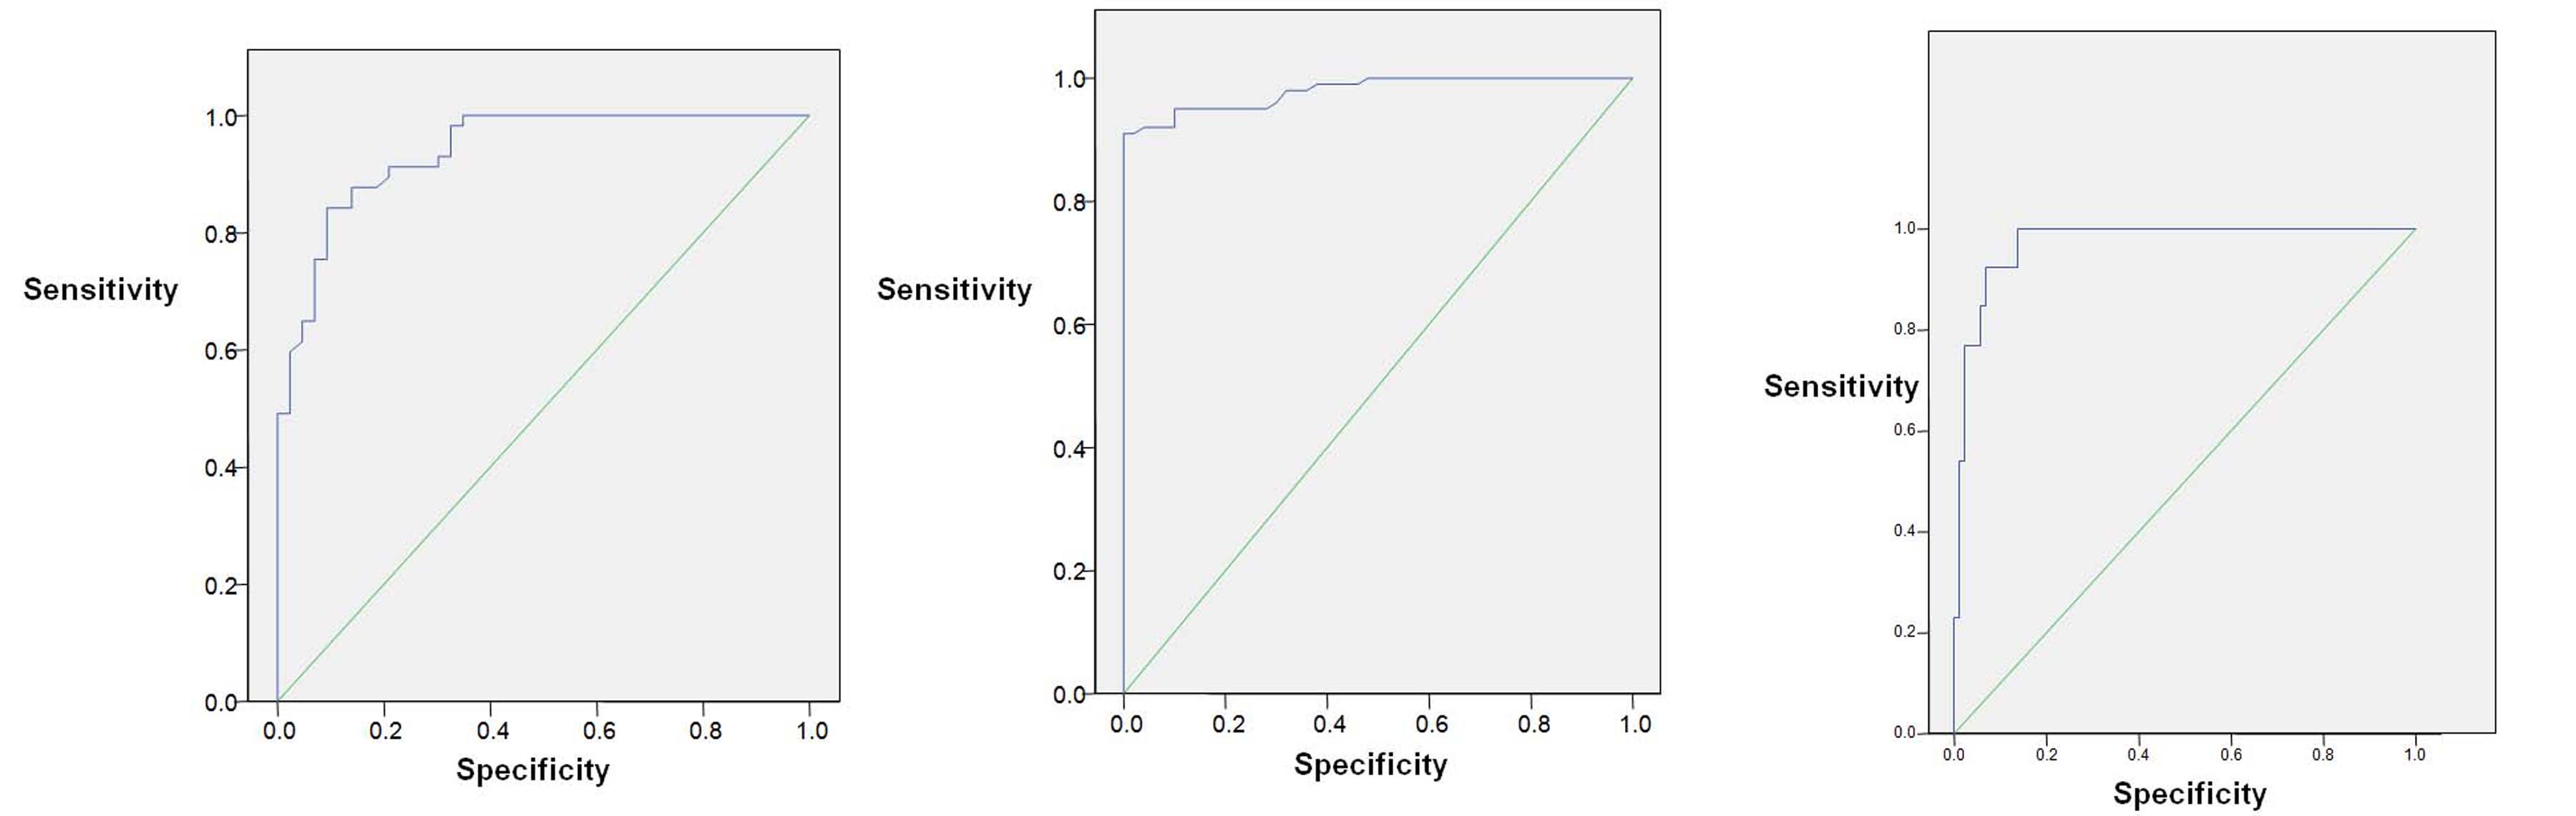
ROC Analysis for evaluating the discriminator ability of HA levels
| Test Result Variable(s) | Area | Std. Error(a) | Asymptotic Sig.(b) | Asymptotic 95% Conf. Interval |
|---|
| Lower Bound | Upper Bound |
|---|
| A) Between cases and controls |
| HA levels (ng/dl) | 0.979 | 0.009 | <0.001 | 0.962 | 0.997 |
| B) Between mild and moderate cases |
| HA levels (ng/dl) | 0.939 | 0.022 | <0.001 | 0.896 | 0.982 |
| C) Between moderate and severe cases |
| HA levels (ng/dl) | 0.971 | 0.016 | <0.001 | 0.940 | 1.002 |
Discussion
A diagnosis of knee OA is traditionally based upon clinical (WOMAC score) and radiological (K-L Grade) criteria. Usually joint tissue degeneration is already advanced by the time the diagnosis is made hence the research focus has now shifted to a find method to diagnose this condition at the early stage of the disease and for this very purpose biomarkers came in to vogue. HA is one such biomarker.
Analysis of our results show that within case group as well as in control group, statistically no significant difference in HA levels between two genders was observed (p>0.05). In Case Group males (mean: 57.22+ 94.2 ng/ml) had a higher mean HA levels than females (mean: 34.07+ 50.34 ng/ml) but this difference was not significant (p=0.111). Significantly higher mean serum HA levels have been reported in men, but data of our study do not support that [7]. On the other hand in Control Group mean HA level in males (3.19+2.28 ng/ml) was lower than in females (3.58+2.56 ng/ml)but again this difference was not statistically significant (p=0.610).Among cases both males and females had significantly higher mean HA levels as compared to corresponding patients of same gender among controls (p<0.001).
This study showed that HA levels have significant correlation with age, WOMAC score and K-L grade. The Pearson’s correlation coefficient and Spearman’s correlation coefficient show mild association with age (r= 0.387, p <0.001) and WOMAC score (r= 0.421, p <0.001). The association of HA levels with age has been also reported by other studies(r < 0.35, p < 0.0001) [7,8]. Present study has also shown significant strong association of HA levels with K-L grade (r =0.921, p <0.001) though few studies have reported that there was no significant correlation exists between HA levels with WOMAC and K-L grade (p>0.05) [6,9].
HA levels increase with increasing BMI in both Case group and Control Group but this difference was not significant (p <0.05). Similar results have been also reported by many authors [6–8]. This might be because the BMI of Case group and Control group in our study was nearly similar as the controls were siblings or first degree relatives of the patients in the same age group. But positive correlation between HA levels and BMI has also been reported [10].
A statistically significant difference of HA levels between Case Group and Control Group (p<0.001) was found in our study which agrees with results of many other reported studies [6–8,10]. HA levels were found to be higher for higher grades of severity in our study (p<0.001). This again is supported by many other studies [8,11,12]. Higher baseline Incident HA levels are associated with incident OA over long follow-up periods have been reported in literature [12]. High HA levels are associated with severe OA (K-L grade IV) and have been recommended to be used as a biomarker for burden of disease, though there is considerable overlap in reference intervals in K-L grade I, II and III [11]. It has been reported earlier in a study that the patients with higher basic serum levels of HA have a faster radiological progression, which agrees with our study as the qualitative HA at baseline correlated with K–L grade [13].
Our analysis has shown age and WOMAC score are two independent variables associated with HA levels on univariate analysis but multivariate analysis shows that only WOMAC score alone is associated with disease severity. Multivariate analysis of our data indicates that HA levels are directly and independently correlated with the osteoarthritis severity as measured by WOMAC scores. Correlation of WOMAC scoring with severity of osteoarthritis has also been reported earlier [14,15].
ROC curve analysis of results showed the discriminantability of HA levels between cases and control population is excellent (sensitivity:87.6%, specificity: 86.0 %, accuracy: 97.9%). Our results are in concurrence with results of other study which has reported that sensitivity (89.0%) and specificity (80%) in osteoarthritis [16]. ROC curve analysis also shows a significant correlation between HA level and severity of disease (p < 0.001). It has been reported earlier in literature that levels of serum HA have a significant positive correlation with all grades of radiographic OA [6]. Analysis show that HA levels of <21.30 ng/ml as a cutoff value between mild and moderate cases gives a (87.6% sensitive and 86.0% specific with accuracy of 93.9%). Similarly a cutoff values of <42.01 ng/ml is able to differentiate between moderate and severe cases with 92.3% sensitivity, 93.1% specificity with an accuracy of 97.1%.
Conclusion
On the basis of our results it can be concluded that hyaluronic acid levels are significantly associated with knee osteoarthritis and are able to predict the disease severity in consonance with WOMAC scoring. Hence, they can play a crucial role in identification, gradation and management of patients with knee osteoarthritis. We suggest corroborating these findings in different clinical settings.
*Spearman's correlation coefficient