Association of Elevated first Trimester Serum Uric Acid Levels with Development of GDM
Rasika C1, Sunita Samal2, Seetesh Ghose3
1 Senior Resident, Department of Obstetrics and Gynaecology, Mahatma Gandhi Medical College & Research Institute, Pilliyarkuppam, Pondicherry, India.
2 Associate Professor, Obstetrics and Gynaecology, Mahatma Gandhi Medical College & Research Institute, Pilliyarkuppam, Pondicherry, India.
3 Professor, Department of Obstetrics and Gynaecology, Mahatma Gandhi Medical College & Research Institute, Pilliyarkuppam, Pondicherry, India.
NAME, ADDRESS, E-MAIL ID OF THE CORRESPONDING AUTHOR: Dr. Sunita Samal, Associate Professor, Department of Obstetrics and Gynaecology, Mahatma Gandhi Medical College & Research Institute, Pilliyarkuppam, Pondicherry - 607402, India. Phone : 917598091669, E-mail : sunisamal@rediffmail.com
Background: Early intervention and appropriate treatment in patients with GDM will help in preventing the adverse maternal and fetal outcome and protect them from long term complications. Several studies have shown the association of hyperuricemia with GDM. This study was undertaken to find out the association of elevated first trimester uric acid with development of GDM.
Materials and Methods: This prospective observational study was conducted in Mahatma Gandhi Medical Collage and Research Institute, Pondicherry, India, between November 2010 and May 2012. A total of 70 pregnant women were included and parameters like age, parity, BMI, history of DM, serum uric acid at <15 weeks and at 24 to 28 weeks and one step test at 24 to 28 weeks were noted and compared.
Results: There was no significant correlation between the demographic variables and GDM, but a moderate significance noted between the family history of DM and one step test (p=0.048). Though there is a proportional increase in the serum uric acid with increase in the BMI, it was not statistically significant. A significant correlation was seen between BMI and risk of development of GDM (p= 0.001). Though there is a significant correlation between serum uric acid at <15 weeks and at 24 to 28 weeks, serum uric acid at <15 weeks of gestation is a better predictor of GGI and GDM (Pearson’s correlation = 0.735).
Conclusion: There is increase in the risk of development of GDM with increased levels of serum uric acid in the first trimester. Uric acid levels at <15 weeks of gestation is more significantly associated with risk of development of GDM than it’s levels at 24 to 28 weeks of gestation.
Gestational diabetes mellitus, Hyperuricemia, Serum uric acid
Introduction
GDM is one of the most important complications during pregnancy which is associated with both maternal and fetal morbidity and mortality [1]. World Health Organization and American Diabetes Association define GDM as “any degree of glucose intolerance with onset or first recognition during pregnancy” [2]. The prevalence ranges between 1 and 14 % of all pregnancies [1]. But studies conducted in different parts of the country averages the incidence of GDM in Indian population to be 16.55% [3]. Highest frequency of GDM among Indian women necessitates early diagnosis of GDM using glucose tolerance tests between 24 and 28 week of gestational age, though reports claim that about 40 to 66% of women with GDM can be diagnosed even earlier during pregnancy [4,5]. But no tests available before this gestational age which can predict the development of GDM. Serum uric acid is associated with insulin resistance in nonpregnant women [6]. It has been proven that, higher uric acid levels correlates with insulin resistance in women with hypertensive disorders of pregnancy and also higher levels of uric acid levels were noted at 24 to 28 weeks of gestation in women with GDM when compared to women without GDM [7,8]. Normally during pregnancy, the serum uric acid levels decreases significantly from 8th week of gestation up to 24 weeks due to increased glomerular filtration rate and decreased re absorption of uric acid from the renal tubules. In the first trimester, it likely approximates preconception uric acid level and elevated levels may identify women who are predisposed to metabolic syndrome with an increased risk of developing GDM. Using this concept, we aimed at a prospective analysis of association of first trimester elevated uric acid levels with the development of GDM. This would be useful in predicting GDM at an earlier gestational age, thereby aiding in appropriate management of the same to prevent maternal and fetal morbidity and mortality.
Material and Methods
This prospective observational clinical study was conducted in Mahatma Medical College and Research Institute, Pondicherry, India, a tertiary care center, between November 2010 and May 2012 after obtaining the Ethical Committee clearance. Pregnant women of gestational age <15 weeks who attended the OG outpatient department within this time period for regular antenatal check-up were enrolled in the study. Pregnant women of gestational age >15 week , with overt DM, receiving steroids in any form, with Gout or other endocrine disorders and chronic renal diseases were excluded from the study. A total of 70 pregnant women who satisfied the inclusion and exclusion criteria were recruited after informed written consent for participation. Demographic information, medical, family and obstetrical history via structured interview were obtained. Height, weight, BMI was measured. Gestational age was confirmed by ultrasonography. Blood samples were collected for estimation of serum uric acid along with other routine serological investigation. Serum uric acid level was assessed using automated photo spectrometric assay (IFCC). At 24 to 28 weeks of gestation, one step test to detect GDM using 75 g of oral glucose load was done irrespective of the last meal of the patient and blood sample were also collected for S. uric acid GDM was diagnosed if 2 hour postprandial plasma glucose levels were >140mg/dl as recommended by WHO. Any changes in serum uric acid levels at 24 to 28 weeks were noted.
Statistical Analysis
Descriptive statistical analysis had been carried out in the present study. Results on continuous measurements were presented on Mean ± SD (Min-Max) and results on categorical measurements were presented in number (%). Significance was assessed at 5 %level of significance. Analysis of variance (ANOVA) had been used to find the significance of study parameters between three or more groups of patients. Chi-square/ Fisher Exact test had been used to find the significance of study parameters on categorical scale between two or more groups. Pearson correlation was done between one step test at 24 to 28 wks and S.Uric acid at < 15 wks. Statistical software: The Statistical software namely SAS 9.2, SPSS 15.0, Stata10.1, MedCalc 9.0.1 ,Systat 12.0 and R environment ver.2.11.1 were used for the analysis of the data and Microsoft word and Excel have been used to generate graph.
Result
A total of 70 pregnant women of gestational age<15wks were recruited in the study after meeting our criteria. Demographic variables are shown in [Table/Fig-1 a,b,c,d]. The serum uric acid levels at <15 week of gestation were between 1.5 and 4.5 mg/dl and were divided into 3 quartiles according to the levels. Subjects with serum uric acid level of 1.5 to 2.5 mg/dl, 2.6 to 3.5 mg/dl and 3.6 to 4.5 mg/dl were in first, second and third quartile respectively [Table/Fig-2]. Majority of the subjects were in the second quartile 37 (52.8 %).The values of one step test at 24 to 28 weeks of gestation studied ranged between 70 to 153 mg/dl with a mean value of 109.84±20.07 mg/dl, out of which only 4 women had value more than 140 mg/dl [Table/Fig-3,4]. [Table/Fig-5] shows the significant increase of one step values with increased values of serum uric acid at< 15 weeks of gestation with a p-value of <0.001**. But the correlations between serum uric acid at 24 to 28 weeks and one-step test at 24 to 28 weeks were not statistically significant with a p-value of 0.094 [Table/Fig-6]. The Pearson’s test showed that, correlation of serum uric acid at <15 weeks of gestation with one-step test is more significant than serum uric acid at 24 to 28 weeks of gestation [Table/Fig-6]. While comparison of baseline variables (age, parity, BMI and family history) with serum uric acid levels at <15 weeks of gestation didn’t show any significance [Table/Fig-7], there was a moderately significant correlation between the family history of DM and one step test at 24 to 28 weeks (p = 0.048) and a significant correlation between the BMI and one step test at 24 to 28 weeks. (p = 0.001) [Table/Fig-8].
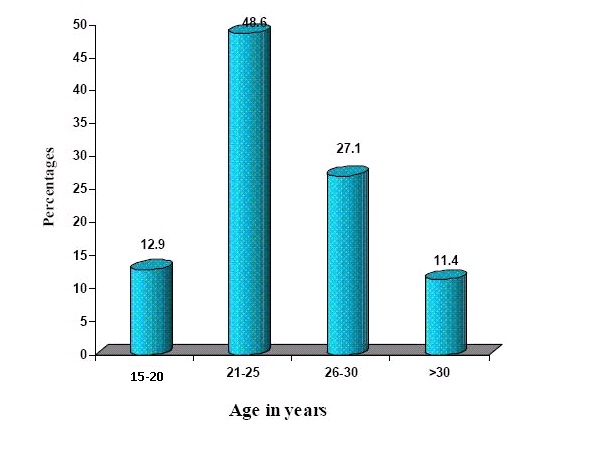
Age distribution of pregnant women studied
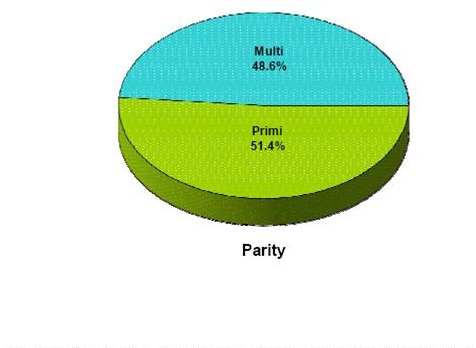
Parity distributio of pregnant women studied
BMI (kg/m2) distribution of pregnant women studied

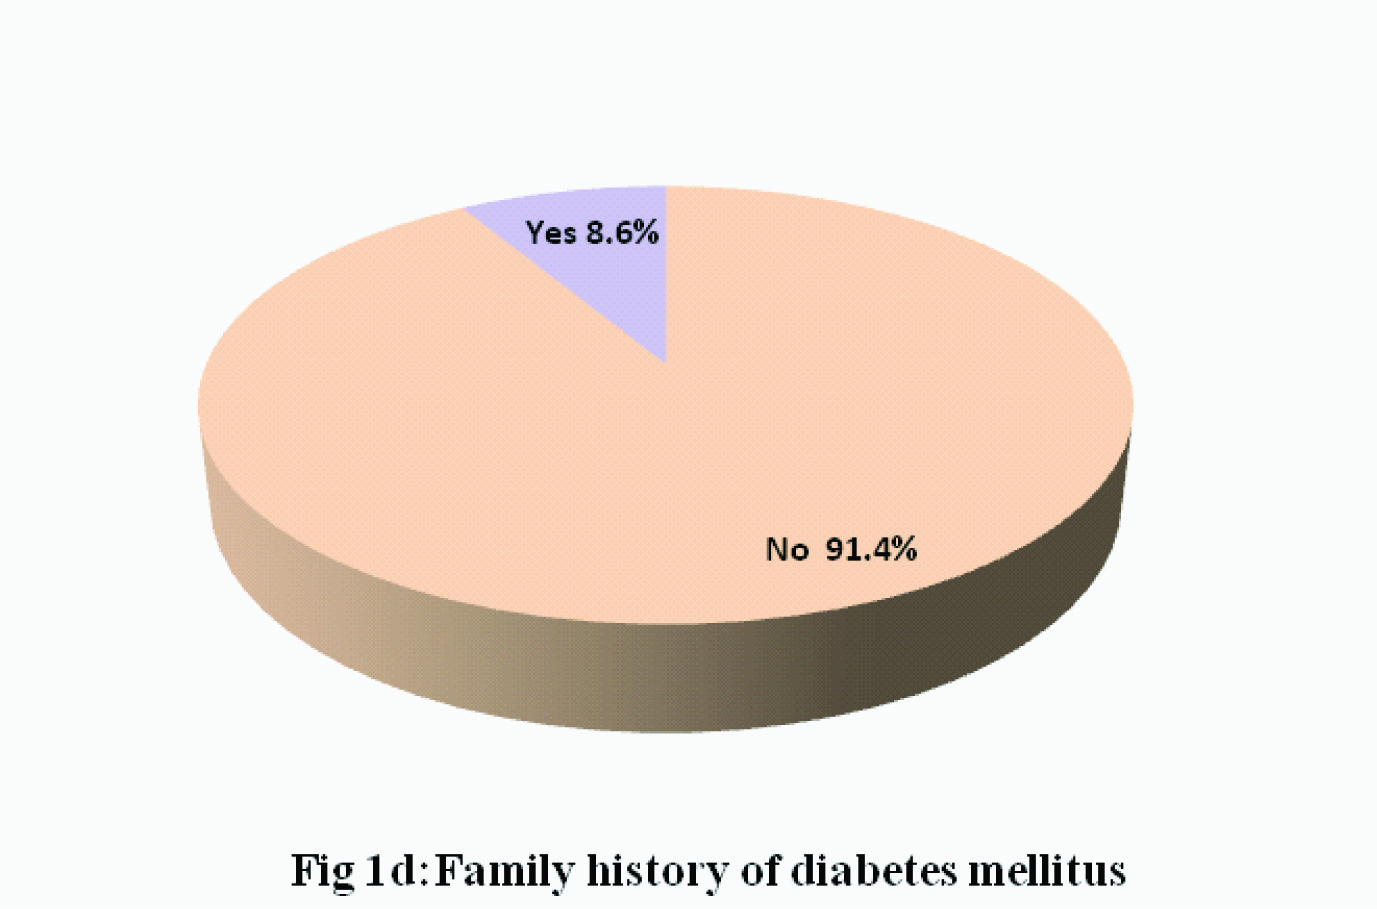
Family histroy of diabetes millitus
Quartile distribution of serum uric acid at <15wks

One step test at 24 to 28 wks of pregnant women studied

Pearson correlation of serum uric acid with one step test at 24 to 28 wks

Comparision of one step test @ 24 to 28 weeks according to quartile distribution of S. Uric Acid @ <15 weeks
| S.Uric acid @ <15 wks | Number of pregnant women | One step test @24 to 28 wks | Mean ±SD (one step test) |
|---|
| <100 | 100-120 | 120-140 | >140 |
|---|
| 1st quartile (1.5 to 2.5 mg/dl) | 17 | 13(76.5%) | 4(23.5%) | 0 | 0 | 92.82±10.85 |
| 2nd quartile (2.6 to 3.5 mg/dl) | 37 | 15(40.5%) | 10(27.8%) | 10(27.1%) | 2(5.4%) | 109.00± 18.04 |
| 3rd quartile (3.6 to 4.5 mg/dl) | 16 | 0 | 1(6.3%) | 13(81.3%) | 2(12.5%) | 132.18± 8.79 |
| Total | 70 | 28(40.0%) | 15(21.4%) | 23(32.9%) | 4(5.7%) | 109.84± 20.07 |
Correlation of serum uric acide @ 24 to 28 weeks with one step test @ 24 to 28 weeks and comparison of same with serum uric acid <15 weeks
| Variables | S. Uric acid @ 24 to 28 wks | p-value |
|---|
| 1st quartile (1.5 to 2.5 mg/dl) (n=14) | 2nd quartile (2.6 to 3.5 mg/dl) (n=34) | 3rd quartile (3.6 to 4.5 mg/dl) (n=22) |
|---|
| one step test @ 24 to 28 wks | 102.29± 17.35 | 105.29± 18.43 | 121.77± 19.55 | |
| <100 | 7(50%) | 17(50%) | 4(18.2%) | 0.094+ |
| 100-120 | 4(28.6%) | 7(20.6%) | 4(18.2%) |
| 120-140 | 3(21.4%) | 9(26.5%) | 11(50%) |
| >140 | 0(0%) | 1(2.9%) | 3(13.6%) | |
| S.Uric acid @ <15 wks | 2.40± 0.55 | 2.93± 0.59 | 3.29± 0.59 | |
| 1st quartile (1.5 to 2.5 mg/dl) | 7(50%) | 7(50%) | 7(50%) | <0.001** |
| 2nd quartile (2.6 to 3.5 mg/dl) | 7(50%) | 7(50%) | 7(50%) |
| 3rd quartile (3.6 to 4.5 mg/dl) | 7(50%) | 7(50%) | 7(50%) |
Comparison of baseline variables (age, parity, BMI and family history according to quartile distribution of Serum Uric acid @<15 weeks
| Variables | S. Uric acid @ <15 weeks | p-value |
|---|
| 1st quartile (1.5 to 2.5 mg/dl) (n=17) | 2nd quartile (2.6 to 3.5 mg/dl) (n=37) | 3rd quartile (3.6 to 4.5 mg/dl) (n=16) |
|---|
| Age in years |
| 18-20 | 2(11.8%) | 5(13.5%) | 2(12.5%) | 0.704 |
| 21-25 | 9(52.9%) | 16(43.2%) | 9(56.3%) |
| 26-30 | 3(17.6%) | 11(29.7%) | 5(31.3%) |
| >30 | 3(17.6%) | 5(13.5%) | 0(0.0%) | |
| Parity |
| Primi | 9(52.9%) | 17(45.9%) | 10(62.5%) | 0.538 |
| Multi | 8(47.1%) | 20(54.1%) | 6(37.5%) |
| BMI (kg/m2) | |
| <18.5 | 4(23.5%) | 6(16.2%) | 1(6.3%) | 0.181 |
| 18.5-25.0 | 6(35.3%) | 13(35.1%) | 2(12.9%) |
| 25.0-30.0 | 5(29.4%) | 13(35.1%) | 6(37.5%) |
| >30.0 | 2(11.8%) | 5(13.5%) | 7(43.8%) |
| Family history | |
| No | 16(94.1%) | 35(94.6%) | 13(81.3%) | 0.236 |
| Yes | 1(5.9%) | 2(5.4%) | 3(18.8%) |
Comparison of Age, BMI and Family DM with one step test @ 24 to 28 weeks
| Variables | One step test @24 to 28 wks | p-value |
|---|
| <100 (n=28) | 100-120 (n=15) | 120-140 (n=23) | >140 (n=4) |
|---|
| Age in years | |
| 18-20 | 2(7.1%) | 3(20%) | 3(13%) | 1(25%) | 0.643 |
| 21-25 | 16(57.1%) | 5(33%) | 12(52.2%) | 1(25%) |
| 26-30 | 8(28.6%) | 4(26%) | 6(26.1%) | 1(25%) |
| >30 | 2(7.1%) | 3(20%) | 2(8.7%) | 1(25%) |
| Parity | |
| Primi | 14(50%) | 8(53.3%) | 11(47.8%) | 3(75%) | 0.870 |
| Multi | 14(50%) | 7(46.7%) | 12(52.2%) | 1(25%) |
| BMI (kg/m2) | |
| <18.5 | 7(25%) | 3(20%) | 1(4.3%) | 0(0%) | <0.001** |
| 18.5-25.0 | 9(32.1%) | 7(46.7%) | 2(8.7%) | 3(75%) |
| 25.0-30.0 | 10(35.7%) | 5(33.3%) | 8(34.8%) | 1(25%) |
| >30.0 | 2(7.1%) | 0(0%) | 12(52.2%) | 0(0%) |
| Family history | |
| No | 28(100%) | 14(93.3%) | 19(82.6%) | 3(75%) | 0.048* |
| Yes | 0(0%) | 1(6.7%) | 4(17.4%) | 1(25%) |
Discussion
Early intervention and appropriate treatment in patients with GDM or at increased risk for developing of GDM will helpful in preventing the adverse maternal and fetal outcome and also protect them from long term complications. Several studies have shown the association of hyperuricemia with GDM. This study, conducted in Mahatma Gandhi Medical College and Research Institute, Pondicherry between November 2010 and May 2012, was undertaken to find out the association of elevated first trimester uric acid with development of GDM. In our study mean age was 25.33±4.47yr without any statistical significance between age of the pregnant women studied and their serum uric acid level at <15 weeks of gestation (p = 0.704) and GDM (p = 0.643).The incidence of GDM with relation to age was low in this study as majority of the subjects were in the low risk age group for the development of GDM and also may be due to the smaller study population. Out of 70 women studied, 51.4% were primigravida and 48.6% were multigravida. There was no difference between the parity and serum uric acid levels at<15 weeks of gestation (p=0.538). The same has been shown by Dunlop W et al., in their study; (Effect of renal handling of uric acid in pregnancy) that there was no difference detected in the changes seen in serum uric acid levels between primigravida and multigravida. A study by Nagalakshmi C.S et al., has shown an increased risk of developing GDM among primigravida [9]. Al-Rowaily et al., have shown in their study that multiparous women were 8.29 times more likely to have GDM than nulliparous women [10]. However, after adjustment for maternal age and history of abortion, nulliparous women were 2.95 times more likely to develop GDM than parous women. In this study there was no difference in the incidence of GDM in relation to the parity of the population studied (p = 0.870), 80% of pregnant women studied were non obese (BMI <30kg/m2) and majority of them had their serum uric acid level in the second and third quartile. 20% were obese with their serum uric acid level in the third quartile followed by second quartile. There was a proportional increase in the serum uric acid with increase in the BMI, but it was not statistically significant. There has also been noted a significant correlation between BMI and risk of development of GDM (p = 0.001). In this study those subjects who had a normal BMI had elevated levels of uric acid at < 15 week of gestation which was associated with increased levels of blood glucose level at 24 to 28 weeks of gestation. These findings suggested though BMI is significantly associated with development of GDM, the association between elevated uric acid levels at early trimester and risk of development of GDM was independent of BMI. Similar statement was given by Laughon KS et al., that although uric acid was strongly associated with body mass index, the risk of gestational diabetes was increased among women with elevated first trimester uric acid independent of BMI [11]. Majority of the subjects had no significant family history of DM though they had higher levels blood glucose at 24 to 28 weeks. There was a moderate significance noted between the family history of DM and one step test (p =0.048). Similar findings were noted in yet another study by Ratnakaran R et al., where they have shown that established risk factors for GDM were relevant in women with family history of DM but may not be the principal determinants of gestational hyperglycaemia in women without significant family history [12]. The serum uric acid levels at <15 weeks of gestation were not related to the family history of DM (p = 0.236) though the serum uric acid levels of 50% of those with significant family history were in the 3rd quartile. The subjects with uric acid in the first quartile had a normal one step test value (<120mg/dl). In the second quartile 27.1% had gestational glucose intolerance i.e. one step test of 120 to 140 mg/dl and 5.4% had GDM (>140mg.\/dl). In the third quartile 81.3% had gestation glucose intolerance and 12.5% had GDM. This distribution has revealed that higher level of serum uric acid in the first trimester were strongly associated with increased levels of one step test (120 to 140mg/dl) i.e. Gestational Glucose Intolerance (GGI) (p=<0.001) though only 5.7% were diagnosed to have GDM. The same was stated by Langhon KS et al., first trimester hyperuricemia is associated with increased risk for development of GDM [11]. Wolak T el al., also have shown that UA levels in the highest quartile of the normal range during the first 20 weeks of pregnancy are associated with higher risk for the development of GDM and mild preeclampsia [13]. Zhou J et al., showed in their study, measured lipids and uric acid concentrations in 1000 healthy nulliparous women at 20 weeks of gestation and showed that hyperuricemic women experienced a 1.99-fold risk for preeclampsia and a 2.34-foldrisk for GDM [14]. Our findings are consistent with the association of uric acid with insulin resistance in the non pregnant population [6] and also the early pregnancy uric acid concentrations in our study were similar to those reported by others. Majority of the subjects did not have any changes between serum uric acid levels at <15 weeks and at 24 to 28 weeks of gestation. They either had same levels or slight increase in the level. This could have been due do the normal changes that occur in uric acid levels in pregnancy as stated by Boyle JA et al., that the uric acid level fall during the early and mid-trimester rises to normal values in late pregnancy [15]. There was no significant correlation between uric acid levels at 24 to 28 weeks and risk of development of GDM (p=0.094). Though there was a significant correlation between serum uric acid at <15 weeks and at 24 to 28 weeks, serum uric acid at <15 weeks of gestation was a better predictor of GGI and GDM (Pearson’s correlation = 0.735). This is due to the fact that serum uric acid levels normally falls in early trimester and mid-trimester and rises to normal values in late pregnancy. Elevated or higher normal levels of serum uric acid in the first trimester may be associated with a pre-existing metabolic derangement which leads to poor maternal physiological adaptations and predisposes the pregnant women to development of pregnancy complications like GDM, preeclampsia etc.
Limitations
The sample size of this study was less due to the limited study period. In this study majority of subjects with high first trimester uric acid had one step test value of 120 to 140mg/dl (GGI). Follow up of these patients after 28 weeks of gestation was not done to find out whether they developed GDM later in the pregnancy.
Conclusion
Based on the results and the methodology employed, we have concluded that: There is increase in the risk of development of GDM with increased levels of serum uric acid in the first trimester. This association is independent of age, parity, BMI and family history of DM though there is association of these variables (advanced maternal age, high parity, increased BMI and positive family history) with GDM. Uric acid levels at <15 weeks of gestation is more significantly associated with risk of development of GDM than serum uric acid level at 24 to 28 weeks of gestation. There is no significant changes in the levels of serum uric acid at<15 weeks and at 24 to 28 weeks of gestation.
[1]. Persson B, Hanson U, Neonatal morbidities in gestational diabetes mellitusDiabetes Care 1998 21(suppl.2):B7 [Google Scholar]
[2]. American diabetes associationPreconception care of women with diabetes mellitusDiabetes Care 2003 26:S91-3. [Google Scholar]
[3]. Seshiah V, Balaji V, Balaji MS, Gestational diabetes mellitus in IndiaJAssoc Physicians India 2004 52(9):707-11.ISSN 0004-5772 [Google Scholar]
[4]. Meyer WJ, Carbone J, Gauthier DW, Gottmann DA, Early gestational glucose screening and gestational diabetesJ Reprod Med 1996 41:675-79. [Google Scholar]
[5]. Nahum GG, Wilson SB, Stanislaw H, Early pregnancy glucose screening for gestational diabetes mellitusJ Reprod Med 2002 47(8):656-62.ISSN0024-7758 [Google Scholar]
[6]. Modan M, Halkin H, Karasik A, Lusky A, Elevated serum uric acid--a facet of hyperinsulinaemiaDiabetologia 1987 30:713-8.[PubMed: 3322912] [Google Scholar]
[7]. Weisz B, Cohen O, Homko CJ, Schiff E, Sivan E, Elevated serum uric acid levels in gestational hypertension are correlated with insulin resistanceAm J Perinatology 2005 22:139-44.[PubMed: 15838747] [Google Scholar]
[8]. Gungor ES, Danisman N, Mollamahmutoglu L, Relationship between serum uric acid, creatinine, albumin and gestational diabetes mellitusClinChem Lab Med 2006 44:974-77.[PubMed: 16879063] [Google Scholar]
[9]. Nagalakshmi CS, Devaki RN, Akila P, Suma KB, Prashant V, Suma MN, Altered Renal Mechanisms in Gestational Diabetes MellitusJournal of Clinical and Diagnostic Research 2012 (Suppl-1), Vol-6(3):369-71. [Google Scholar]
[10]. >Al-Rowaily and Abolfotouh; pridictors of GDM in high parity community in Saudi Arabia; Eastern Mediterranean Health JournalEMHJ 2010 Vol. 16 o:6 [Google Scholar]
[11]. Katherine S Laughon, Catovr Janet, Provins Traci, Roberts James M, Gandley Robin E, Elevated first-trimester uric acid concentrations are associated with the development of gestational diabetesAm J Obstet Gynecol 2009 201(4):402.e1-402.e5. [Google Scholar]
[12]. Retnakaran R, Connelly PW, Sermer M, Zinman B, Hanley A. J. G, (2007) The impact of family history of diabetes on risk factors for gestational diabetesClinical Endocrinology 2007 67:754-60.doi: 10.1111/j.1365-2265.2007.02958.x [Google Scholar]
[13]. Wolak Talya, Sergienko Ruslan, Wiznitzer Arnon, Paran Esther, Sheiner Eyal, High Uric Acid Level During the First 20 Weeks of Pregnancy is Associated with Higher Risk for Gestational Diabetes Mellitus and Mild Preeclampsia 2012 31(3):307-15. [Google Scholar]
[14]. Jianjun Zhou, Xia Zhao, Zhiqun Wang, Yali Hu; Combination of lipids and uric acid in mid-second trimester can be used to predict adverse pregnancy outcomes Posted online on July 13, 2012. (doi:10.3109/14767058.2012.704447 [Google Scholar]
[15]. James A. Boyle, Stuart Campbell, Anne M. Duncan, William R. Greig, And W. Watson Buchanan From the Centre for Rheumatic Diseases, Glasgow, the University Department of Obstetrics, Queen Mother’s Hospital, Glasgow, and the Department of Biochemistry, Royal Infirmary, Glasgow [Google Scholar]