Waist Circumference, Waist-to-Height Ratio and Body Mass Index of Thai Children: Secular Changes and Updated Reference Standards
Sanguansak Rerksuppaphol1, Lakkana Rerksuppaphol2
1 Faculty of Medicine, Department of Paediatrics, Srinakharinwirot University, Thailand.
2 Faculty of Medicine, Department of Preventive Medicine, Srinakharinwirot University, Thailand.
NAME, ADDRESS, E-MAIL ID OF THE CORRESPONDING AUTHOR: Dr. Sanguansak Rerksuppaphol, Faculty of Medicine, Department of Paediatrics, Srinakhariwirot University, Nakorn Nayok-26120, Thailand. Phone : 668 1723 1766, E-mail : sanguansak_r@hotmail.com
Background: The prevalence of obesity in pediatric age group has been increasing globally. Body mass index (BMI), waist circumference (WC) and waist-to-height ratio (WHtR) are commonly used to define obesity. The cut-off references for these parameters vary between racial and ethnic groups. We aimed to measure the secular changes and update the reference standards for these three parameters for Thai children in this study.
Materials and Methods: We completed a cross-sectional survey of 3,885 school children 6.0-12.99 y of age in Ongkharak district of central Thailand during May to June 2013. Weight, height and WC were recorded by trained staff using sensitive and calibrated instruments. BMI and WHtR were calculated by standard formulae. The summary estimates were described by gender and whole year age groups. Age and gender specific smoothened percentile curves were created by using least mean squares method. The data was compared with that from a 2008 cohort from the same area.
Results: Age and gender specific percentile data and curves of WC, WHtR and BMI have been provided for Thai children. BMI and WC increased but WHtR changed relatively little with age in both genders. In comparison to 2008, WC and WHtR have increased consistently across all age groups and both genders. The 75th percentile for WHtR corresponded closely to 0.50 in both genders which has been the suggested cut-off.
Conclusion: Since 2008, there have been significant increase in WC and WHtR across all age groups and in both genders in Thai children. These indicate increasing prevalence of central obesity and upcoming cardio-metabolic health problems. This needs to be tackled urgently by creating awareness and promotion of healthy diets and physical activities in school children. WC and WHtR should be routinely measured in paediatric examination for early diagnosis of central obesity.
Body mass index, Children, Obesity, Thailand, Waist circumference, Waist-to-height ratio
Introduction
Childhood obesity is a global public health problem which involves children in low and middle income countries as well and is increasing at a rapid rate, especially in developing economies [1,2]. Body mass index (BMI) has been the commonly used index to characterize obesity. World Health Organization (WHO) released the reference standards of BMI for age and recommended their use for assessment of children everywhere regardless of ethnicity, socio-economic status and type of feeding [3,4]. However, there is evidence that the WHO BMI for age reference may not suitable for all ethnicities [5] and several countries have generated their own BMI references for children [6–13]. Secular changes in BMI have also been reported in children [14–19].
Central obesity, a stage of excessive abdominal and visceral fat, is an important predictor of the metabolic disorders and cardiovascular disease [20, 21]. Waist circumference (WC) and waist-to-height ratio (WHtR) are simple measurement methods for assessment of central obesity. In fact, they may perform better than BMI for prediction of cardio-metabolic risks [22]. Like BMI, the cut-off references of WC and WHtR vary among reports from diverse racial and ethnic backgrounds [23–27]. Secular increasing trends of WC and WHtR have also been observed among children from the high income countries such as UK, Spain, Australia and USA [28–32].
To date, there is no comprehensive report of any national reference data of BMI, waist circumference and WHtR for Thai children and there has been no study looking at the trends of anthropometric changes in these children. Our group had previously reported the percentile sets of waist circumference and WHtR of Thai school children from a cohort of limited number of subjects [23]. Therefore, the present study was conducted to measure the secular changes and update the reference data of BMI, waist circumference and waist-to-height ratio of Thai school children from a large cohort.
Materials and Methods
We conducted a cross-sectional study of anthropometric assessment of school children studying in grades 1 to 6 of public elementary schools in the district of Ongkharak, located in the province of Nakhon Nayok in central Thailand during May to June 2013. Ongkharak district, with a population of 61,236 (December 2012), had 38 elementary schools with a total enrollment of 4,219 children during the study period [33]. All children from 6.0 to 12.99 years of age who were currently studying in these schools were eligible for the study. We excluded children with a known history of of chronic illnesses such as chronic respiratory disease, diabetes mellitus, malignancy, chronic renal disease, congenital heart diseases or chronic liver disease and those with major physical deformities. Children who could not stand upright or bear weight on their legs for measuring their actual height and weight and children who did not appear on the assigned examination date were also excluded. Written informed consent and assent were obtained from children’s parents or guardians and participating children, respectively. The study was approved by the Ethics Committee of the Faculty of Medicine, Srinakharinwirot University, Thailand. The procedures followed were in accordance with the ethical standards of the responsible committee on human experimentation and with the Helsinki Declaration of 1975 that was revised in 2013 [34].
After enrollment, trained staff collected demographic data and performed anthropometric measurements. Weight was measured to the nearest 100 grams using an electronic scale (Tanita Body Composition Analyzer, Model BF-680W, Tokyo, Japan). Height was measured to the nearest millimeter using a height rod (Seca, Model 220, Hamburg, Germany). Waist circumference was measured at the midpoint between the lower costal margin and the top of iliac crest while the subject was in the standing position using a non-stretch tape [35]. Body mass index (BMI) was calculated as weight (in kg) divided by height squared (in meter). Waist to height ratio (WHtR) was calculated as ratio of waist circumference to height. For evaluation of the secular changes in anthropometry, data of the previous cross-sectional survey of school children in the same district from the year 2008 [23] was used to compare with this study.
We have described the data as mean, standard deviation and percentiles by gender and whole-year age groups (e.g. 6.00-6.99 y). We used student’s t-test to assess the significance of the changes in BMI, WC and WHtR between the y 2008 and 2013, and presented the changes as mean differences and 95% confidence interval by genders and whole-year age groups. Age and gender specific smoothened percentile curves for WC, WHtR and BMI were constructed by least mean squares (LMS) method using R statistical package version 3.0.2 with gamlss package version 4.2.6 (to fit the models) and ggplot 2 package version 0.9.3.1 to plot the curves. Statistical analyses were performed with SPSS (version 17.0, IBM-SPSS, Chicago, IL). A P-value < 0.05 was considered statistically significant.
Results
Ofthe 4,219 enrolled school children, parents/guardians of 4,104 gave written informed consent for participant in the study. However, anthropometric measurements could not be completed in 93 children because of being absent on the scheduled day and in 10 children because of migration out of the study area schools before the planned day of examination. Therefore, anthropometric data of 4,001 school children was available. Of the 4,001 data sets, data of 93 children was excluded as per pre-defined exclusion criteria, as on cross-verification, 80 turned out to be younger than 5 y and 13 older than 13 y. Hence, data of 3,885 school-children aged 6-12. 99 y was included in the final analysis.
Among the 3,885 school children, 1,953 (50.3%) were boys. Age and gender-specific means and standard deviations of weight, height, BMI, WC and WHtR are detailed in [Table/Fig-1]. The mean BMI and WC increased with age in both genders, whereas WHtR was relatively constant between 0.46-0.48 in both the genders. [Table/Fig-2] depicts the age and gender specific BMI, WC and WHtR percentiles. The percentile curves also corroborated the observations from [Table/Fig-2] that BMI and WC increased with age in both genders, especially in the 11th and 12th years. On the other hand, WHtR changed relatively little with age in both the genders. The 75th percentile for WHtR corresponded closely to 0.50 in both genders.
Characteristics of population by age and gender
| Age* (years) | n | Weight (kg) | Height (cm) | Body mass index (kg/sq.m.) | Waist circumference (cm) | Waist-to-height ratio |
|---|
| Boys | 6 | 117 | 22.6 (6.9) | 116.1 (6.5) | 16.6 (3.7) | 54.3 (7.2) | 0.47 (0.05) |
| 7 | 360 | 25.3 (8.1) | 120.7 (6.4) | 17.1 (4.0) | 57.4 (9.6) | 0.47 (0.06) |
| 8 | 303 | 27.8 (8.4) | 126.3 (6.2) | 17.2 (4.1) | 59.1 (10.0) | 0.47 (0.07) |
| 9 | 308 | 31.0 (9.5) | 131.5 (6.3) | 17.7 (4.0) | 60.5 (10.2) | 0.46 (0.06) |
| 10 | 290 | 34.3 (10.6) | 136.9 (7.4) | 18.0 (4.0) | 62.5 (10.5) | 0.46 (0.06) |
| 11 | 318 | 39.6(13.5) | 142.4 (8.2) | 19.2 (5.1) | 66.5 (13.2) | 0.47 (0.08) |
| 12 | 257 | 43.0 (15.0) | 147.8 (9.5) | 19.3 (4.9) | 68.6 (13.6) | 0.46 (0.08) |
| Girls | 6 | 139 | 21.3 (4.9) | 115.9 (6.4) | 15.7 (2.6) | 54.0 (6.7) | 0.47 (0.05) |
| 7 | 310 | 23.8 (6.3) | 120.1 (6.1) | 16.3 (3.4) | 55.7 (7.9) | 0.46 (0.06) |
| 8 | 326 | 26.8 (8.0) | 125.5 (7.2) | 16.8 (4.0) | 58.3 (8.7) | 0.46 (0.06) |
| 9 | 298 | 31.8 (10.2) | 132.5 (6.9) | 17.9 (4.4) | 62.2 (10.8) | 0.47 (0.07) |
| 10 | 298 | 35.0 (11.6) | 138.3 (8.6) | 18.0 (4.6) | 63.0 (10.6) | 0.46 (0.07) |
| 11 | 330 | 39.6 (10.9) | 145.1 (8.4) | 18.7 (4.6) | 66.7 (10.2) | 0.46 (0.07) |
| 12 | 231 | 46.0 (13.0) | 150.0 (6.9) | 20.2 (4.7) | 71.5 (11.0) | 0.48 (0.06) |
*Age: a whole year age, e.g. 6 years = 6.0-6.99 years
Age- and gender specific percentiles of body mass index, waist circumference and waist-to-height ratio for Thai school children in the year 2013
| Boys | Girls |
|---|
| Age* (years) | 5th | 15th | 25th | 50th | 75th | 85th | 95th | 5th | 15th | 25th | 50th | 75th | 85th | 95th |
|---|
| Body mass index (kg/sq.m.) |
| Age* (years) | 5th | 15th | 25th | 50th | 75th | 85th | 95th | 5th | 15th | 25th | 50th | 75th | 85th | 95th |
| 6 | 13.43 | 14.23 | 14.75 | 15.58 | 17.31 | 18.40 | 23.99 | 12.75 | 13.55 | 13.96 | 15.27 | 16.93 | 17.67 | 21.25 |
| 7 | 13.23 | 13.95 | 14.45 | 15.91 | 18.53 | 21.62 | 26.00 | 12.94 | 13.60 | 14.15 | 15.38 | 17.46 | 19.28 | 23.81 |
| 8 | 13.22 | 14.03 | 14.65 | 15.84 | 18.71 | 21.06 | 25.61 | 13.06 | 13.89 | 14.50 | 15.66 | 17.83 | 20.10 | 25.72 |
| 9 | 13.56 | 14.32 | 14.90 | 16.39 | 19.60 | 21.78 | 25.84 | 13.03 | 14.11 | 14.72 | 16.32 | 19.83 | 22.99 | 27.00 |
| 10 | 13.62 | 14.47 | 15.09 | 16.91 | 19.57 | 22.42 | 26.19 | 13.58 | 14.44 | 15.00 | 16.87 | 19.61 | 21.83 | 26.08 |
| 11 | 14.00 | 14.92 | 15.55 | 17.40 | 21.72 | 25.12 | 29.27 | 13.88 | 15.16 | 15.84 | 17.58 | 20.57 | 22.46 | 26.84 |
| 12 | 14.19 | 15.42 | 16.21 | 17.76 | 20.86 | 24.02 | 29.68 | 14.76 | 15.80 | 16.81 | 19.04 | 23.14 | 25.38 | 29.97 |
| Age* (years) | 5th | 15th | 25th | 50th | 75th | 90th | 95th | 5th | 15th | 25th | 50th | 75th | 90th | 95th |
|---|
| Waist circumference (cm) |
| 6 | 46.4 | 48.3 | 50.0 | 52.8 | 56.3 | 61.9 | 72.0 | 46.0 | 48.5 | 49.4 | 52.5 | 56.8 | 63.4 | 68.0 |
| 7 | 47.7 | 50.0 | 51.0 | 54.4 | 60.0 | 73.6 | 79.5 | 46.7 | 49.0 | 50.3 | 54.0 | 58.7 | 67.0 | 72.5 |
| 8 | 48.0 | 51.0 | 52.0 | 56.0 | 62.5 | 75.7 | 80.7 | 48.0 | 50.5 | 52.3 | 56.0 | 61.5 | 72.5 | 76.0 |
| 9 | 49.5 | 52.0 | 53.6 | 57.7 | 64.0 | 76.7 | 83.5 | 49.5 | 52.0 | 54.2 | 59.4 | 68.0 | 78.0 | 85.0 |
| 10 | 50.1 | 53.0 | 55.5 | 59.6 | 67.3 | 78.0 | 82.6 | 50.4 | 54.0 | 56.0 | 60.0 | 67.9 | 77.6 | 83.0 |
| 11 | 52.7 | 55.0 | 57.0 | 61.4 | 74.0 | 86.6 | 94.5 | 53.0 | 56.4 | 59.5 | 65.0 | 72.4 | 80.5 | 87.0 |
| 12 | 55.0 | 57.5 | 59.0 | 63.8 | 74.6 | 89.5 | 97.3 | 56.1 | 60.3 | 63.0 | 70.0 | 78.0 | 87.5 | 92.2 |
| Age* (years) | 5th | 15th | 25th | 50th | 75th | 90th | 95th | 5th | 15th | 25th | 50th | 75th | 90th | 95th |
|---|
| Waist-to-height ratio |
| 6 | 0.40 | 0.42 | 0.43 | 0.46 | 0.48 | 0.54 | 0.58 | 0.40 | 0.42 | 0.43 | 0.46 | 0.49 | 0.52 | 0.54 |
| 7 | 0.40 | 0.42 | 0.43 | 0.46 | 0.50 | 0.57 | 0.60 | 0.40 | 0.42 | 0.43 | 0.45 | 0.49 | 0.54 | 0.58 |
| 8 | 0.39 | 0.41 | 0.42 | 0.45 | 0.49 | 0.58 | 0.61 | 0.39 | 0.41 | 0.42 | 0.45 | 0.49 | 0.55 | 0.59 |
| 9 | 0.38 | 0.40 | 0.41 | 0.44 | 0.48 | 0.56 | 0.60 | 0.38 | 0.40 | 0.42 | 0.45 | 0.51 | 0.57 | 0.62 |
| 10 | 0.38 | 0.40 | 0.41 | 0.44 | 0.48 | 0.56 | 0.58 | 0.37 | 0.40 | 0.41 | 0.44 | 0.49 | 0.53 | 0.58 |
| 11 | 0.38 | 0.40 | 0.41 | 0.44 | 0.51 | 0.58 | 0.62 | 0.37 | 0.37 | 0.40 | 0.45 | 0.49 | 0.55 | 0.58 |
| 12 | 0.38 | 0.40 | 0.41 | 0.44 | 0.50 | 0.58 | 0.62 | 0.39 | 0.39 | 0.41 | 0.46 | 0.51 | 0.58 | 0.61 |
*Age: a whole year age, e.g. 6 years = 6.0-6.99 years
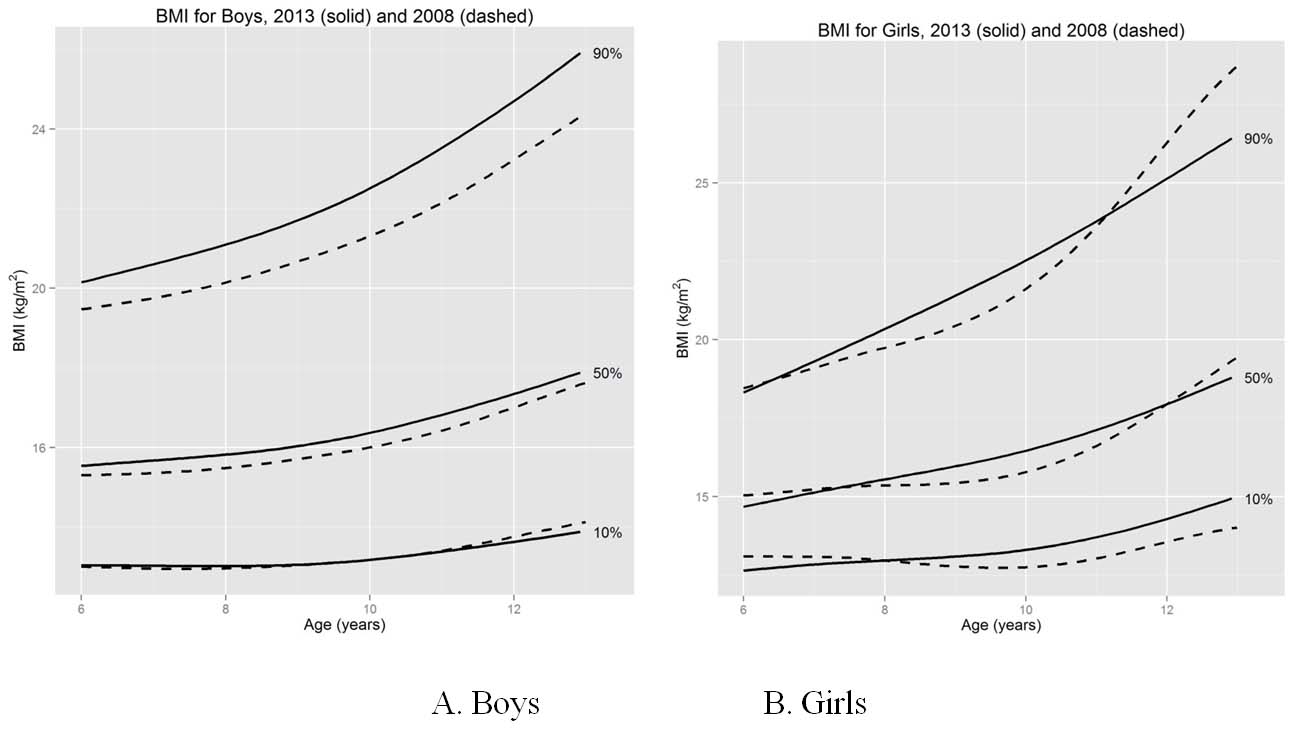
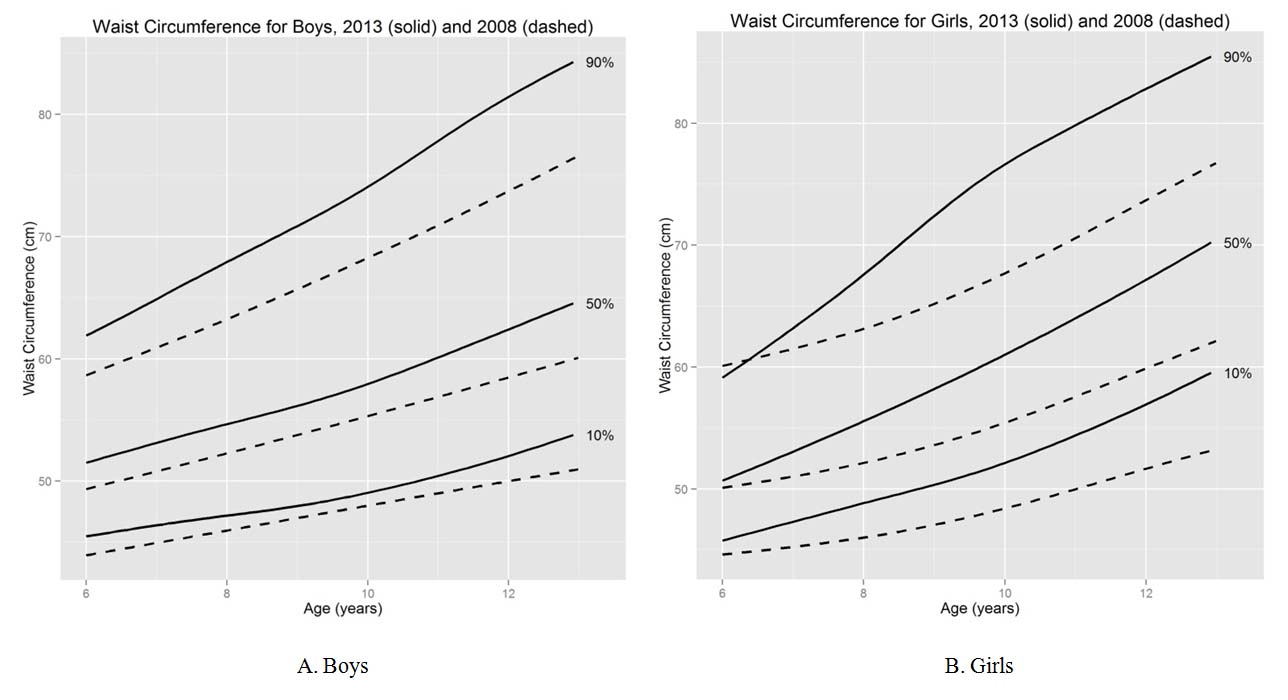
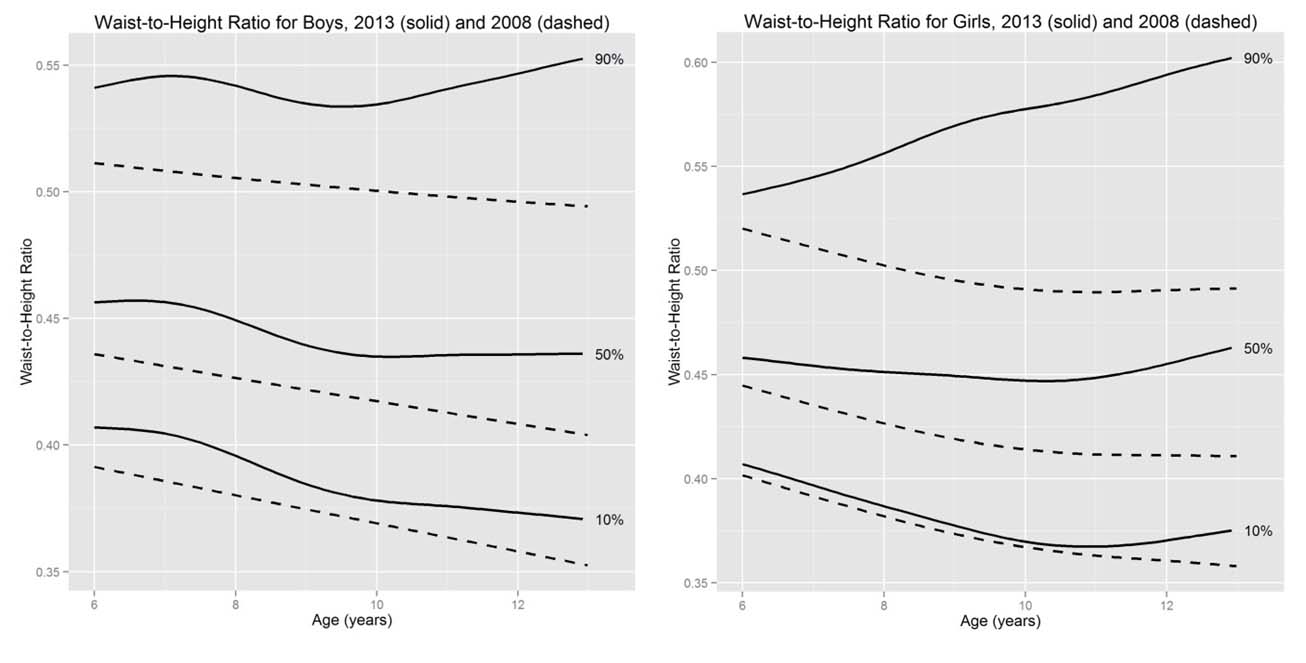
As compared to the previous cohort of school children from the same district in the year 2008, the BMI in year 2013 increased significantly in 8 and 11 y boys (by 0.9 and 1.1 kg/m2 respectively), and 8 and 9 y girls ( by 0.8 and1.1 kg/m2 respectively) [Table/Fig-3]. On the other hand, WC and WHtR increased significantly in all age group in both gender. [Table/Fig-4,5,6] compare the smoothened percentile curves of age and gender specific BMI, WC and WHtR between 2008 and 2013. The percentile curves for BMI, WC as well as WHtR have moved upwards significantly in the five years interval between the two studies.
Comparisons of means (standard deviations) and mean differences of body mass index (BMI), waist circumference and waist-to-height ratio between the present study (2013) and the previous study (2008) from school children in Ongkhaluck province, Thailand
| Age* (years) | N | BMI (kg/sq.m.) | Waist circumference (cm) | Waist-to height ratio |
|---|
| 2008 | 2013 | 2008 | 2013 | Difference | 2008 | 2013 | Difference | 2008 | 2013 | Difference |
|---|
| Boys |
| 6 | 82 | 117 | 16.6 (3.1) | 16.6 (3.7) | -0.01 (-1.0 to 1.0) | 52.3 (6.4) | 54.3 (7.2) | 2.0 (0.1 to 4.0) 2 | 0.45 (0.05) | 0.47 (0.05) | 0.02 (0.004 to 0.03) 2 |
| 7 | 115 | 360 | 16.9 (4.1) | 17.1 (4.0) | 0.2 (-0.7 to 1.0) | 54.1 (8.9) | 57.4 (9.6) | 3.3 (1.3 to 5.3) 2 | 0.45 (0.06) | 0.47 (0.06) | 0.02 (0.01 to 0.04) 2 |
| 8 | 126 | 303 | 16.3 (3.1) | 17.2 (4.1) | 0.9 (0.2 to 1.6) 2 | 54.2 (8.6) | 59.1 (10.0) | 4.8 (2.9 to 6.7) 2 | 0.43 (0.05) | 0.47 (0.07) | 0.04 (0.02 to 0.05) 2 |
| 9 | 154 | 308 | 17.4 (3.8) | 17.7 (4.0) | 0.3 (-0.5 to 1.1) | 58.32 (9.3) | 60.5 (10.2) | 2.1 (0.2 to 4.1) 2 | 0.44 (0.06) | 0.46 (0.06) | 0.02 (0.01 to 0.03) 2 |
| 10 | 165 | 290 | 17.7 (4.3) | 18.0 (4.0) | 0.3 (-0.5 to 1.1) | 59.3 (10.6) | 62.5 (10.5) | 3.2 (1.1 to 5.2) 2 | 0.44 (0.06) | 0.46 (0.06) | 0.02 (0.01 to 0.03) 2 |
| 11 | 164 | 318 | 18.1 (4.2) | 19.2 (5.1) | 1.1 (0.2 to 1.9) 2 | 60.8 (10.8) | 66.5 (13.2) | 5.7 (4.5 to 7.9) 2 | 0.43 (0.06) | 0.47 (0.08) | 0.04 (0.03 to 0.05) 2 |
| 12 | 158 | 257 | 19.0 (4.3) | 19.3 (4.9) | 0.3 (-0.6 to 1.3) | 63.5 (12.3) | 68.6 (13.6) | 5.1 (2.5 to 7.7) 2 | 0.43(0.08) | 0.46 (0.08) | 0.03 (0.02 to 0.05) 2 |
| Girls | 0.45 (0.05) | |
| 6 | 82 | 139 | 15.9 (2.9) | 15.7 (2.6) | 15.7 (2.6) | 52.0 (6.9) | 54.0 (6.7) | 1.9 (0.1 to 3.8) 2 | 0.45 (0.06) | 0.47 (0.05) | 0.01 (0.002 to 0.03) 2 |
| 7 | 104 | 310 | 16.8 (3.4) | 16.3 (3.4) | 16.3 (3.4) | 54.3 (8.6) | 55.7 (7.9) | 1.4 (-0.4 to 3.2) | 0.43 (0.04) | 0.46 (0.06) | 0.01 (0.001 to 0.3) 2 |
| 8 | 111 | 326 | 16.0 (2.8) | 16.8 (4.0) | 16.8 (4.0) | 53.4 (6.7) | 58.3 (8.7) | 4.9 (3.4 to 6.5) 2 | 0.42 (.0.06) | 0.46 (0.06) | 0.04 (0.03 to 0.05) 2 |
| 9 | 130 | 298 | 16.8 (4.3) | 17.9 (4.4) | 17.9 (4.4) | 55.8 (9.4) | 62.2 (10.8) | 6.4 (4.4 to 8.5) 2 | 0.42 (0.06) | 0.47 (0.07) | 0.05 (0.03 to 0.06) 2 |
| 10 | 145 | 298 | 17.6 (4.0) | 18.0 (4.6) | 18.0 (4.6) | 58.7 (9.3) | 63.0 (10.6) | 4.4 (2.3 to 6.4) 2 | 0.42 (0.05) | 0.46 (0.07) | 0.03 (0.02 to 0.04) 2 |
| 11 | 192 | 330 | 18.3 (3.9) | 18.7 (4.6) | 18.7 (4.6) | 60.7 (9.5) | 66.7 (10.2) | 6.0 (4.2 to 7.8) 2 | 0.42 (0.05) | 0.46 (0.07) | 0.04 (0.03 to 0.05) 2 |
| 12 | 149 | 231 | 19.5 (4.1) | 20.3 (4.7) | 20.3 (4.7) | 62.6 (9.1) | 71.5 (11.0) | 8.9 (6.9 to 10.9) 2 | 0.45 (0.05) | 0.48 (0.06) | 0.06 (0.05 to 0.7) 2 |
*Age: a whole year age, e.g. 6 years = 6.0-6.99 years; 2p<0.05 for the difference between years of study
Comparisons of body mass index (BMI) percentile curves for the present study (2013) with the previous study (2008) among boys (A) and girls (B) from schoolchildren in Ongkhaluck province, Thailand
Comparisons of waist circumference percentile curves for the present study (2013) with the previous study (2008) among boys (A) and girls (B) from schoolchildren in Ongkhaluck province, Thailand
Comparisons of waist-to-height ratio percentile curves for the present study (2013) with the previous study (2008) among boys (A) and girls (B) from schoolchildren in Ongkhaluck province, Thailand
Discussion
In this cross-sectional anthropometric assessment of a large cohort of Thai school children of 6.0-12.99 yrs age, we have shown a significant increase in WC and WHtR in both genders of all age groups as compared to data obtained in 2008. In comparison, the changes in BMI were not consistent across all age groups. This study provides the updated reference values of BMI, waist circumferences and waist-to-height ratio of school children 6.0-12.99 y of age from central Thailand.
In general, our findings are consistent with the secular increases noted by other researchers from Europe and USA [28–32]. McCarthy et al., reported that young (aged 2-5 y) British children had on an average increased their waist circumferences by 0.11 cm/year in boys and 0.20 cm/year in girls from 1987 to 1998 [31] while youth aged 11-16 yrs had an average increase of 0.35 cm/y in boys and 0.62 cm/y in girls from1977 to 1997 [30]. The greater increase of waist circumference in girls than in boys has also been reported by others. Moreno et al., reported that Spanish adolescents aged 13-14 yrs had increased waist circumference by 0.53-0.86 cm/y in boys and 0.67-0.87 cm/y in girls from 1995 to 2002 [32]. US National Health and Nutrition Examination Surveys conduct between 1998 and 2004 indicated that waist circumference had increased by an average 0.31 and 0.39 cm/year in boys and girls aged 12-17 yrs, respectively [29]. We also found that girls had greater increase in waist circumference than boys (0.4-1.8 cm/y in girls and 0.4-1.0 cm/y in boys).We also noted a new finding of significant increase in WHtR in both genders. As WC and WHtR are proxy measures of central obesity which is associated with increased cardio-metabolic risks [20,21], the significant increase of both WC and WHtR in Thai children in just five years span is reflective of rapidly increasing prevalence of obesity and risks of related health problems.
Our observations of consistent secular changes in WC and WHtR but not in BMI indicate that BMI may not be a sensitive measure to detect changes in prevalence of central obesity. Other have also observed that WC increased to a greater degree compared to the BMI [28,30–32]. Though BMI is commonly used to characterize obesity, it is not directly indicative of body fat distribution and using it alone as indicator of adiposity may result in underestimation of the health risks [36]. BMI represents the sum of fat and fat free mass but it does not tell the relative contribution of each [37]. Moreover, although the proportion of fat and fat-free mass changes during life, an increase in one may be obscured by the reduction of other component [38]. WC and WHtR are simple measures of central obesity associated with visceral fat and the risks of cardio-metabolic disorders [22,39]. Veldhuis et al., showed that BMI hadonly moderate agreement with WC and WHtR and might not be sensitive among relative tall or short children [36]. WC and WHtR have been recently recommended as part of anthropometric measurements to identify and monitor obesity in pediatric general practice [29,36]. There is no consensus on cut-off values for WC and WHtR for defining obesity in children. Most investigators have used the 90th percentile of age and gender specific curves [30,36]. Cook et al., defined metabolic syndrome in children based on data from the National Cholesterol Education Program/Adult Treatment Panel III (NCEP/ATP-III) using waist circumference of ≥ 90th percentile for age and gender as the criteria [40]. Another classification which is widely accepted for metabolic syndrome in children was defined by de Ferranti et al., [41]. This group defined the obesity criteria for diagnosis of metabolic syndrome in children as WC> 75th percentile for age and gender. There has been a recent surge of interest in WHtR as a method for assessment of central obesity in children. There is evidence WHtR has high correlation with visceral adiposity and the cardio-metabolic risk factors in children [22,42,43]. WHtRis relatively age-independent, which may make it is a more convenient assessment method than WC as it may not need age- specific references [22,42]. However, one study in Chinese children from Hong Kong showed that WHtR varied by age and gender [27]. On closer scrutiny however, the variation for 75th percentile was only from 0.42 to 0.46 in girls and 0.43 to 0.48 in boys which is significantly lower than the variations in BMI and WC. Our findings are consistent with majority of reports that WHtR is relatively age-independent as the 50th percentile values for children aged 6.0-12.99 y were in the range of 0.44-0.46 in both genders. The 75th percentiles of WHtR in both genders were close to 0.5 (0.49 to 0.51 in girls and 0.48 to 0.51 in boys) which is the commonly recommended cut-off in children [44–46]. The WHtR cut-off for children at ≥0.5 was adopted from adults [42], however, some investigators prefer using >90th percentileas the criteria [36]. To date, prospective studies are not available to elucidate the best correlation and predictive risks of cardio-metabolic complications of obesity based on different cut-offs and percentiles of WC or WHtR.
Conclusion
We found that over last five years, Thai school children had significant increases in waist circumference and waist-to-height ratio across all age groups and in both genders and a trend of increasing BMI in some age groups. These findings reflect increasing prevalence of central obesity and are indicators of potential increase in cardio-metabolic health problems in coming years. A national strategy of interventions in the form of promoting healthy diets and physical activities in schoolchildren is urgently needed to control the upcoming epidemic of cardiac and metabolic problems. We believe that WC and WHtR should be routinely measured in pediatric general practice for early diagnosis of central obesity.
*Age: a whole year age, e.g. 6 years = 6.0-6.99 years
*Age: a whole year age, e.g. 6 years = 6.0-6.99 years
*Age: a whole year age, e.g. 6 years = 6.0-6.99 years; 2p<0.05 for the difference between years of study
[1]. De Onis M, Blossner M, Borghi E, Global prevalence and trends of overweight and obesity among preschool childrenAm J Clin Nutr 2010 92:1257-64. [Google Scholar]
[2]. Wang Y, Lobstein T, Worldwide trends in childhood overweight and obesityInt J Pediatr Obes 2006 1:11-25. [Google Scholar]
[3]. WHO Child Growth Standards based on length/height, weight and ageActa Paediatr Suppl 2006 450:76-85. [Google Scholar]
[4]. de Onis M, Onyango AW, Borghi E, Development of a WHO growth reference for school-aged children and adolescentsBull World Health Organ 2007 85:660-67. [Google Scholar]
[5]. Deurenberg-Yap M, Chew SK, Lin VF, Relationships between indices of obesity and its co-morbidities in multi-ethnic SingaporeInt J Obes Relat Metab Disord 2001 25:1554-62. [Google Scholar]
[6]. Abdulrazzaq YM, Nagelkerke N, Moussa MA, UAE population reference standard charts for body mass index and skinfold thickness, at ages 0-18 yearsInt J Food Sci Nutr 2011 62:692-702. [Google Scholar]
[7]. Al Herbish AS, El Mouzan MI, Al Salloum AA, Body mass index in Saudi Arabian children and adolescents: a national reference and comparison with international standardsAnn Saudi Med 2009 29:342-47. [Google Scholar]
[8]. Ben Amara H, Jelidi J, Bouguerra R, Tunisian children reference for body mass index and prevalence of obesityTunis Med 2008 86:906-11. [Google Scholar]
[9]. Inokuchi M, Matsuo N, Anzo M, Body mass index reference values (mean and SD) for Japanese childrenActa Paediatr 2007 96:1674-76. [Google Scholar]
[10]. Karklina H, Krumina D, Ebela I, A cross sectional research on the height, weight and body mass index of children aged 5-6 years in Latvia and its secular changes during the last centuryCent Eur J Public Health 2013 21:3-7. [Google Scholar]
[11]. Marwaha RK, Tandon N, Ganie MA, Nationwide reference data for height, weight and body mass index of Indian schoolchildrenNatl Med J India 2011 24:269-77. [Google Scholar]
[12]. Nielsen AM, Olsen EM, Juul A, New Danish reference values for height, weight and body mass index of children aged 0-5 yearsActa Paediatr 2010 99:268-78. [Google Scholar]
[13]. Ozturk A, Mazicioglu MM, Hatipoglu N, Reference body mass index curves for Turkish children 6 to 18 years of ageJ Pediatr Endocrinol Metab 2008 21:827-36. [Google Scholar]
[14]. Danker-Hopfe H, Roczen K, Secular trends in height, weight and body mass index of 6-year-old children in BremerhavenAnn Hum Biol 2000 27:263-70. [Google Scholar]
[15]. Herpertz-Dahlmann B, Geller F, Bohle C, Secular trends in body mass index measurements in preschool children from the City of Aachen, GermanyEur J Pediatr 2003 162:104-09. [Google Scholar]
[16]. Johnson W, Chumlea WC, Czerwinski SA, Secular trends in the fat and fat-free components of body mass index in children aged 8-18 years born 1958-1995Ann Hum Biol 2013 40:107-10. [Google Scholar]
[17]. Meigen C, Keller A, Gausche R, Secular trends in body mass index in German children and adolescents: a cross-sectional data analysis via CrescNet between 1999 and 2006Metabolism 2008 57:934-39. [Google Scholar]
[18]. Tremblay MS, Willms JD, Secular trends in the body mass index of Canadian childrenCMAJ 2000 163:1429-33. [Google Scholar]
[19]. Ying-Xiu Z, Shu-Rong W, Secular trends in body mass index and the prevalence of overweight and obesity among children and adolescents in Shandong, China, from 1985 to 2010J Public Health (Oxf) 2012 34:131-37. [Google Scholar]
[20]. Kelishadi R, Gheiratmand R, Ardalan G, Association of anthropometric indices with cardiovascular disease risk factors among children and adolescents: CASPIAN StudyInt J Cardiol 2007 117:340-48. [Google Scholar]
[21]. Maffeis C, Pietrobelli A, Grezzani A, Waist circumference and cardiovascular risk factors in prepubertal childrenObes Res 2001 9:179-87. [Google Scholar]
[22]. Savva SC, Tornaritis M, Savva ME, Waist circumference and waist-to-height ratio are better predictors of cardiovascular disease risk factors in children than body mass indexInt J Obes Relat Metab Disord 2000 24:1453-58. [Google Scholar]
[23]. Rerksuppaphol L, Rerksuppaphol S, Waist circumference and waist-to-height ratio percentiles of Thai school-aged childrenInternational Journal of Collaborative Research on Internal Medicine & Public Health 2013 5:19-29. [Google Scholar]
[24]. Eisenmann JC, Waist circumference percentiles for 7- to 15-year-old Australian childrenActa Paediatr 2005 94:1182-85. [Google Scholar]
[25]. Fernandez JR, Redden DT, Pietrobelli A, Waist circumference percentiles in nationally representative samples of African-American, European-American, and Mexican-American children and adolescentsJ Pediatr 2004 145:439-44. [Google Scholar]
[26]. Mushtaq MU, Gull S, Abdullah HM, Waist circumference, waist-hip ratio and waist-height ratio percentiles and central obesity among Pakistani children aged five to twelve yearsBMC Pediatr 2011 11:105 [Google Scholar]
[27]. Sung RY, So HK, Choi KC, Waist circumference and waist-to-height ratio of Hong Kong Chinese childrenBMC Public Health 2008 8:324 [Google Scholar]
[28]. Garnett SP, Baur LA, Cowell CT, The prevalence of increased central adiposity in Australian school children 1985 to 2007Obes Rev 2011 12:887-96. [Google Scholar]
[29]. Li C, Ford ES, Mokdad AH, Recent trends in waist circumference and waist-height ratio among US children and adolescentsPediatrics 2006 118:1390-98. [Google Scholar]
[30]. McCarthy HD, Ellis SM, Cole TJ, Central overweight and obesity in British youth aged 11-16 years: cross sectional surveys of waist circumferenceBMJ 2003 326:624 [Google Scholar]
[31]. McCarthy HD, Jarrett KV, Emmett PM, Trends in waist circumferences in young British children: a comparative studyInt J Obes (Lond) 2005 29:157-62. [Google Scholar]
[32]. Moreno LA, Sarria A, Fleta J, Secular trends in waist circumference in Spanish adolescents, 1995 to 2000-02Arch Dis Child 2005 90:818-19. [Google Scholar]
[33]. The Office of Provincial Election Commission of Nakhonnayok. Population and voter of Nakorn Nayok province [Internet]. 2012 [cited 2014 May 16]. Available form: http://www2.ect.go.th/about.php?Province=nakhonnayok&SiteMenuID=1231 [Google Scholar]
[34]. World Medical Association. WMA Declaration of Helsinki - Ethical principles for medical research involving human subjects [Internet]. 1975 Oct [updated 2013 Oct; cited 2014 May 16]. Available from: http://www.wma.net/en/30publications/10policies/b3/index.html [Google Scholar]
[35]. World Health Organization. Waist Circumference and Waist–Hip Ratio: Report of a WHO Expert Consultation. Geneva: WHO Document Production Services; 2008 December. 47p [Google Scholar]
[36]. Veldhuis L, Vogel I, Jansen W, Moderate agreement between body mass index and measures of waist circumference in the identification of overweight among 5-year-old children; the ‘be active, eat right’ studyBMC Pediatr 2013 13:63 [Google Scholar]
[37]. Maynard LM, Wisemandle W, Roche AF, Childhood body composition in relation to body mass indexPediatrics 2001 107:344-50. [Google Scholar]
[38]. Wells JC, Coward WA, Cole TJ, The contribution of fat and fat-free tissue to body mass index in contemporary children and the reference childInt J Obes Relat Metab Disord 2002 26:1323-28. [Google Scholar]
[39]. Brambilla P, Bedogni G, Moreno LA, Crossvalidation of anthropometry against magnetic resonance imaging for the assessment of visceral and subcutaneous adipose tissue in childrenInt J Obes (Lond) 2006 30:23-30. [Google Scholar]
[40]. Cook S, Weitzman M, Auinger P, Prevalence of a metabolic syndrome phenotype in adolescents: findings from the third National Health and Nutrition Examination Survey, 1988-1994Arch Pediatr Adolesc Med 2003 157:821-27. [Google Scholar]
[41]. de Ferranti SD, Gauvreau K, Ludwig DS, Prevalence of the metabolic syndrome in American adolescents: findings from the Third National Health and Nutrition Examination SurveyCirculation 2004 110:2494-97. [Google Scholar]
[42]. Ashwell M, Cole TJ, Dixon AK, Ratio of waist circumference to height is strong predictor of intra-abdominal fatBMJ 1996 313:559-60. [Google Scholar]
[43]. Graves L, Garnett SP, Cowell CT, Waist-to-height ratio and cardiometabolic risk factors in adolescence: findings from a prospective birth cohortPediatr Obes 2014 9:327-28. [Google Scholar]
[44]. McCarthy HD, Ashwell M, A study of central fatness using waist-to-height ratios in UK children and adolescents over two decades supports the simple message–‘keep your waist circumference to less than half your height’Int J Obes (Lond) 2006 30:988-92. [Google Scholar]
[45]. Browning LM, Hsieh SD, Ashwell M, A systematic review of waist-to-height ratio as a screening tool for the prediction of cardiovascular disease and diabetes: 0.5 could be a suitable global boundary valueNutr Res Rev 2010 23:247-69. [Google Scholar]
[46]. Ashwell M, Hsieh SD, Six reasons why the waist-to-height ratio is a rapid and effective global indicator for health risks of obesity and how its use could simplify the international public health message on obesityInt J Food Sci Nutr 2005 56:303-07. [Google Scholar]