Evolution caused humans to obtain an upright posture, since then man has had complaints of back pain. Pain can occur due to numerous causes. Stenosis of the lumbar canal causing nerve root compression is of great interest to the medical practitioner. Spinal stenosis is defined as the focal, segmental or diffuse narrowing of the central canal or root canals by bony and/or soft tissue elements resulting in encroachment on the neural structures [1]. Lumbar spinal stenosis was classified by Arnoldi as congenital, acquired (75%) or due to combination of both [2].
MRI provides the best definition of the abnormal anatomy of the spinal canal. MRI is considered to be the study of choice in the diagnosis of spinal stenosis because the discs, soft tissues, bony changes and intrathecal contents can be visualised [3]. Hence in our study MRI images are obtained and various dimensions of the lumbar vertebrae have been measured.
Stenosis is a quantitative diagnosis that is made when the measurement of an individual is outside the range of normal. Therefore, the criteria for stenosis should be developed from an analysis of a normative distribution of measurements within a population [4]. The most frequently applied criteria were measurement of the anterior-posterior diameter of the osseous spinal canal and of the cross-sectional area of the dural sac for central stenosis as well as measurement of the height of the recess for lateral stenosis [5]. Various studies have been undertaken in order to classify and predict the occurrence of lumbar canal stenosis. In 1980, Ulrich defined lumbar spinal stenosis as a canal transverse area less than 145mm2. He established that the cross sectional area of the vertebral canal is reliable in predicting canal stenosis [6]. Schonstrom et al., established criteria for diagnosis of lumbar canal stenosis; absolute spinal stenosis (Dural sac cross sectional area of 0-74mm2) relative spinal stenosis (75-99mm2) and no spinal stenosis (>100mm2) [7]. In the present study an attempt is made to estimate the dimensions of the lumbar canal. The canal body ratio and the ratio of the dural sac to the vertebral body have been calculated. The resulting constant values can enable the prediction of stenosis of the lumbar central canal.
Materials and Methods
One hundred and fifty four MRI scan records of the lumbar spine of subjects were collected from the Department of Radiology, Kasturba Medical College, Mangalore, Manipal University between December 2011 to May 2013. 77, T2 weighted sagittal and axial sections MRI scans of males and females each were analysed. The sample size of 154 subjects was calculated using the formula
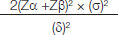
Where, Zα – Level of significance (95%), Zβ – Required Power (90%), σ – Anticipated standard deviation of the parameter = 1.95, δ – Test value of the difference between means = 1.02.
Randomly selected lumbar spine MRI’s of patients of known sex and age from 20 - 80 y were taken. The indications of the lumbar spine MRI would include low back pain and neurological claudication. The exclusion criteria included patients with previously diagnosed congenital anomalies of the spine. Patients with history of spinal disease conditions (confirmed through clinical and radiological findings) like disc bulge, disc prolapse, Kypho-scoliosis and patients with lumbar spinal fractures following trauma were excluded.
Institutional ethical clearance was obtained, letter dated 14-11-2011. The scanned images were viewed using DICOM viewer and the following dimensions were measured.
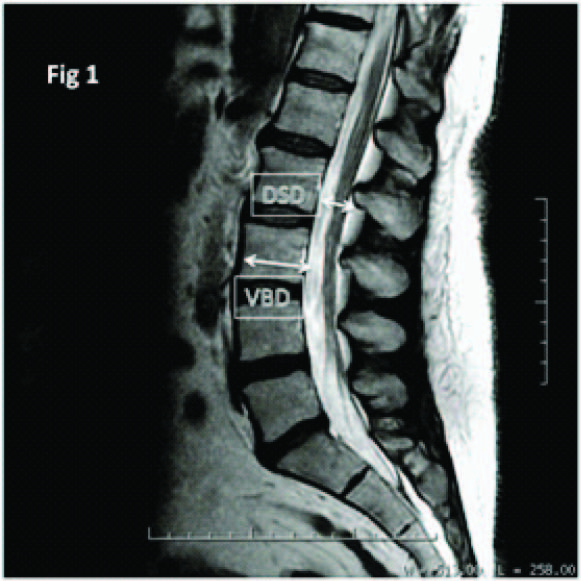
The Vertebral Body Diameter (VBD) measured between the anterior and posterior border at the middle of each vertebral body of L1 to L5 lumbar vertebrae on T2 sagittal section MRI of lumbar spine. The Dural Sac Diameter (DSD) measured between the posterior wall of the vertebral body to the anterior border of the spinous process on the T2 sagittal section MRI of lumbar spine at L1 to L5 [8] [Table/Fig-1] The Canal Body Ratio (CBR) calculated by dividing the DSD by the VBD. In a study by Mohammed el Rakhwey a similar canal body ratio was measured on dry bones by measuring the interpedicular distance to calculate the vertebral foramen diameter [9].
Comparison of the Vertebral Body Diameter in males & females (n=154)
| Vertebral Level | Gender | Mean | Standard Deviation | T |
|---|
| L1 | M | 25.66 | 2.84 | 5.09 |
| F | 23.24 | 3.03 |
| L2 | M | 26.53 | 2.01 | 5.82 |
| F | 24.26 | 2.76 |
| L3 | M | 27.75 | 3.59 | 4.34 |
| F | 25.48 | 2.86 |
| L4 | M | 29.14 | 2.68 | 6.51 |
| F | 26.26 | 2.80 |
| L5 | M | 30.31 | 2.36 | 7.42 |
| F | 26.96 | 3.17 |
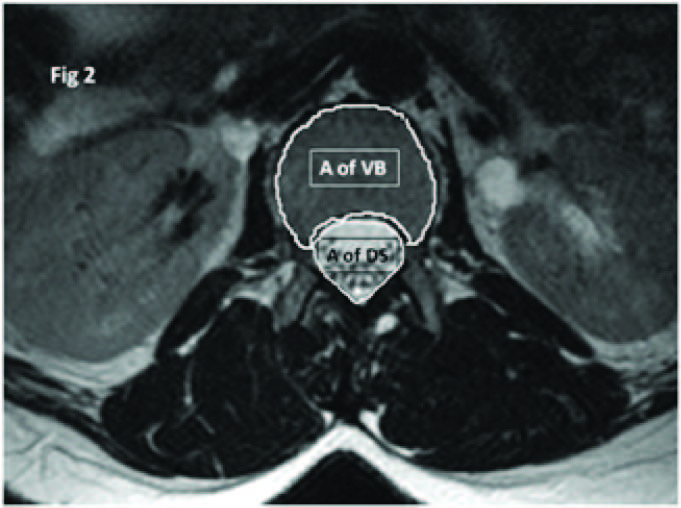
The cross-sectional area containing the dural sac is measured through the midpoint of the posterior border of the disc and ligament flavum on each side on T2 axial section of MRI lumbar spine at L1 to L5 lumbar vertebral levels. The area can be measured manually by using pencil tool to calculate area through the DICOM image computer software. The cross sectional area of the lumbar vertebral body on T2 axial section of MRI lumbar spine of the first to the fifth lumbar vertebral bodies on T2 axial section of MRI lumbar spine at L1 to L5 lumbar vertebral levels. The area was measured as depicted above [Table/Fig-2] [10]. The ratio of the dural sac cross sectional area to the vertebral body cross sectional area of the lumbar vertebrae L1 to L5 was calculated. Calculation of this ratio as a criteria to predict the occurrence of canal stenosis was a new method that was performed in our study.
Comparison of the Dural Sac Diameter in males & females at all lumbar vertebral levels (n=154)
| Vertebral Level | Gender | Mean | Standard Deviation | T |
|---|
| L1 | M | 18.05 | 3.24 | 5.07 |
| F | 15.68 | 2.40 |
| L2 | M | 17.31 | 4.04 | 5.82 |
| F | 14.06 | 2.69 |
| L3 | M | 16.48 | 3.27 | 3.16 |
| F | 14.98 | 2.53 |
| L4 | M | 16.18 | 2.79 | 3.77 |
| F | 14.14 | 2.20 |
| L5 | M | 15.83 | 2.46 | 5.16 |
| F | 13.92 | 2.10 |
Statistical Analysis
The data collected was tabulated and computer based statistical analysis was done using SPSS software. The students unpaired t-test was employed for statistical analysis.
Results
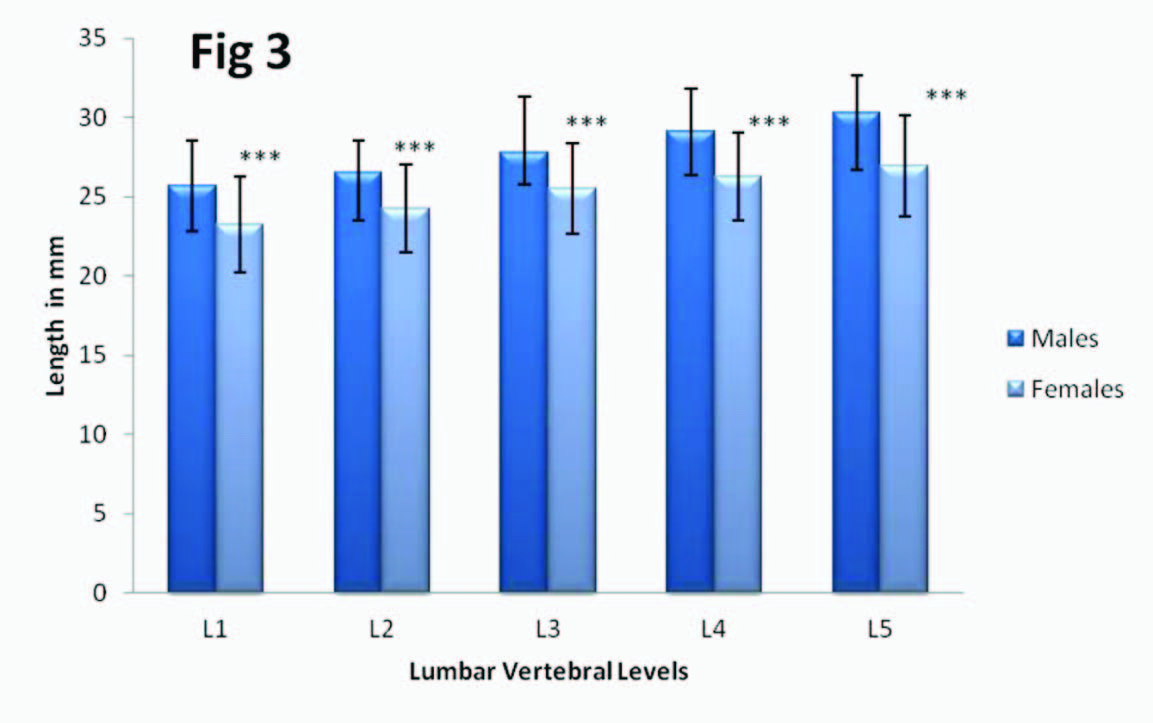
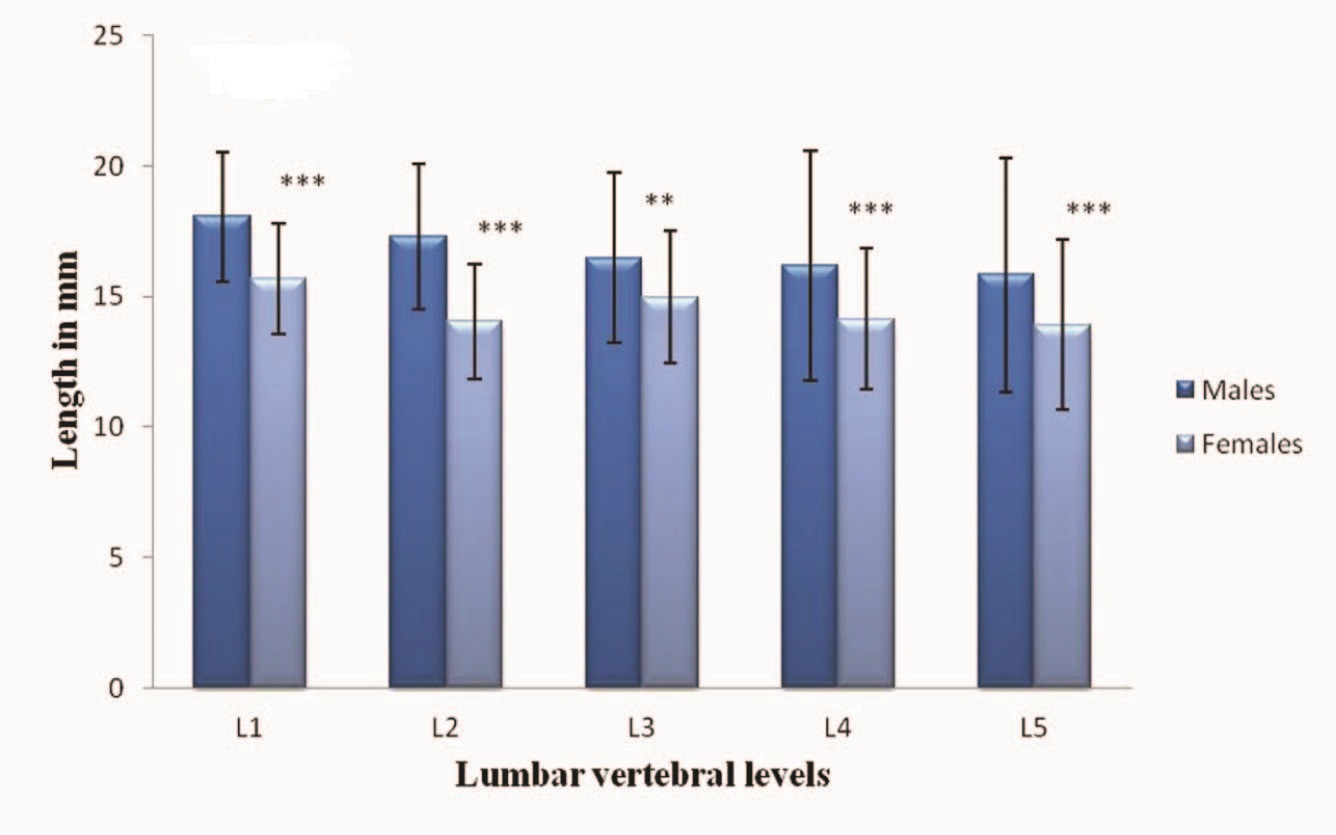
The Mean Diameter of the Lumbar Vertebral Body showed a gradual increase in size craniocaudally from the first to the fifth lumbar vertebral levels, while, the Mean Dural Sac Diameter showed a craniocaudal decrease in size [Table/Fig-3, 4]. The difference in the mean vertebral body diameter between males and females was found to be extremely significant with p-value <0.0001 at all the five lumbar levels [Table/Fig-5]. The difference in the mean dural sac diameter between males and females was found to be extremely significant with p-value <0.0001 at L1, L2 and L5 vertebral levels, at L4 vertebral level p-value was 0.0002 and was found to be extremely significant. At L3 level p-value was 0.0019 and it was found to be very significant [Table/Fig-6].
MRI T2 Sagittal section of the lumbar vertebrae illustrating the landmarks used for measuring the Vertebral body diameter and the Dural sac diameter
MRI T2 Sagittal section of the lumbar vertebrae illustrating the landmarks used for measuring the area of the vertebral body and the area of the dural sac
Comparison of the Mean Vertebral Body Diameter among males & females. Values expressed as mean+ SD (n=154) where *** denotes extremely significant with ’p value’ <0.001
Comparison of the Mean Dural Sac Diameter among males & females. Values expressed as mean+ SD (n=154) where *** denotes extremely significant ’p value’ <0.001 and ** denotes very significant ’p value’ <0.01
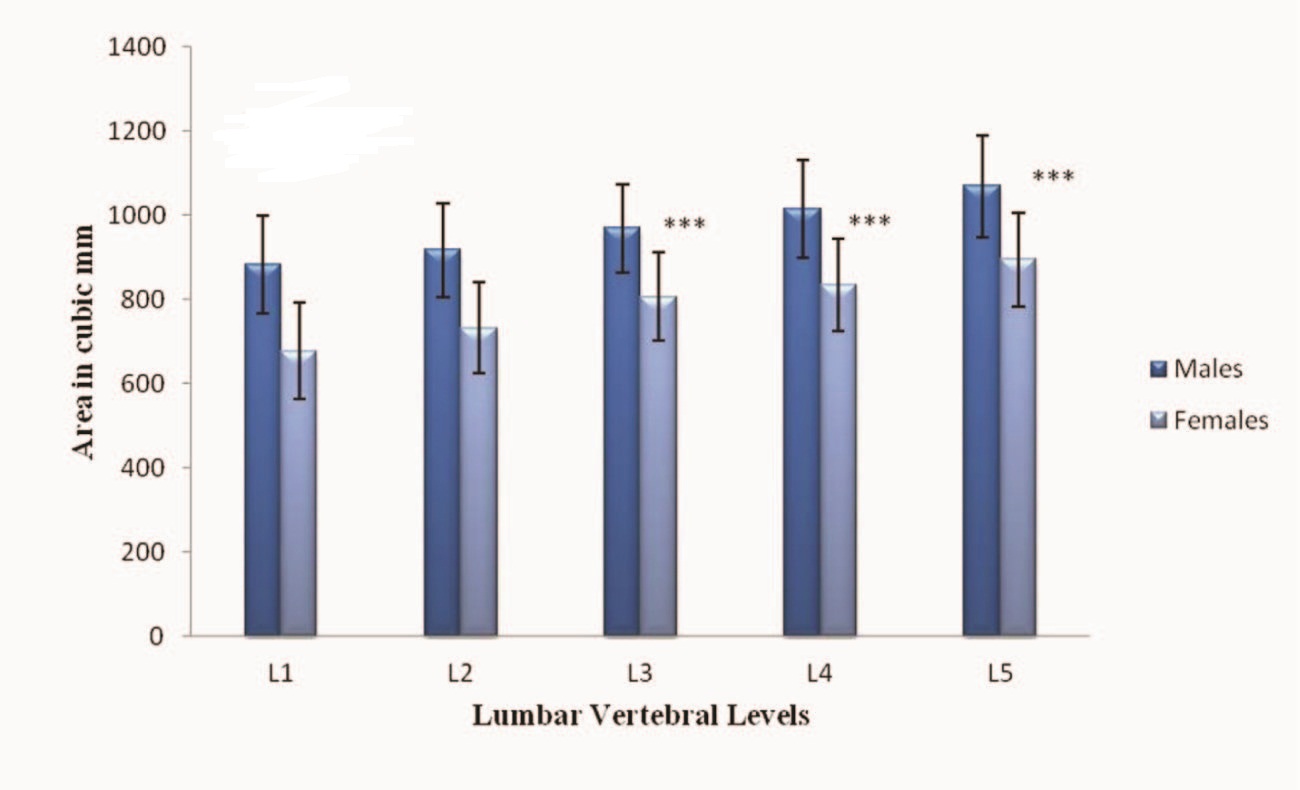
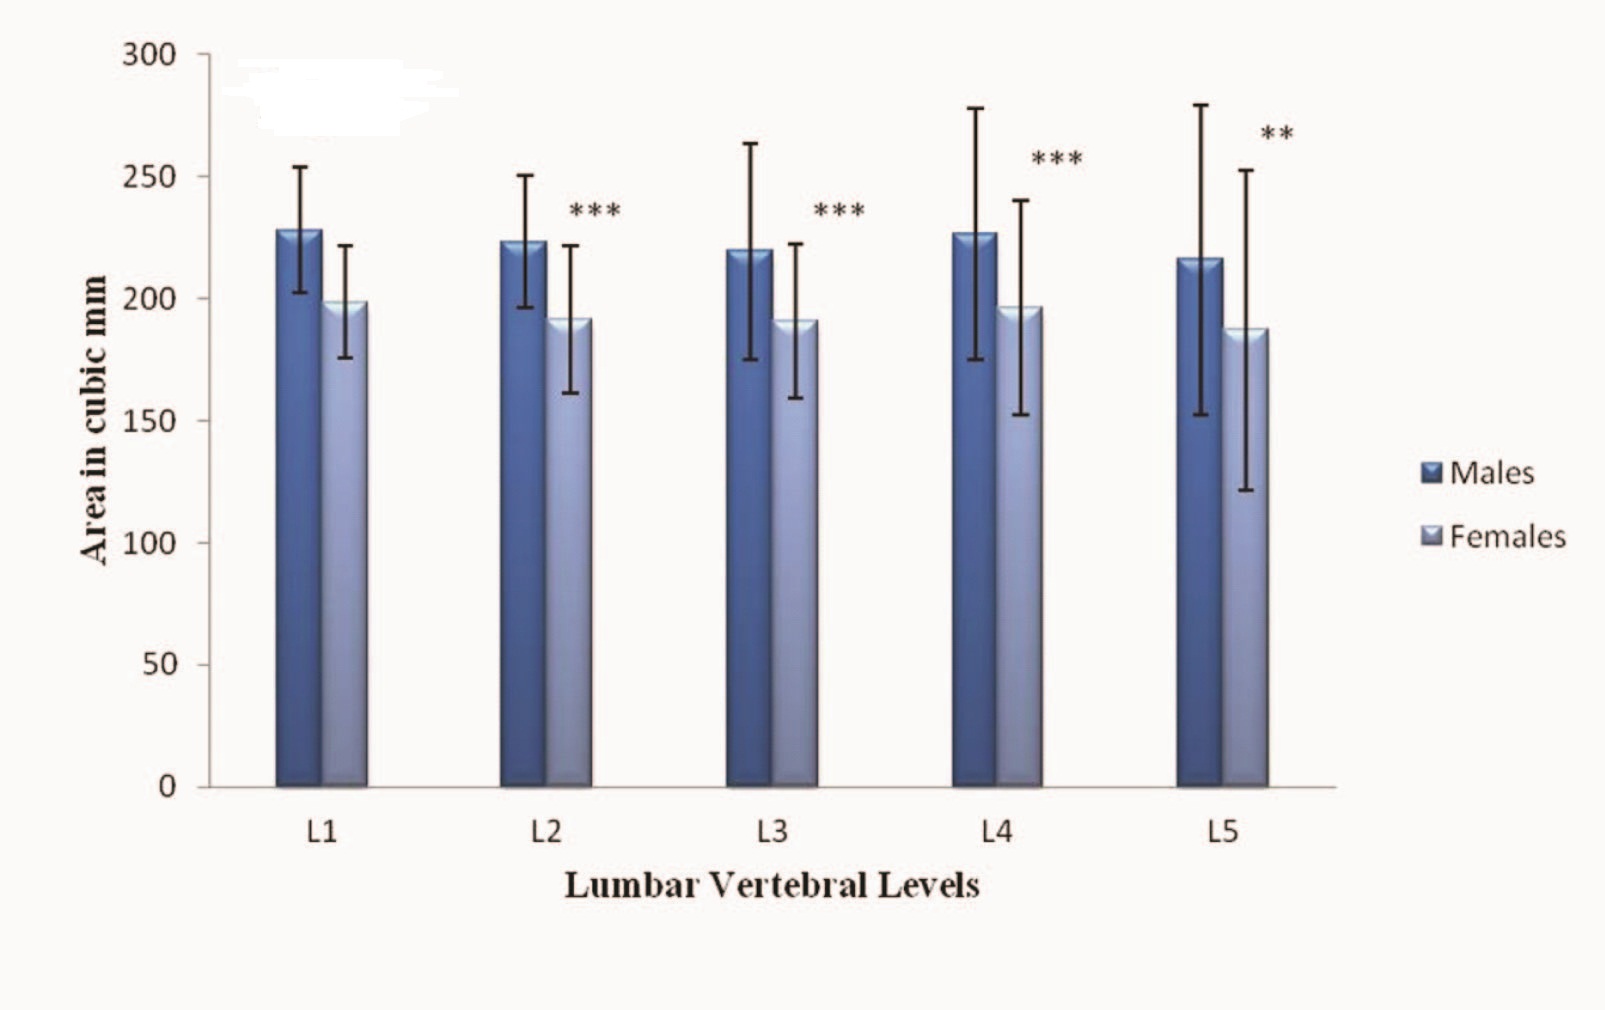
The Mean Area of the Vertebral Body showed a definite cranio-caudal increase from the L1 to L5 vertebral levels [Table/Fig-7]. The difference in the mean area of the vertebral body between males and females was found to be extremely significant with p-value <0.001 at all five lumbar vertebral levels [Table/Fig-8]. The Mean Area of the Dural Sac decreases in cranio-caudal direction from L1 to L5 vertebral levels [Table/Fig-9]. On comparison between males and females the mean area of the dural sac was found to be extremely significant with p-value <0.001 at all five lumbar vertebral levels [Table/Fig-10]. Both the diameters and the cross sectional areas were found to be increased in males as compared to females. This suggests the presence of larger vertebral bodies and dural sacs in males.
Comparison of the Area of Vertebral Body in males & females(n=154)
| Vertebral Level | Gender | Mean | Standard Deviation | T |
|---|
| L1 | M | 883.64 | 116.30 | 11.12 |
| F | 677.01 | 114.09 |
| L2 | M | 917.01 | 110.17 | 10.49 |
| F | 732.08 | 108.49 |
| L3 | M | 968.44 | 105.17 | 9.55 |
| F | 806.23 | 105.46 |
| L4 | M | 1014.3 | 115.70 | 9.93 |
| F | 834.29 | 109.09 |
| L5 | M | 1068.7 | 120.75 | 9.28 |
| F | 894.29 | 112.10 |
Comparison of the Mean Area of the Vertebral Body among males & females. Values expressed as mean+ SD (n=154) where *** denotes extremely significant ’p value’ <0.001
Comparison of the Area of the Dural Sac in males and females (n=154)
| Vertebral Level | Gender | Mean | Standard Deviation | T |
|---|
| L1 | M | 228.18 | 25.71 | 7.53 |
| F | 198.57 | 23.01 |
| L2 | M | 223.35 | 26.87 | 6.93 |
| F | 191.43 | 30.16 |
| L3 | M | 219.35 | 44.13 | 4.64 |
| F | 190.66 | 31.49 |
| L4 | M | 226.57 | 51.29 | 3.92 |
| F | 196.36 | 44.12 |
| L5 | M | 215.92 | 51.35 | 3.20 |
| F | 187.11 | 59.76 |
Comparison of the Mean Area of the Dural Sac among males and females. Values expressed as mean+ SD (n=154) where *** denotes extremely significant ’p value’ <0.001 ** denotes very significant ’p value’ <0.01
The CBR was calculated and was found to be 0.6 from L1 to L3 levels and 0.5 at L4 and L5 levels [Table/Fig-11]. The ratio between area of dural sac and vertebral body was also calculated. It was found to be a constant at 0.2 at all levels [Table/Fig-12].
Comparision of the canal body ratio CBR among males and females (n=154)
| ertebral Level | Gender | Mean | Standard Deviation | T |
|---|
| L1 | M | 0.69 | 0.12 | 1.16 |
| F | 0.68 | 0.12 |
| L2 | M | 0.65 | 0.11 | 2.16 |
| F | 0.60 | 0.09 |
| L3 | M | 0.63 | 0.37 | 0.93 |
| F | 0.59 | 0.10 |
| L4 | M | 0.55 | 0.14 | 1.02 |
| F | 0.54 | 0.11 |
| L5 | M | 0.52 | 0.08 | 0.41 |
| F | 0.51 | 0.08 |
Comparison of the Ratio of Area of Dural Sac & Vertebral Body (n=154)
| Vertebral Level | Gender | Mean | Standard Deviation | T |
|---|
| L1 | M | 0.24 | 0.043 | 3.72 |
| F | 0.26 | 0.051 |
| L2 | M | 0.23 | 0.045 | 3.79 |
| F | 0.26 | 0.048 |
| L3 | M | 0.22 | 0.042 | 1.20 |
| F | 0.23 | 0.047 |
| L4 | M | 0.22 | 0.055 | 1.28 |
| F | 0.24 | 0.065 |
| L5 | M | 0.25 | 0.068 | 1.14 |
| F | 0.24 | 0.086 |
Discussion
Hamanishi calculated the dural sac cross sectional area at different inter-vertebral levels between L2/L3, L3/L4 and L4/L5 levels. He stated that an area <100mm2 can be considered as stenotic [11]. In a study conducted by Ahmed et al., the vertebral body and dural sac diameters and cross sectional area was measured. Out of 43 (73%) symptomatic cases, 34 (79%) cases were found to have narrow diameters of the spinal canal. Among the symptomatic there were 6 cases with stenosis at L1 level, 5 cases at L2, 14 at L3, 18 at L4 and 29 at L5 [8]. These findings were similar to our study, where maximum occurrence of stenosis was found at L5 followed by L4 vertebral level.
In various studies conducted by Bolender [12], Lee [13] and Haig [14] wherein the spinal canal diameter was measured. They established cut off values in order to diagnose stenosis, <13mm, <10mm and <11.95mm respectively. In our study the mean canal diameter was found to be 15.66mm. This would suggest that a diameter of <15.66mm could be used as a cut off to diagnose canal stenosis.
A study conducted by Rapala [15], on examination the mean sagittal dimension at L3 was 13.26 mm and the mean transverse dimension was 23.36 mm, with a surface area of 244.39 mm2. At L4, the mean sagittal dimension was 14.12 mm, the mean transverse dimension was 24.60 mm, and the surface area was 267.70 mm2. At L5, the mean sagittal dimension was 14.76 mm, the mean transverse dimension was 31.38 mm, and the surface area was 303.99 mm2.
It was found that a canal body ratio less than 0.6 from L1 to L3 levels and less than 0.5 at L4 and L5 levels. The ratio between area of dural sac and vertebral body was found to be a constant at 0.2 at all levels. Keeping these two constants as a predictor of lumbar central canal stenosis the percentage of males and females that were found to have stenotic central canals were calculated. It was found that maximum central canal stenosis occurred at the L5 lumbar vertebral level with 15.6% males and 13% females. This was followed by stenosis at the L4 and L3 lumbar vertebral levels with 5.1% males having stenosis at both levels and 3.9% and 5.1% females in L4 and L3 lumbar levels respectively. There are two diameters that can influence the dural sac cross sectional area, the interpedicular distance and the anteroposterior diameter. The interpedicular distance increases cranio-caudally from the first to the fifth lumbar vertebral level whereas the anteroposterior diameter shows a cranio-caudal decrease in its dimension. The dural sac tapers as it ends hence the overall area of the dural sac would decrease. This suggests that the dural sac cross sectional area by itself would not be a significant marker in predicting the occurrence of lumbar canal stenosis. In our study a novel approach of predicting lumbar central canal stenosis was established by using, the ratio between the dural sac and vertebral body cross sectional area as an addition to the canal body ratio in order to predict the occurrence of lumbar canal stenosis.
Conclusion
In conclusion the ratio between the area of the dural sac and the area of the vertebral body being a constant at 0.2 can be used as a diagnostic marker to predict the occurrence of lumbar canal stenosis. This value is an additional to the canal body ratio which can also be used by radiologists in evaluating possible symptomatic or asymptomatic cases of lumbar canal stenosis.