A Qualitative and Quantitative Analysis of AgNORs in Keratocystic Odontogenic Tumor, Unicystic Ameloblastoma and Multicystic Ameloblastoma
Anuradha Ananthaneni1, Urmila Udayashankar2, Vijay Srinivasvas Guduru3, V V S Ramprasad4, Sabitha Devi Ramisetty5, Srilekha Namala6, Kiran Kumar Naik Badavath7
1Professor, Department of Oral and Maxillofacial Pathology, St Joseph Dental College, Duggirala, Eluru, Andhra Pradesh, India.
2Postgraduate Student, Department of Oral and Maxillofacial Pathology, St Joseph Dental College, Duggirala, Eluru, Andhra Pradesh, India.
3Professor and Head, Department of Oral and Maxillofacial Pathology, St Joseph Dental College, Duggirala, Eluru, Andhra Pradesh, India.
4Reader, Department of Oral and Maxillofacial Pathology, St Joseph Dental College, Duggirala, Eluru, Andhra Pradesh, India.
5Reader, Department of Oral and Maxillofacial Pathology, St Joseph Dental College, Duggirala, Eluru, Andhra Pradesh, India.
6Postgraduate Student, Department of Oral and Maxillofacial Pathology, St Joseph Dental College, Duggirala, Eluru, Andhra Pradesh, India.
7Postgraduate Student, Department of Oral and Maxillofacial Pathology, St Joseph Dental College, Duggirala, Eluru, Andhra Pradesh, India.
NAME, ADDRESS, E-MAIL ID OF THE CORRESPONDING AUTHOR: Dr. Anuradha Ananthaneni, St Joseph Dental College, Duggirala, Eluru, Andhra Pradesh-534004, India.
E-mail: anuradhaundavalli@yahoo.com
Aims: A comparative evaluation of proliferation activity in unicystic ameloblastoma (UA), multicystic ameloblastoma (MA) and keratocystic odontogenic tumor (KCOT) using silver staining technique.
Settings and Design: In the present study 21 histopathologically confirmed paraffin blocks,7 each of UA, MA and KCOT were selected and stained with silver nitrate.
Materials and Methods: For quantitative analysis, 100 cells were counted at 1000x magnification for AgNORs and the mean value was calculated. Qualitative analysis of AgNORs included normal (oval shaped) and abnormal groups (bean shaped) in the lesion.
Statistical Analysis: The statistical analysis of data was done by a specialist statistician using two way ANOVA and multiple comparisons with Tukey’s test in advanced excel.
Results: The AgNOR count was more in KCOT when compared to MA and UA with the pattern of distribution of AgNORs more in basal than in the parabasal layer in KCOT. The qualitative analysis showed small to large oval AgNOR’s in KCOT and few clusters in MA whereas in UA irregular clusters were seen.
Conclusion: This concludes the expediency of AgNOR staining in reflecting the high proliferation rate and a more aggressive behavior of KCOT in comparison to MA and UA which signifies requirement of a more hostile surgical approach in KCOT to avoid recurrences following different treatment modalities.
Introduction
Nucleolar organizer regions (NORs) are loops of DNA that neither transcribe genes for ribosomal RNA which are argyrophilic (AgNORs) and are nor associated acidic protein selectively stained by silver methods which vary in size and shape according to nucleolar transcription and are intimately related to cell cycle. The quantity of AgNOR proteins is directly proportional to the proliferative activity of the cell. KCOT is a clinicopathologically distinct form ofdevelopmental odontogenic cyst known for its aggressiveness, pathognomonic microscopic features, and high recurrence rate. Ameloblastoma as aptly described by Robinson is usually unicentric, non-functional, intermittent in growth, anatomically benign and clinically persistent. There are two clinicopathological variants of ameloblastoma i.e.unicystic ameloblastoma (UA) and multicystic ameloblastoma (MA). UA is less aggressive with increased prognosis and reduced recurrence rate in comparison to MA which is locally invasive and highly destructive as it tends to infiltrate cancellous bone. AgNOR count has proved to be vital in reflecting the aggressive behaviour of odontogenic lesions in some studies [1]. Based on the amount of AgNORs the relevance of cellular proliferation rate was obtained and we tried to correlate it with the aggressiveness of the lesion.
Materials and Methods
Paraffin blocks of seven cases of KCOT, UA, MA each along with their demographic data were collected for the study. four micron thickness tissue sections were cut, deparaffinised in xylene, and dehydrated in 70%, 90%, and 95% alcohol consecutively and stained as described by Ploton et al., [2]. After rinsing in distilled water, all slides were simultaneously placed in freshly prepared silver nitrate solution in a dark container for 50 minutes at room temperature. The silver nitrate solution was prepared by combining 1 part of solution A (2 g of gelatine in 100 ml of 1% formic acid) with 2 parts of solution B (50% solution of silver nitrate in distilled water). No counter stains were applied. After silver staining, the slides were rinsed with distilled water for 30 minutes. The sections were dehydrated, cleared and mounted using DPX mountant. For quantitative analysis, 100 cells were counted at 1000X magnification and mean value of AgNOR count was calculated for KCOT, UA and MA. And for qualitative analysis, size, shape and arrangement of NORs were assessed. Then statistical analysis was done by a specialist statistician using two way ANOVA and multiple comparisons with Tukey’s test in advanced excel. The statistical significance was set at p= 0.05.
Results
The quantitative analysis of AgNORs in the present study was 1.99±0.29, 1.97±0.41, 1.45±0.42 in KCOT, MA and UA respectively [Table/Fig-1]. The qualitative analysis showed small to large oval AgNOR dots in KCOT and few clusters were seen in MA and irregular clusters in UA.
Discussion
The quantitative and qualitative findings with respect to NORs indicate their degree of cell nucleolar activity. Actively proliferating cells have an impaired nucleolar activity and hence exhibit an increase in AgNOR count regardless of the ploidy state of the cell [3]. In earlier studies AgNOR staining was used to differentiate malignant tumours from benign and also to diagnose pre-malignant lesions and lymphomas [4]. Increase in AgNOR count closely relates to the malignant potential of a lesion than its proliferative activity which depends on the growth fraction and the amount of cells within the tumour population that are actively proliferating [5,6]. AgNOR count along with clinical and histological grading, in OSMF predicted its biological behaviour thus rendering a more reliable prognosis [7]. A high AgNOR count was observed in odontogenic cysts and ameloblastomas [8]. Piffko J et al., proved the prognostic significance of AgNOR count at the invasive front of oral cancer in predicting overall survival and metastatic potential [9]. Eslami et al., suggested the potential usefulness of AgNORs in differentiating UA and MA from dentigerous cysts and KCOTs [10]. Luminal proliferations of mural UA exhibit lower proliferation activity than the mural proliferation areas in MA [11]. AgNOR count may be useful as a proliferative marker to differentiate between inflamed and noninflamed OKCs as AgNOR counts were statistically more in the inflamed OKCs when compared to later indicating greater chance of recurrence in them [12]. Also studies have revealed increased AgNOR count in the odontogenic cysts in comparison to normal odontogenic epithelium indicated a proliferative change [13]. It is also a useful technique for differential diagnosis of bony lesions like fibrous dysplasia, osteosarcoma, and ossifying fibroma in jaws by considering a cut off point of 1.81-2.5 for well differentiated osteosarcoma and 1-1.8 for ossifying fibroma [14]. A high number of AgNOR dots in oral squamous cell carcinoma when compared to salivary gland tumours explains the possible higher proliferative activity in oral squamous cell carcinoma in comparison to salivary gland tumor [3].
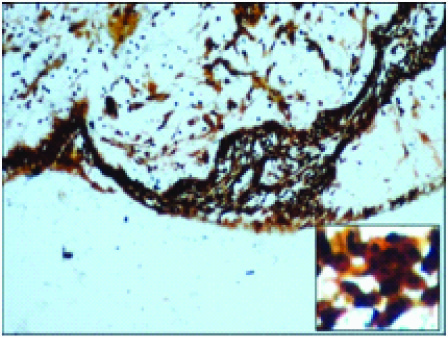
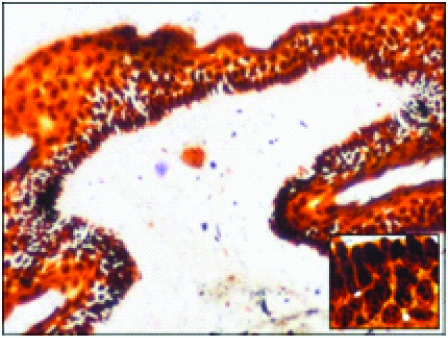
In the present study, KCOT showed a more mean AgNOR count when compared to MA and UA (1.99±0.29, 1.97±0.41, 1.45±0.42 respectively) and the AgNOR count was relatively more in basal layer than parabasal layer (2.19±0.20, 1.08±0.23) which was in consistent with Coleman et al., [8] and Eslami et al., [10]. The reason for this could be the fact that basal cells are actively proliferating with increased transcriptional activity resulting in higher AgNORs. The mean number of AgNOR counts in [Table/Fig-2] was slightly less in MA than KCOT although it was statistically insignificant (p=0.9876) but when compared with UA,it was significantly less (p=0.0021*) after which was consistent with Eslami et al., [10] Comparing UA and KCOT, the mean number of AgNOR counts in KCOT was significantly higher (p=0.0014*) [Table/Fig-2] which was in consistent with Santos et al., [11] UA exhibits lower proliferation activity than MA and KCOT since the amount of AgNOR proteins is strictly directly proportional to the proliferative status of the cells which also substantiates the differences in the biological behaviour of these ameloblastoma variants. Large oval and bean shaped AgNOR dots which can be due to change in time and temperature of incubation leading to aggregation of fine AgNOR dots into larger particles. Some clusters along with large oval nucleolus were seen in MA and UA which could be due to increased recruitment of active ribosomal genes in each NOR cluster [Table/Fig-3,4,5] . Thus the qualitative and quantitative assessment of AgNOR’s reflect the high proliferation rate and a more aggressive behavior of KCOT in comparison to MA and UA which signifies the requirement of a more hostile surgical approach in KCOT to avoid recurrences following different treatment modalities.
Showing mean number of AgNORs of KCOT, MA and UA
| Lesion | No of cases | Mean no of AgNORs |
| KCOT | 7 | 1.99±0.29 |
| MA | 7 | 1.97±0.41 |
| UA | 7 | 1.45±0.42 |
Showing comparison of mean Values in between KCOT, MA, UA and their p-values
| KCOT | MA | UA |
| KCOT | _ | p=0.9876 | p=0.0014* |
| MA | p=0.9876 | _ | p=0.0021* |
| UA | p=0.0014* | p=0.0021* | _ |
Multicystic ameloblastoma

Keratocystic Odontogenic Tumor.
Conclusion
Hence the current study confirms the pragmatism of AgNOR staining in reflecting the high proliferation rate and a more aggressive behavior of KCOT in comparison to MA and UA also signifying AgNOR’s role as a diagnostic proliferative marker.
[1]. S Seifi, E Shafigh, A Allaie, Quantitative and qualitative analysis of argyrophillicnucleolar organizer regions in follicular cyst, keratocystic Odontogenic tumor and ameloblastoma.J Can Res and Therapeutics. 2011 7:280-85. [Google Scholar]
[2]. D Ploton, M Menager, P Jeannesson, G Himber, F Pigeon, JJ Adnet, Improvement in the staining and in the visualization of the argyrophilic proteins of the nucleolar organizer region at the optical level.Histochem J. 1986 18(1):5-14. [Google Scholar]
[3]. B Eslmai, H Rahimi, F Rahimi, MK Monir, A Ebadifar, Diagnostic value of silver nitrate staining for nucleolar organizer regions in selected head and neck tumors.J Cancer Res Ther. 2006 2:129-31. [Google Scholar]
[4]. J Crocker, N Skilbeck, Nucleolarorganiser region associated proteins in cutaneous melanotic lesions: a quantitative study.J Clin Pathol. 1987 40:885-89. [Google Scholar]
[5]. S Chungpanich, CJ Smith, Nucleolar Organiser regions (NORs) in hyperplastic lesions and squamous cell carcinomas of oral mucosa.J Dent Res. 1989 68:579 [Google Scholar]
[6]. I Serre, A Vielleond, D Schovaert, J Quillard, G Benoit, E Martin, Quantification of nucleolar organiser regions (NORs) in renal carcinoma. Comparison with the nuclear grade.ProgUrol. 1992 2:196-206. [Google Scholar]
[7]. R Rajendran, SM Nair, Silver binding nucleolar organizer region proteins as a possible prognostic indicator in oral submucous fibrosis.Oral surg Oral Med Oral Pathol 1992 74:481-86. [Google Scholar]
[8]. HG Coleman, G Altini, HT Groeneveld, Nucleolar Organiser region in Odontogenic cyst and Ameloblastoma. J Oral Pathol Med 1996 25:436-40. [Google Scholar]
[9]. J Piffko, A Bankfalvi, Standardized AgNOR analysis of the invasive tumor front in oral squamous cell carcinomas.J of Pathol 1997 1:182:450-56. [Google Scholar]
[10]. B Eslami, M Yaghmaei, M Firoozi, AS Saffar, Nucleolar Organizer regions in selected Odontogenic lesions.Oral Surg Oral Med Oral Pathol Oral Radiol Endod. 2003 95:187-92. [Google Scholar]
[11]. AC Santos, SB Chaves Tarquinio, E Riet Correa Rivero, L Maria Aver Araujo, C Lorio Krause, Quantitative AgNORs study in Ameloblastoma.Rev OdontoCien C. 2009 24:10-14. [Google Scholar]
[12]. S Vindhya, S Sudha, PM Shameena, IP Vargese, A clinicopathological study in Odontogenic keratocyst and the role of AgNORs in cell proliferation.Oral Maxillofacial Pathol. 2010 1:42-47. [Google Scholar]
[13]. DP Vishnu, M Vidhya, JR Gopal, P Rachna, Quantitative and Qualitative nucleolar organizer regions in normal Odontogenic epithelium and Odontogenic cysts- a comparative study. J oral health Research 2010 1:141-45. [Google Scholar]
[14]. M Eslami, F Baghaee, M Alaeddini, Diagnostic value of silver –stained nucleolar organizer regions in osteosarcoma, fibrous dysplasia and ossifying fibroma of the jaws.Acta MedicaIranica 2005 43:243-48. [Google Scholar]