Precise evaluation of the developmental stage of a child is not only an integral part of both diagnosis and treatment of paediatric patients; it is also essential in Forensic Medicine and Dentistry [1]. Considerable variations in the development among children of the same chronological age have led to the concept of physiologic age. Physiologic age can be estimated by somatic, sexual, skeletal and dental maturity [2].
The present study was undertaken to investigate the relationship between the dental age (DA) and skeletal age (SA) of children and comparing it with the chronological age (CA).
Materials and Methods
One hundred and fifty healthy subjects within the age range of 5-15 y were selected and divided according to their ages into 3 groups (Group I - 5-8y, Group II - 9-11y and Group III - 12-15y) with 25 males and 25 females in each group. Children undergoing orthodontic treatment or extraction, with any history of trauma or injury to hand and wrist region were excluded from the study. The study design, objectives, potential benefits and methodology was priorly explained to the selected children and their parents and brief history of the study subjects was recorded including the date of birth (birth certificate). Consent and ethical committee clearance were obtained from Institutional Ethical Committee prior to the study. An orthopantomogram and a hand-wrist radiograph of left hand in postero-anterior view were taken for each subject on same day. The estimated CA of each subject was determined by deducting the date of birth as recorded from the birth certificate from the date of taking hand and wrist radiograph.
Assessment of dental maturity by Schour and Massler’s method (S&M): Schour and Massler (1941) [Table/Fig-1] have described about 22 chronological stages of dental development in a chart. The stage which appeared to resemble the radiograph most closely was selected.
Development of human dentition as presented by Schour and Massler (1941)

Assessment of dental maturity by Demirjian and Golstein’s method (D&G): The orthopantomograms were rated according to the criteria given by Demirjian and Goldstein (1973) for assessing seven teeth on the left side of the mandible. All teeth were rated on a scale of A to H. The rating was assigned by following the criteria for each stage [Table/Fig-2].
Graphical presentation of the developmental stages as presented by Demirjian et al., (1973)

Assessment of skeletal maturity by Greulich and Pyle method (G&P): The SA from the hand and wrist radiographs were assessed according to the criteria given in the Radiographic Atlas by Greulich and Pyle (1959). The radiographs were compared with the images in the atlas and once it was sure that the matching radiograph had been found, the SA printed at the top of the page was referred to obtain the SA.
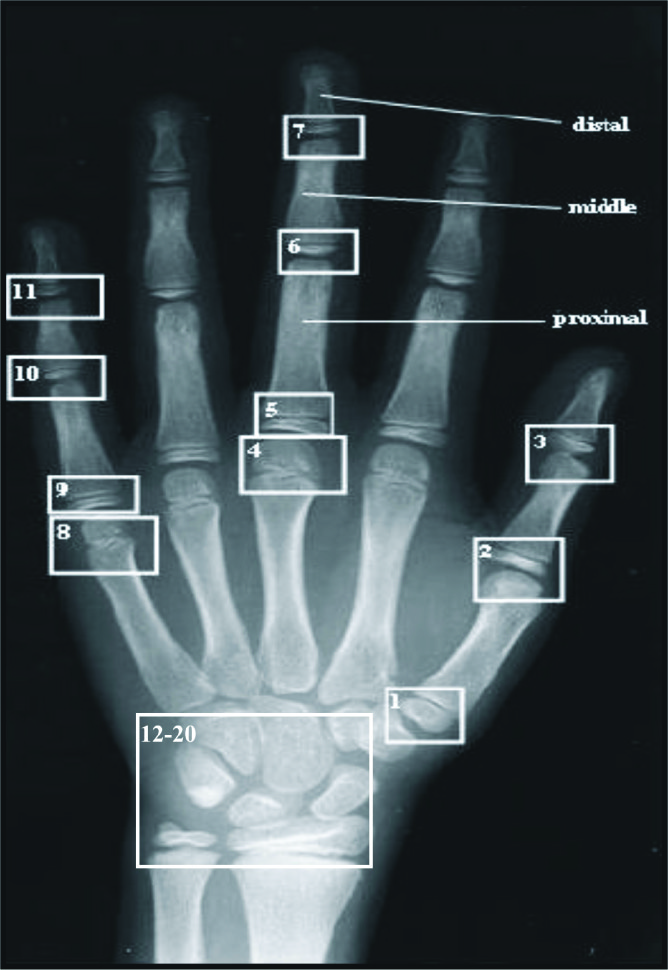
Assessment of skeletal maturity by Tanner and Whitehouse method (T&W): The hand and wrist radiographs were rated according to the criteria given by Tanner and Whitehouse (TW2) method published in 1975. In TW 2 method twenty regions of interest (ROIs) [Table/Fig-3] located in the main bones were considered for the bone age evaluation and rated on a scale of A to I according to the scoring criteria’s as given by Tanner and Whitehouse (1975).
Various Region of Interests (ROI’s) in hand and wrist region
Finally the data collected was statistically analysed using the SPSS version 15.0 Statistical Analysis Software. For all tests p-value of <0.05 were considered for statistical significance.
Results
A. Comparision between different methods of dental and skeletal maturity with CA in males [Table/Fig-4]
Significance of difference between chronologic age and different methods of age estimation (Males)
| Methods | Difference from chronologic age | Significance of difference (paired “t”-test) |
|---|
| Mean | SD | “t” | “p” |
|---|
| Group I |
| Dental Age (S&M) | 0.05 | 0.68 | -0.351 | 0.729 |
| Dental Age (D&G) | 0.54 | 0.51 | -5.274 | <0.001 |
| Skeletal Age (T&W) | 0.18 | 0.57 | -1.571 | 0.129 |
| Skeletal Age (G&P) | -0.90 | 0.93 | 4.875 | <0.001 |
| Group II |
| Dental Age (S&M) | 0.63 | 0.62 | 5.031 | <0.001 |
| Dental Age (D&G) | 0.45 | 1.25 | 1.806 | 0.083 |
| Skeletal Age (T&W) | 0.14 | 0.54 | 1.258 | 0.221 |
| Skeletal Age (G&P) | 0.27 | 1.03 | 1.300 | 0.206 |
| Group III |
| Dental Age (S&M) | -0.44 | 1.80 | -1.225 | 0.233 |
| Dental Age (D&G) | -0.78 | 1.20 | -3.257 | 0.003 |
| Skeletal Age (T&W) | 0.71 | 1.14 | 3.115 | 0.005 |
| Skeletal Age (G&P) | 0.42 | 0.81 | 2.585 | 0.016 |
In Group I all the methods except SA estimated by G&P method had higher mean values as compared to CA. Statistically, CA showed a significant difference from DA estimated by D&G method and SA estimated by G&P method. In Group II all the methods had higher mean values as compared to CA. While statistically, CA showed statistically significant difference only from DA estimated by S&M method. In Group III both the DA assessment methods had lower mean values compared to CA, while both the SA assessment methods had higher values. Statistically, Chronologic Age showed a significant difference from all the methods except DA estimated by S&M method.
B. Comparing the difference between different dental and skeletal method in males [Table/Fig-5]
Significance of difference between dental age and skeletal age (Males)
| Methods | Difference between dental age and skeletal age | Significance of difference (paired “t”-test) |
|---|
| Mean | SD | “t” | “p” |
|---|
| Group I |
| Dental Age (S&M) vs Skeletal Age (T&W) | -0.13 | 0.74 | -0.893 | 0.381 |
| Dental Age (S&M) vs Skeletal age (G&P) | 0.95 | 1.06 | 4.496 | <0.001 |
| Dental Age (D&G) vs Skeletal Age (T&W) | 0.36 | 0.69 | 2.596 | 0.016 |
| Dental Age (D&G) vs Skeletal age (G&P) | 1.44 | 1.07 | 6.707 | <0.001 |
| Group II |
| Dental Age (S&M) vs Skeletal Age (T&W) | -0.49 | 0.70 | -3.515 | 0.002 |
| Dental Age (S&M) vs Skeletal age (G&P) | -0.36 | 1.31 | -1.373 | 0.183 |
| Dental Age (D&G) vs Skeletal Age (T&W) | -0.32 | 1.20 | -1.318 | 0.200 |
| Dental Age (D&G) vs Skeletal age (G&P) | -0.18 | 1.65 | -0.558 | 0.582 |
| Group III |
| Dental Age (S&M) vs Skeletal Age (T&W) | 1.15 | 1.70 | 3.390 | 0.002 |
| Dental Age (S&M) vs Skeletal age (G&P) | 0.86 | 1.62 | 2.649 | 0.014 |
| Dental Age (D&G) vs Skeletal Age (T&W) | 1.49 | 1.38 | 5.415 | <0.001 |
| Dental Age (D&G) vs Skeletal age (G&P) | 1.20 | 1.24 | 4.855 | <0.001 |
In Group I all the DA estimations were higher as compared to SA and the difference was significant statistically too for all the comparisons except that between DA estimated by S&M method and SA estimated by T&W method. In Group II both the DA estimation methods had lower mean values as compared to SA assessment methods, however, the difference was significant statistically only between DA estimated by S&M method and SA estimated by T&W method. In Group III both the DA estimation methods had higher mean values as compared to both the SA assessment methods and the difference was statistically significant for all the comparisons.
C. Correlation between different methods in males [Table/Fig-6]
Correlation matrix showing bivariate correlation (Pearson) between different methods (Males)
All the correlations were strong and positive in all the groups.
D. Comparision between different methods of dental and skeletal maturity with chronological age in females [Table/Fig-7]
Significance of difference between chronologic age and different methods of age estimation (Females)
| Methods | Difference from chronologic age | Significance of difference (paired “t”-test) |
|---|
| Mean | SD | “t” | “p” |
|---|
| Group I |
| Dental Age (S&M) | -0.78 | 0.76 | 5.131 | <0.001 |
| Dental Age (D&G) | 0.00 | 0.48 | 0.041 | 0.967 |
| Skeletal Age (T&W) | -0.02 | 0.58 | 0.173 | 0.864 |
| Skeletal Age (G&P) | -0.72 | 0.77 | 4.702 | <0.001 |
| Group II |
| Dental Age (S&M) | -0.15 | 1.09 | 0.699 | 0.491 |
| Dental Age (D&G) | -0.40 | 0.86 | 2.324 | 0.029 |
| Skeletal Age (T&W) | -0.85 | 0.66 | 6.391 | <0.001 |
| Skeletal Age (G&P) | -0.27 | 0.62 | 2.210 | 0.037 |
| Group III |
| Dental Age (S&M) | -0.17 | 1.18 | 0.714 | 0.482 |
| Dental Age (D&G) | 0.78 | 0.73 | -5.356 | <0.001 |
| Skeletal Age (T&W) | -0.94 | 1.00 | 4.736 | <0.001 |
| Skeletal Age (G&P) | -0.01 | 1.02 | 0.039 | 0.969 |
In Group I all the age estimation methods except DA estimated by D&G method had lower mean values as compared to CA. Statistically, Chronologic Age showed a significant difference when compared to DA estimated by S&M method and SA estimated by G&P method. In Group II all the age estimation methods showed lower mean values as compared to CA and it showed a significant difference from all the methods of age estimation except DA estimated by S&M method. In Group III all the age estimation methods except DA estimated by D&G method had lower mean values as compared to CA. Statistically, CA showed a significant difference from DA estimated by D&G method and SA estimated by G&P method.
E Comparing the difference between different dental and skeletal method in females [Table/Fig-8]
Significance of difference between Dental Age and Skeletal Age (Females)
| Methods | Difference between dental age and skeletal age | Significance of difference (paired “t”-test) |
|---|
| Mean | SD | “t” | “p” |
|---|
| Group I |
| Dental Age (S&M) vs Skeletal Age (T&W) | -0.76 | 0.85 | -4.462 | <0.001 |
| Dental Age (S&M) vs Skeletal age (G&P) | -0.05 | 1.22 | -0.213 | 0.833 |
| Dental Age (D&G) vs Skeletal Age (T&W) | 0.02 | 0.90 | 0.089 | 0.930 |
| Dental Age (D&G) vs Skeletal age (G&P) | 0.72 | 1.02 | 3.530 | 0.002 |
| Group II |
| Dental Age (S&M) vs Skeletal Age (T&W) | 0.70 | 1.10 | 3.170 | 0.004 |
| Dental Age (S&M) vs Skeletal age (G&P) | 0.12 | 0.79 | 0.758 | 0.456 |
| Dental Age (D&G) vs Skeletal Age (T&W) | 0.45 | 1.10 | 2.031 | 0.054 |
| Dental Age (D&G) vs Skeletal age (G&P) | -0.13 | 1.23 | -0.522 | 0.607 |
| Group III |
| Dental Age (S&M) vs Skeletal Age (T&W) | 0.78 | 1.35 | 2.877 | 0.008 |
| Dental Age (S&M) vs Skeletal age (G&P) | -0.16 | 1.30 | -0.617 | 0.543 |
| Dental Age (D&G) vs Skeletal Age (T&W) | 1.73 | 1.08 | 7.978 | <0.001 |
| Dental Age (D&G) vs Skeletal age (G&P) | 0.79 | 1.06 | 3.724 | 0.001 |
In Group I DA estimated by S&M method had lower mean values in comparison to SA estimation whereas DA estimated by D&G method had higher mean values. However, the difference was statistically significant only between DA estimated by S&M method and SA estimated by T&W method and DA estimated by D&G method as compared to SA estimated by G&P method. In Group II except for DA estimated by D&G method which was lower than SA estimated by G&P method, both the DA estimation methods were higher as compared to SA assessment methods. However, the difference was significant statistically only for DA estimated by S&M method and SA estimated by T&W method. In Group III except for DA estimated by S&M method and SA estimated by G&P method where SA was higher as compared to DA, for all the other comparisons SA was lower as compared to DA estimation. On comparing the data statistically, the difference was found to be significant statistically for all the comparisons except between DA estimated by D&G method and SA estimated by G&P method.
F. Correlation between different methods in females [Table/Fig-9]
Correlation matrix showing bivariate correlation (Pearson) between different methods (Females)
All the correlations were strong and positive in all the groups.
Discussion
The aim of an ideal age estimation technique is to arrive at an age as close to the CA as possible. Therefore the estimation of an individual’s age in children and adolescents consists of the study of osseous and dental characteristics to have a close approximation of a human beings CA. The analysis of these processes is based on the determination and quantification of the events occurring during the growth and development processes, given that they generally present a constant sequence [3].
The degree of skeletal development is a reflection of the degree of physiologic maturation of a subject. Bone age has been shown to be as important as CA in evaluating an adolescent’s physical development. In addition, SA indicates how much further growth a child will attain [4]. According to Koshy & Tandon the hand and wrist radiograph is commonly used for skeletal developmental assessment, especially because it includes many ossification centers in small areas [5].
The main clinical methods for skeletal bone age evaluation are the G&P method and the T&W method. The G&P method is most widely used mainly because the GP method is faster and easier to use than the T&W method. According to Bull et al., T&W method is the more reproducible of the two, and also potentially more accurate [6].
Another important diagnostic tool used in determining the growth and maturity is tooth development. Dental maturity can be determined by the stage of tooth eruption or by the stage of tooth formation [6]. This system has gained acceptance because it is less variable when compared to other skeletal and sexual maturity indicators Lewis & Garn, [7].
The present study was under taken to test the applicability of the two dental (S&M and D&G) methods and two skeletal (G&P and T&W) methods and to find out the interrelationship amongst dental, skeletal and CAs in children of age group 5 - 15 y.
Dental age estimation
In Group I D&G method overestimated the age in males and females and was significant in case of males when D&G method was used, whereas S&M method underestimated the age in case of males and overestimated the age in case of females.
Koshy & Tandon and Prabhakar et al., reported an overestimation in males and females in South Indian children and Davangere children respectively [5,8]. A possible explanation for the difference in the estimated DA could be attributed to the difference in ethnicity and/or considerable time gap between two studies on the dental development of these children. Other possible causes of difference are the environmental factors, such as the socioeconomic status, nutrition and dietary habits that vary in different population groups. Prabhakar et al., stated that malnutrition can have adverse effect on the dental and skeletal maturation [8].
DiGangi & Moore assessed S&M charts on a modern clinical sample of living adults. The results according to the study showed that chart performs equally well, but that some of the stages, particularly those around the ages 7-9, were significantly different for males and females. It was also found that wider error intervals (age ranges) were needed for stages encompassing ages 6-14 y [9].
In Group II D&G and S&M method of age estimation underestimated the male and female age significantly. This was in accordance to study conducted by Rizig et al., and Bagic et al., they attributed this difference to numerous factors, such as the accuracy of method execution, the examiners subjectivity, sample structure (age, sex, ethnicity, nationality and social status). Moreover, there may be a difference in the present day comparisons due to positive secular trends [10,11].
In Group III D&G method overestimated the male and female age and the differences were statistically significant, whereas the calculated DA by S&M method overestimated males and underestimated females and the differences were statistically insignificant. The finding that overestimation was more pronounced in the older children was also made by Nykanen et al., [12]. A possible reason for the difference in estimated age by S&M method from CA could be that it used anatomical representations of teeth that mask internal tooth structures and with no information regarding eruption reference [13].
Skeletal age estimation
The underestimation of CA by the G&P method in the present study in Group I could be interpreted as a delay in skeletal maturation in our subjects compared with G&P reference population. The results of this present study is consistent with those of previous studies by Groell et al., Schmidt et al., and Buken et al., [14–16]. In our study SA was delayed and differences were significant for both sexes except for in case of boys who were slightly advanced but the difference was not significant. Molinari et al., using the TW3 method, stated that, for boys up to about age 9, there was no differences between estimated SA and the TW3 standard; after that age, the boys SA became clearly delayed compared with the TW3 standard [17].
In Group II the difference between CA and SA was significant for females in both the cases and underestimated the age. This was in accordance with study conducted by Patil et al., who observed skeletal retardation in age group 4-15 y for males and between age group 4-7 and 9-10 y for females. These results show that Indian children mature slightly more slowly than the G&P standard [18].
In Group III the difference between CA and SA was statistically significant for both males and females when G&P method was used, whereas the difference was significant only in case of females when T&W method was used. Theoretically, differences between our results and the standards of G&P could in part be due to the effects of ethnic differences. Ontell et al., studied bone age in children of diverse ethnicity (599 radiographs of White, Black, Asian and Hispanic boys and girls) and concluded that using the standards of G&P to determine bone age must be done with reservations. Patil et al., reported that skeletal retardation was more in males as compared to females [18,19].
Differences in maturity between males and females
Present study showed early maturation in Indian females as compared to males, this is in accordance to the study conducted by Koshy & Tandon on South Indian population and Patil et al., on Indian population [5,18].
Correlations between different methods of age esti–mation
In the present study the co-relationships between DA, SA and chronologic age were positive. We found a similar result in other studies such as Vallejo-Bolanos & Espana-Lopez Hegde RJ & Sood PB and Prabhakar et al., [8,20,21].
Conclusion
For all the age groups the methods either overestimated or underestimated the age, DA estimation techniques were found comparable and equally reliable as the SA estimation methods.
Females had a higher SA assessment at all ages indicating early maturation in Indian females.
The strong correlations between dental and skeletal maturation that are demonstrated in this investigation suggest that radiographic determination of DA could be a useful tool, providing an additional source of information in the treatment planning of children.
However, further studies are needed in order to formulate new scoring measures for Indian children.