Dentine hypersensitivity (DH) is an intense pain felt when the dentine of the teeth is exposed to hot or cold foods or drinks. It has been shown that the aetiology of DH is multi factorial however sensitivity can be interaction between stimuli and several predisposing factors, including gingival recession or exposed tooth roots and wasting diseases. Some theories were proposed to explain the breaking out of such painful sensitivity, being the “Hydrodynamic Theory” the most accepted, which proposes that peripheral stimuli are transmitted to the pulp surface through fluid movement inside the dentin ducts, causing pain [1].
Tooth hypersensitivity, or more precisely dentine sensitivity or hypersensitivity, is described clinically as an exaggerated response to non-noxious stimuli. Furthermore, the condition has been defined by an international workshop on DH as “short, sharp pain arising from exposed dentine in response to stimuli, typically thermal, evaporative, tactile, osmotic or chemical and which cannot be ascribed to any other dental defect or pathology [2].” In general, conventional therapy for DH is based on using topical applied desensitizing agents which may provide only partial pain relief [3].
Several studies all around the world reported that among the odontalgias, DH is a painful condition highly prevalent in the adult population, with prevalence ranging from 4 – 74 % [4] and in India prevalence of hypersensitivity varies from place to place attributed to their local oral practices. Some studies in northern India stated that prevalence of hypersensitivity to be 40-50% [5]. As such there are no available data on prevalence of DH in rural areas of southern India, hence the aim of the present study was to determine the prevalence of DH and to examine some associated predisposing factors and initiating stimuli, among adult patients attending the Department of Oral Medicine and Radiology of a dental school which is situated 20 Kilometers away from a major south Indian city and is serving population from 2 towns and 25 villages around it including the major city.
While examining, the patients were examined using the standard methods for hypersensitivity such as air blasting and probing in a standard dental setting.
Materials and Methods
A cross-sectional study was carried out over a period of one month in two phases. In the first phase, out of the 665 study volunteers, 212 adult patients in the age group of 18-65 y of either sex meeting the inclusion and exclusion criteria were conveniently selected in to the study. All the study subjects were explained about the consequences of the stimuli exposure and informed consent from each patient was taken. Permission from the college ethical committee and Department of Oral Medicine and Radiology was taken prior to start of the study.
Inclusion criteria
Subjects age above 18 y.
Subjects who have at least 20 functional teeth.
Those providing the consent for participation.
Exclusion criteria
Current or previous use of professional desensitizing treatment.
Eating disorders.
Medically compromised patients.
Subjects with deep periodontal pockets and extensively Carious and/ or restored tooth.
All patients satisfying the inclusion criteria were examined for the hypersensitivity, by subjecting them to tests (air and water blast or probing). A detailed demographic data were collected along with a structured questionnaire which includes type of hypersensitivity response, sensitivity episodes, stimulus for initiation, Oral hygiene habits and type of diet. All the subjects were examined for the tooth surface loss, such as attrition, abrasion, erosion and gingival recession.
Patients were seated on the dental chair and teeth identified by the subject were tested with artificial illumination, mouth mirror, probe and three ways air syringe jet. Evidence of dentin hypersensitivity was confirmed by the use of air blast (Air at 3 sec, Air at 10 sec) and water (Water at 3 sec, Water at 10 sec) from the air-water jet of the dental chair and scratching the suspected tooth surfaces with a dental probe (Probe method) and noting the responses by using visual analog scale (VAS) scores. A VAS consists of a 100-mm line with 0 at one end indicating not painful at all and 100 at the other end indicating extremely painful. VAS ratings of 0 to 4 mm can be considered no pain; 5 to 44 mm, mild pain; 45 to 74 mm, moderate pain; and 75 to 100 mm, severe pain [6]. A participant was asked to draw a vertical line on the horizontal scale at a point that corresponded to his/her reaction to the stimulus.
In the second phase the factors which influence hypersensitivity were surveyed. As the factors which were taken into consideration were mostly wasting diseases and just the mere presence was noted using the type I examination. These factors were correlated with the prevalence of hypersensitivity. .
Statistical analysis was made using SPSS (Statistical Package for Social Sciences) version 18.0. A p-value (p) ≤0.05 was considered statistically significant.
Results
Study population consists of 212 patients, 94 males and 118 females, with a mean age of 42.7± 4.5 yrs. As the institute is situated 20 Kilometers away from a major south Indian city and is serving population from 2 towns and 25 villages around it including the major city.
Almost all the subjects are from rural area with minimal education and lower socio economic status. The overall prevalence of DH was found to be 32%. Subjects in the age group of 45-55 y had the highest prevalence of DH (p ≤0.05). Most of the study patients had sharp hyper sensitivity episodes (80.2 %) where as rest other subjects faced dull aching sensation [Table/Fig-1]. 82% of study subjects had occasional episodes and remaining 18% had often or very often hypersensitivity episodes [Table/Fig-1]. 47.8% of study subjects use abrasive tooth powder and hard tooth brush. 0ut of 212 Patients with DH 30% preferred to eat citrus fruits and 43% of patients preferred to eat hard food. The commonest teeth affected were posterior teeth on right side and the most common cause was found to consuming cold food or drinks (92%) and common predisposing factor was gingival recession (28%) [Table/Fig-2 & 3]. Dentin hypersensitivity was more frequently elicited on the occlusal surface in 58% of cases followed by cervical surface in 32% of cases.
Distribution of study subjects according to age groups, type of sensitivity, recurrence of episodes and gender
| Male | Female | Total | % |
|---|
| Age groups |
| 18-19y | 5 | 9 | 14 | 6.7 |
| 20-24y | 18 | 20 | 38 | 17.9 |
| 25-34y | 17 | 23 | 40 | 18.8 |
| 35-44y | 23 | 29 | 52 | 24.5 |
| 45-54y | 21 | 22 | 43 | 20.4 |
| 55-65y | 10 | 15 | 25 | 11.7 |
| Total | 94 | 118 | 212 | 100 |
| Type of sensitivity |
| Sharp | 65 | 105 | 170 | 80.2 |
| Dull | 29 | 13 | 42 | 19.8 |
| Total | 94 | 118 | 212 | 100 |
| Recurrence of episodes |
| Occasional | 76 | 97 | 173 | 82 |
| Often | 18 | 21 | 39 | 18 |
| Total | 94 | 118 | 212 | 100 |
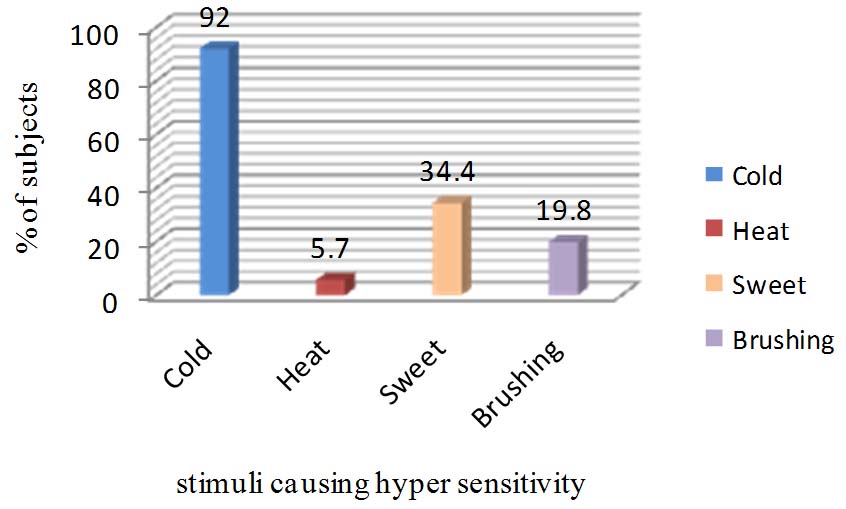
Percentage of subjects having dentine hypersensitivity by type of stimuli
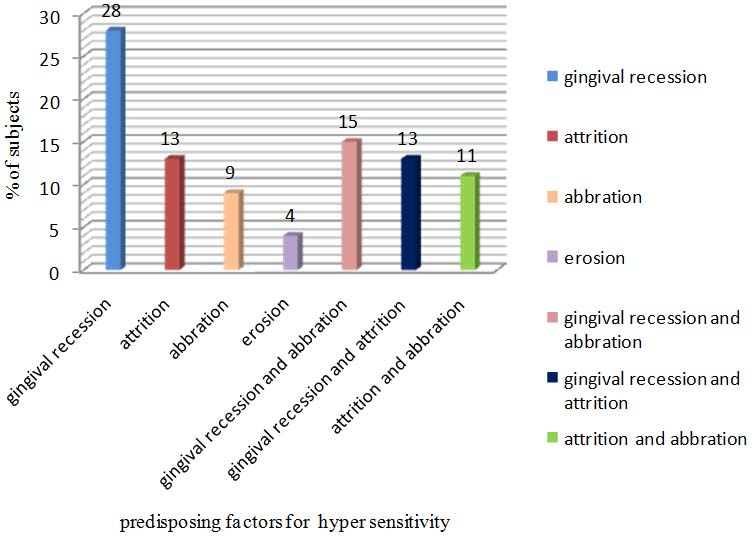
percentage of subjects having dentine hypersensitivity in relation to predisposing factors
Analysis of Vas Scores
VAS scores were analysed using Kruskal-Wallis test with the five different methods, there is a significant difference between all the five methods when compared to each other with p-value <0.005 [Table/Fig-4]. Probe method yields a higher VAS score followed by Air at 10 sec and Water at 10 sec.
VAS scores of five different methods using Kruskal-Wallis test.
| Method | Mean | SD | P-value |
|---|
| Water - 3 sec | 2.99 | 1.00 | 0.05 * |
| Water - 10 sec | 5.05 | 1.00 | 0.05 * |
| Air - 3 sec | 2.60 | 0.92 | 0.07 |
| Air - 10 sec | 6.16 | 1.33 | 0.04 * |
| Probe | 7.12 | 1.18 | 0.005 ** |
** Highly significant, * Significant
Discussion
The overall prevalence of dentine hypersensitivity reported in this study was 32% which is almost near to the study conducted by Tasanee Tengrungsun, Yupapan Jamornnium, Sawanee Tengrungsun [7] at Mahidol University Bangkok and Mithra N Hegde, Neha Bhalla [8]. The reason might be both the studies are institutional studies where as the prevalence somewhat different from other studies was conducted in dental practice which is 2-15% [9]. C Fischer, RG Fischer, A Wennberg [10], in Brazil reported prevalence 17% in subjects attending 5 private dental practices in Rio De Janerio, Brazil. The present study was differing from other study conducted in rural setting by Jagjit Singh Dhaliwal, Pooja Palwankar, Paramjit K Khinda, Sachinjeet K Sodhi [5] which is more compared to present study the reasons that may have contributed were procedural differences in diagnosing DH, such as the use of questionnaires, mouth rinsing with cold water and intraoral testing with thermal or electrical.
In India 80% of the population are from rural areas that have a very little access to education. This factor in turn affects the oral hygiene practices such as usage of primitive methods of tooth brushing such using a neem stick as an aid which is very much a stronger abrasive than the tooth paste and thus can cause abrasion defects which may predispose sensitivity.
In the present study the confirmation of dentine hypersensitivity was based on questionnaire followed by clinical examination in which probe and an air blast from dental three way air syringe was used as stimuli test. Al-Sabbagh M, Brown A, Thomas MV [11], reports no gender difference in aetiology and prevalence of DH which is similar to present study. It is well understood that the prevalence of DH varies with age, peaking in the 35-60 y age group. The study by Liu Hc, Lan WH, Hsieh CC [12] reported that more number of subjects is from 50-59 y of age which is differing from present study. Nature of sensitivity describe by most of the patients was sharp pain and of short duration (80.2%), which is similar to the study described by Orchardson R, Collins WJ [13].
Majority of patients described cold drinks/ foods and cold air stimulus as the most potent initiating stimulus of dentine hypersensitivity. This is in accordance with Orchardson R, Collins WJ [13] and Rees JS, Addy M [14]. In the present study, cold foods and cold air (92%) represented as most common stimulus that was severely involved with dentine hypersensitivity followed by sweets (34.4%) and brushing (19.8%), which was similar to the findings of Jagjit Singh Dhaliwal, Pooja Palwankar, Paramjit K Khinda, Sachinjeet K Sodhi [5]. Tooth predilection order was from premolars to molars followed by incisors and canines; this result is consistent with the study of Amarasena N, Spencer J, Ou Y, Brennan D [15]. However, results differ in some studies by Taani DQ, Awartani F [16] and Udoye CI [17], where canines are more frequently involved, followed by incisors and molars. In this study DH was more elicited on occlusal surface which is differing from study by Flynn J, Galloway R, Orchardson R [18] which reported distribution of DH on buccal cervical areas of permanent teeth.
The relationship between plaque and hypersensitivity is a controversial issue. While some clinicians believe that the amount plaque has an outright effect on the hypersensitivity [19], while some clinicians claim that even though patients who have minimal plaque deposits but a generalized gingival recession complain of hypersensitivity [1].
As the study was conducted under rural setting majority of study subjects had adverse oral hygiene habits and food habits which are the reason for gingival recession, 28% of sensitive tooth had gingival recession, one of the major predisposing factors for DH. Regular dental check up along with proper oral hygiene instructions and correct brushing technique could play a significant role in reducing DH [Table/Fig-5].
Various studies conducted in various parts of the India showing the prevalence of hypersensitivity
| S.No | Author | Place | Year | Result |
|---|
| 1. | Mithra N Hegde [8] | Southern India | 2007 | The overall prevalence of dentin hypersensitivity was 26%. |
| 2. | Gurpreet kaur [20] | Derabassi | 2011 | The prevalence of dentine hypersensitivity was 8.7%. |
| 3. | Jagjit Singh [5] Dhaliwal | Punjab. | 2012 | The prevalence of dentine hypersensitivity was 25%. |
| 4 | Prasad Rane [21] | Maharashtra | 2013 | The prevalence of dentine sensitivity was 42.5% |
| 5. | Sonal S [22] | Mangalore | 2014 | The prevalence of dentin hypersensitivity was 22.5 %. |
| 6. | G.M.Naidu | Andhra pradesh | 2014 | The prevalence of dentin hypersensitivity was 32% |
Conclusion
The study was very much successful in assessing the prevalence of hypersensitivity in the chosen demographic area and also clearly discussed the possible etiological role of various factors. [Table/Fig-5] shows the prevalence of hypersensitivity in various parts of India.
However, the study was performed in a limited group of population pertaining to a limited age distribution. It could have been useful if a larger sample of population was used. The author recommends more studies to be performed with a much larger sample and clear distinction of age distribution