Gingivitis and periodontitis are primarily bacterial infections caused by a diverse group of micro-organisms [1]. Acute phase inflammation have been suggested to associated with infectious diseases such as periodontal diseases [2]. Sialic acid (SA) is the generic term given to a family of acetylated derivatives of neuraminic acid [3]. SA is a 9 carbon monosaccharide. An important function of host SA is to regulate innate immunity. SA occupies the interface between the host and pathogenic microorganisms. Micro-organisms incorporate SA into their cell surface, which helps them evade the innate immune response of the host [4]. Removal of terminal SA (either by neuraminidase (sialidase) enzyme of virulent bacteria or by inherited disorder of host endogenous neuraminidase) from sialylated glycoprotein, could incorporate onto the surface of developing plaque which may play a role in plaque formation and cause destruction of host tissue [5]. SA is present in several acute phase proteins which are known to be associated with periodontitis [6]. There exists a need for a biomarker, for early detection of disease evolution and more robust therapy efficacy measurements [7]. Till date, there is very little data regarding simultaneous estimation and comparison of total SA content in saliva and serum of chronic periodontitis patients. The present study was therefore undertaken with an aim, to not only assess the levels of TSA in saliva and serum and also to find out their association if any, in periodontal health, chronic gingivitis and chronic periodontitis.
Materials and Methods
Study population- A total of 90 subjects visiting the out patient clinic of Department of Periodontics, VSPM Dental College & Research Centre, Nagpur, India, were recruited for this study. Written informed consent was obtained from those who agreed to participate voluntarily and ethical clearance was obtained from institution’s ethical committee (VSPMDCRC/28/2012 dated on 07/09/2012).
Inclusion criteria- All the subjects should be within the age group of 18 to 55 years, subject should have atleast 18 natural teeth excluding third molars.
Exclusion criteria- History of periodontal debridement or periodontal surgery in preceding six months or any antimicrobial therapy, anti-inflammatory drugs, corticosteroids, in previous three months, systemically compromised individuals, smokers, pregnant and lactating women. Medical history for absence of systemic disorders such as diabetes mellitus, cardiovascular diseases, pneumonia, tuberculosis, rheumatoid arthritis,which may trigger acute phase response,was recorded in detail.
Further clinical measurements such as probing depth (PD), clinical attachment loss (CAL), gingival index (Loe & Silness,1963), oral hygiene index-simplified(OHI-S) (John C Greene & Jack Vermillon ,1964) were recorded for all subjects. All clinical measurements were performed by a single examiner using a William’s graduated periodontal probe.Based on the clinical examination, the subjects were categorized into three different groups. Group I (healthy) consisted of 30 subjects with clinically healthy periodontium with no loss of clinical attachment. Group II (chronic gingivitis) consisted of 30 subjects who showed clinical signs of gingival inflammation (marked redness, oedema, ulceration, tendency of spontaneous bleeding without any CAL). Group III (chronic periodontitis) consisted of 30 subjects who had probing depth of ≥ 4 mm, CAL of ≥4mm in 5 or more teeth. Sample size of 30 subjects in each group was determined using Power analysis (α=5%, power (1-β)=90%).
Collection of samples- Saliva samples were collected from all participants between 9 and 11 AM. Spitting method was used for collection unstimulated whole saliva. Simultaneously, blood samples were collected from antecubital fossa by venipuncture. The samples were centrifuged immediately at 1000 g for 10 min, to separate the serum component. All the samples were stored at -20 ° C till analysis.
Biochemical analysis- SA content in saliva and serum was determined by a combined modification of the thiobarbituric acid method of Aminoff [8] and the method of Skoza and Mohos [9]. The samples(100µl ) were treated with 70µl of periodate reagent and incubated at 37°C for 30 min. The reaction was terminated through the addition of 70µl of sodium arsenite. 140µl of thiobarbituric acid (0.1M) was then added and this solution was heated in a boiling water bath for 7.5min then cooled in ice water upto room temperature. Dimethyl sulphoxide (560µl) was added and the solutions were measured on spectrophotometer at wavelength of 549 nm. Total SA content in saliva and serum was measured in mg/dl.
Statistical Analysis
Statistical analysis was performed using EPI info software, Analysis of variance (ANOVA ) test for comparing between the three groups and comparison of salivary and serum SA levels amongst the three groups by Boneferroni multiple comparison test. The values of clinical and biochemical parameters were expressed as mean ± standard deviation (SD) and p- values <0.0001 were considered statistically significant.
Results
Clinical and biochemical results – Out of total 90 subjects ,amongst the 30 healthy subjects the mean PD was 1.66 ± 0.36 mm, mean CAL was 0.0mm, mean GI was 0, mean OHI-S was 1.35± 0.42 , mean salivary TSA level was 39.05± 6.35 mg/dl and mean serum TSA level was 49.75± 4.87 mg/dl. Amongst the 30 chronic gingivitis subjects mean PD was 1.83±0.26mm , mean CAL was 0.0 mm, mean GI was 1.15 ± 0.26, mean OHI-S was 2.22± 0.41, mean salivary TSA level was 68.23 ±2.71 mg/dl and mean serum TSA level was 65.65± 3.56 mg/dl. Amongst the 30 chronic periodontitis subjects the mean PD was 3.58± 0.45mm and the mean CAL was 3.72± 0.52 mm, mean GI was 1.26± 0.31 , mean OHI-S was 2.37 ± 0.49 , mean salivary TSA level was 81.33± 3.94 mg/dl and mean TSA level was 75.98 ±3.58 mg/dl , as indicated in [Table/Fig-1].
Clinical periodontal variables and sialic acid levels in saliva and serum among three groups (mean ±SD), * statistically significant
| Parameters | Group 1 | Group 2 | Group 3 | p-value |
|---|
| Mean | S.D. | Mean | S.D. | Mean | S.D. |
|---|
| Age (years) | 27.37 | 9.69 | 27.73 | 7.51 | 31.23 | 6.74 | <0.0001* |
| Probing Depth (mm) | 1.66 | 0.36 | 1.83 | 0.26 | 3.58 | 0.45 | <0.0001* |
| Clinical Attachment loss (mm) | 0 | 0 | 0 | 0 | 3.72 | 0.52 | <0.0001* |
| Gingival Index | 0.0 | 0.0 | 1.15 | 0.26 | 1.26 | 0.31 | <0.0001* |
| OHIS Index | 1.35 | 0.42 | 2.22 | 0.41 | 2.37 | 0.49 | <0.0001* |
| TSA in Saliva (mg/dl) | 39.05 | 6.35 | 68.23 | 2.71 | 81.33 | 3.94 | <0.0001* |
| TSA in Serum (mg/dl) | 49.75 | 4.87 | 65.65 | 3.56 | 75.98 | 3.58 | <0.0001* |
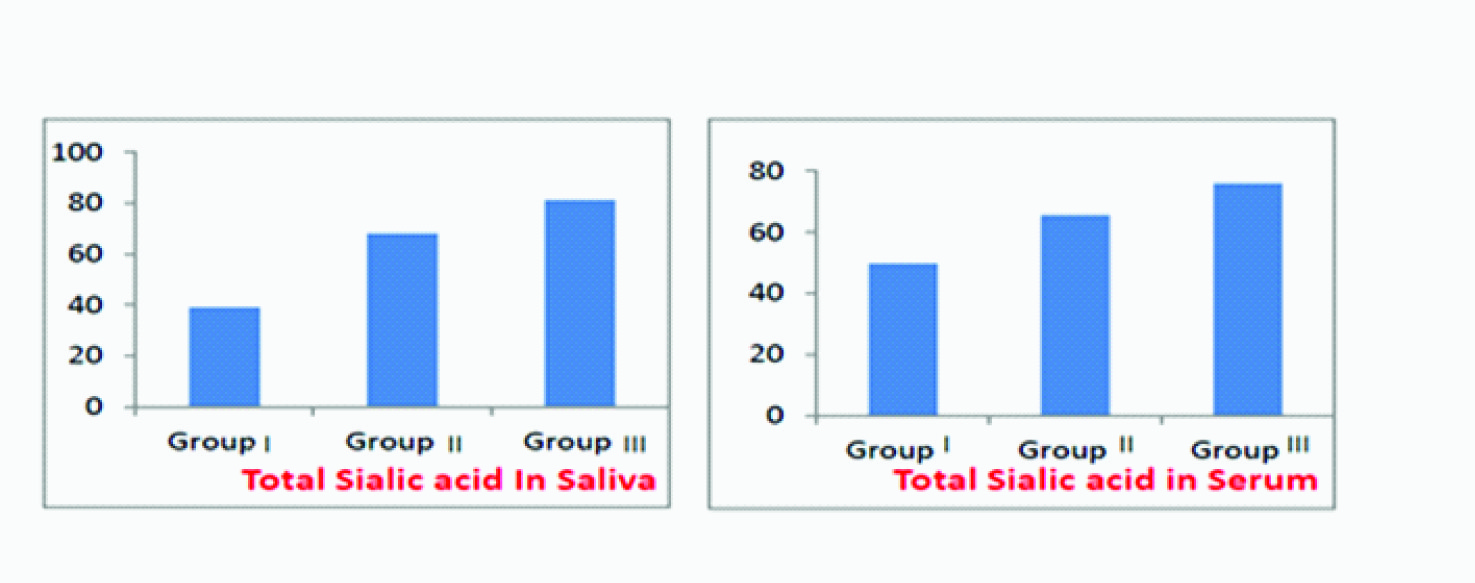
It is evident that with increase in severity of periodontal disease from group I to III, the mean TSA levels in saliva and serum also significantly increased from Group I to Group II and maximum in Group III. A significant correlation has been found between the periodontal findings and levels of TSA in saliva and serum, which signifies a relationship between periodontal diseases and salivary and serum TSA levels [Table/Fig-2].
Distribution of mean TSA levels in (a) saliva and (b) serum amongst three groups
Analysis in [Table/Fig-3], shows that differences salivary TSA levels in Group I and Group II , Group I and Group III and Group II and Group III . These differences were found to be statistically significant at( p<0.001 ).
Comparision of salivary sialic acid levels amongst the three groups by boneferroni multiple comparison test
| Pair-wise comparison among the groups | Mean Difference | Std. Error | p-value |
|---|
| Group I and Group II | -29.300* | 1.193 | <0.001 |
| Group I and Group III | -42.333* | 1.193 | <0.001 |
| Group II and Group III | -13.033* | 1.193 | <0.001 |
* statistically significant
Analysis in [Table/Fig-4], shows that differences in serum TSA levels in Group I and Group II , Group I and Group III and Group II and Group III were statistically significant at p<0.001.
Comparision of serum sialic acid levels amongst the three groups by Boneferroni multiple comparison test
| Pair-wise comparison among the groups | Mean Difference | Std. Error | p-value |
|---|
| Group I and Group II | -15.7* | 1.036 | <0.001 |
| Group I and Group III | -26.1* | 1.036 | <0.001 |
| Group II and Group III | -10.3* | 1.036 | <0.001 |
* statistically significant
Boneferroni multiple comparison test analysis showed that differences in salivary as well as serum TSA levels amongst the three groups, were statistically significant. With an increase in the severity of periodontitis, an increased in salivary as well as serum TSA levels was noted.
Discussion
TSA is a marker of the acute - phase response [10]. Furthermore, it is a predictor of several systemic disorders, cardiovascular events, rheumatoid arthritis and diabetes [11,12]. Increased content of glucoconjugates such as TSA are detected in serum of head & neck cancer patients [13]. In our present study, we estimated TSA levels in saliva and serum. TSA is the combination of free SA and bound SA (LASA).The mean salivary and serum TSA levels of group III were significantly higher than group II & I. Even though TSA levels were detected in saliva & serum of healthy controls but they were significantly lesser than the levels in group II & III. Thus we found a positive correlation between periodontal statuses and salivary as well as serum TSA levels in patients and controls. The result of our present study is in accordance with result obtained, in various studies performed by Davis G et al., Shinohara and co-workers, Jawazaly J et al., Davis G et al., found a significant association between elevated SA levels in oral epithelial cells & gingivitis [14]. Shinohara and co-workers, studied the relationship between the salivary SA concentrations in rats having gingivitis. Their results suggested that the amount of SA elevated in saliva can be a useful index of the severity of periodontal disease [15]. According to Jawazaly G, there exists a significant association between elevated levels of LASA (lipid associated SA) levels and periodontal diseases [16]. The elevation in TSA concentration could be attributed to the increase rise in the sialidase enzyme activity in periodontal diseases [17]. SA concentration increases rapidly following the inflammatory and injury process. In general, the acute phase proteins limits injury and aids healing [18]. Elevated levels of TSA in saliva and serum may have a protective role in periodontitis as the elevated levels of TSA might be considered as a defense molecule against the increased oxidative stress in inflammatory diseases including periodontitis. High mean concentration of SA might be attributed to a rapid synthesis of sialoproteins and to significant increase in release of globulins, resulting from tissue damage [19]. Sialicacid levels are markedly increased in those with periodontal diseases, confirming that this saccharide plays an important role in the immune system. Therefore, the present data indicates that salivary and serum TSA levels have a significant association with periodontal health and disease.
Conclusion
Based on the findings of the present study, increased TSA levels in both the saliva and serum may suggest its role in the pathogenesis of periodontal disease. Also, salivary and serum TSA levels can differentiate between periodontal disease and normal condition. Thus, it can be used as an adjunct to diagnose the current periodontal disease status and to assess the treatment outcomes.Estimation of is quite simple, reliable and reproducible and thus it could be an useful biomarker in periodontal diseases.
* statistically significant
* statistically significant