Materials and Methods
Study design and patient population
Fifty two consecutive patients with AHF in New York Heart Association (NYHA) class III/IV were enrolled for the present study. AHF was defined as a sudden or recent onset of symptoms of HF that represented either a de novo presentation or decompensation of an established chronic heart failure. After admission to the intensive care unit (ICU), all patients received optimal HF treatment as per current guidelines [10–13]. Ischemic aetiology of HF was classified based on the evidence of an old myocardial infarction (MI) on Electrocardiography (ECG), chronic stable angina or documented history of coronary artery disease (CAD) or revascularization. Patients with significant renal (serum creatinine>2mg/dl), hepatic, pulmonary or valvular heart disease, sepsis and those who presented with ACS within the past one month were excluded from the study. Informed consent was obtained from all patients before participation in the study and the protocol was approved by the Ethical Committee of our institution.
Biomarker evaluation
For biomarker analysis, five ml venous blood was collected within 24h of admission and a second sample [for NT-proBNP and hs Troponin T (hsTropT)] was obtained 48h later. Serum for hsTropT, hsCRP and UA were analysed immediately whereas for NT-proBNP, aliquots of serum were stored at -20oC until all the 52 samples were collected for analysis. NT-proBNP was analysed using the electrochemiluminescence immunoassay (ECLIA) method on the Elecsys 2010 analyzer (Hitachi High-Technologies Corporation, Tokyo, Japan). The cut-off values of NT-proBNP for diagnosis and exclusion of AHF were those derived in the ICON study [14]. Briefly, a ‘rule-out’ cut-point of 300 pg/ml was used for all patients and, values of 450, 900 and 1800 pg/ml in the age groups <50, 50-75 and >75 yrs respectively were used for ‘ruling-in’ a diagnosis of AHF. hsTropT was analysed using the ECLIA sandwich principle on the same analyser that was used for NT-proBNP. The upper reference limit (99th percentile) for the current assay was 0.014ng/ml (95% CI, 0.012-0.024ng/ml). A level >0.014ng/ml was hence used as the definition of an ‘elevated troponin’. hsCRP was analysed using the particle enhanced immunoturbidimetric assay on the MODULAR P800 analyzer (Hitachi High-Technologies Corporation, Tokyo, Japan). A value ≥0.5 mg/dl as per International Federation of Clinical Chemistry consensus reference interval was used to define an ‘elevated hsCRP’ level.
Echocardiography
A detailed Echocardiographic examination was performed on all patients on the PHILIPS En Visor C HD machine (PHILIPS ULTRASOUND, Bothell, WA, USA). Left ventricular (LV) and left atrial (LA) dimensions and LV ejection fraction (EF) were quantified as per American Society of Echocardiography (ASE) recommendations on chamber quantification (2005) [15]. LV diastolic function was assessed as per the recommendations of ASE (2009) [16]. Based on the LV EF, patients were divided into two groups: those with heart failure with reduced EF (HFrEF) (EF<50%) and those with preserved EF (HFpEF) (EF≥50%).
Discharge, Follow-up and study end-points
Patients were discharged at the discretion of the treating physician as and when clinical stability permitted. Patients were instructed to report worsening HF symptoms and advised revisit for any exacerbation of symptoms. Periodic follow-up on telephonic contact was also performed to assess the postdischarge functional status and mortality. The end-point of the study was a composite of adverse events of cardiovascular death, rehospitalisation for worsening HF symptoms and refractory HF (NYHA functional class III or IV despite optimal medical treatment).
Statistical Analysis
Continuous variables are expressed as mean± standard deviation (SD). Categorical variables are expressed as percentages. The baseline characteristics were compared using Student’s t-test for continuous variables and χ2 (Chi-square) test for categorical variables. Correlation co-efficients between variables was calculated using the Spearman’s rank correlation co-efficient test. The prognostic performance of the assays was assessed using Receiver operating-characteristic (Roc) urves. Optimal cut-points for the assays were determined using the ROC curves. Kaplan-Meier analysis was performed on the cumulative rates of event-free survival. Log-rank test was used as a test of significance between the two curves. All reported p-values are two-sided; tests were considered statistically significant if p-value was <0.05.
Results
Baseline Characteristics
The baseline characteristics of the 52 study patients are presented in [Table/Fig-1]. The mean age of patients was 57.4±16.0 yrs. The mean admission blood glucose was 165±126.9 mg/dl and nearly a third had history of hypertension. The average duration of stay in the hospital was 5.7±2.9 days and modestly correlated with hsTropT (Spearman ρ=0.27, p=0.04).
Baseline Characteristics of the Study Patients
| Baseline Characteristics | Values* |
|---|
| Age (in years) | 57.4±16.0 |
| % of males | 55.8 |
| Duration of hospital stay (in days) | 5.7±2.9 |
| Diabetes mellitus (%) | 40.4 |
| Hypertension (%) | 36.5 |
| BMI (in kg/m2) | 23.1±2.5 |
| Smoking History (%) | 46.2 |
| % of Ischemic heart failure | 30.8 |
| Blood Glucose (mg/dl) | 165.0±126.9 |
| Hemoglobin (gm/dl) | 12.5±2.7 |
| Total blood count (per cumm) | 10480±4467 |
| Blood Urea (mg/dl) | 52.2±29.3 |
| Serum Creatinine (mg/dl) | 1.3±0.4 |
| Uric Acid (mg/dl) | 8.1±3.3 |
| Sodium (mEq/L) | 133.8±5.6 |
| Potassium (mEq/L) | 4.2±0.9 |
| Admission NT-proBNP (pg/ml) | 10194.6±10397.7 |
| 48-hour NT-proBNP (pg/ml) | 8414.7±10551.8 |
| hsTropT (ng/ml) | 0.24±0.56 |
| LDL (mg/dl) | 84.8±40.7 |
| hsCRP (mg/dl) | 2.13±1.82 |
| LVIDd (mm) | 5.6±0.9 |
| LVIDs (mm) | 4.4±1.1 |
| % fractional shortening (FS) | 20.9±8.8 |
| EF (%) | 37.4±9.6 |
| % of patients with EF≥50% | 15.4 |
| Diastolic Stage | 2.0±1.6 |
* Values expressed as mean± standard deviation (SD) and percentages (BMI=Body mass index; CRP=C-reactive protein; EF=Left ventricular ejection fraction; hs=high sensitivity; LDL=Low-density lipoprotein cholesterol; LVID= Left ventricular internal dimension in d (diastole) or s (systole); NT-proBNP=N-terminal pro B-type natriuretic peptide; TropT=cardiac Troponin T)
Aetiology of heart failure
Nearly half of the patients had idiopathic dilated cardiomyopathy (46.2%), followed by ischemic heart failure (30.7%), hypertensive heart disease (17.3%), peripartum cardiomyopathy (3.9%) and isolated LV noncompaction (1.9%). Thus, more than two-thirds (69.2%) of cases were of non-ischemic aetiology (p=0.004), of which idiopathic dilated cardiomyopathy was the dominant form.
NT-proBNP
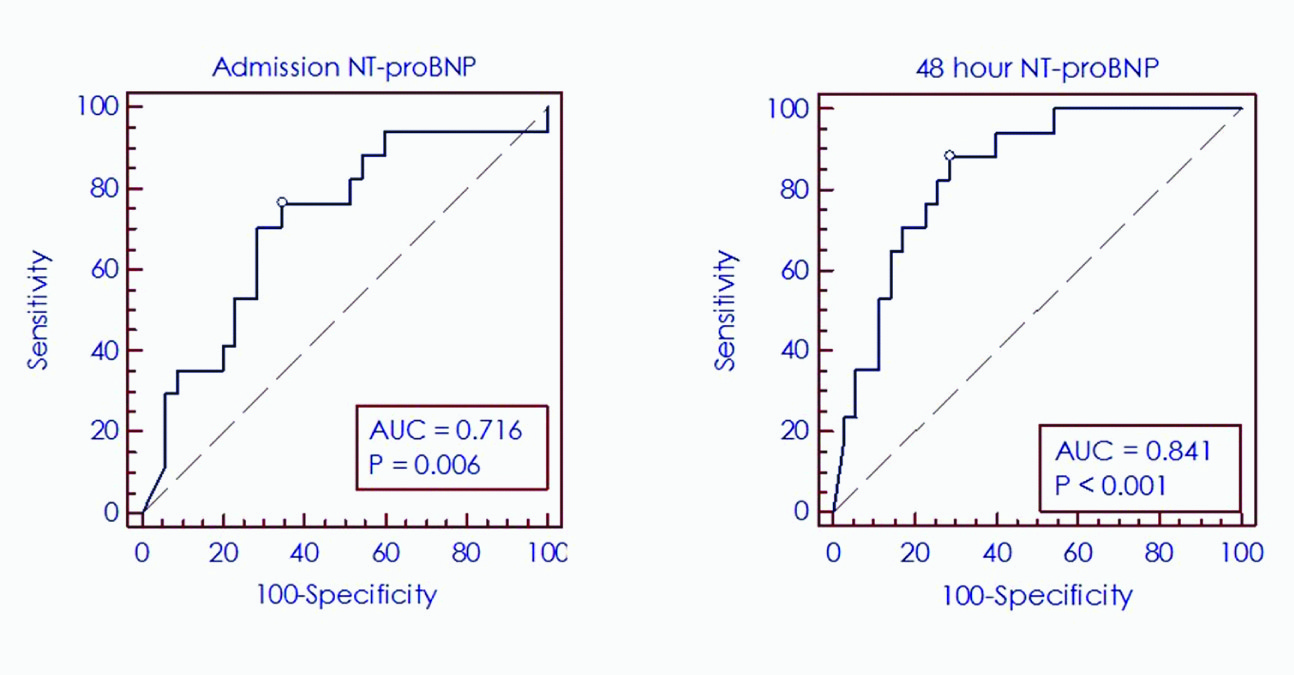
The mean admission and 48h NT-proBNP values were 10194.6±10397.7 and 8414.7±10551.8 pg/ml respectively; thus, an 18% fall in the initial NT-proBNP was noted following initiation of treatment. A comparison of the admission and 48h NT-proBNP thus yielded two groups of patients. Group 1 consisted of patients with a rising pattern of NT-proBNP at 48h (32.7%) whereas in Group 2, the 48h value was showing a declining trend compared with the admission value (67.3%). A statistically significant increase in adverse events and a trend towards increasing mortality was noted in group 1 (76.5% vs 11.4%, p<0.0001 and 23.5% vs 5.7%, p=0.059 respectively); conversely, a fall in NT-proBNP value of nearly 37% was seen in patients who did not experience adverse outcomes on follow-up. A Receiver operating characteristic (ROC) curve analysis of admission and 48h NT-proBNP was performed [Table/Fig-2]. At admission, an optimal cut-point of >6341 pg/ml predicted adverse outcomes with a sensitivity and specificity of 76.5% and 65.7% respectively (Area under the curve [AUC]=0.72, p=0.0056) with a relative risk (RR) of adverse events of 3.51 (95% CI=1.32-9.35, p=0.012). A 48 Hour NT-ProBNP >4988 pg/ml similarly predicted adverse outcomes with a sensitivity and specificity of 88.2% and 71.4% respectively (AUC=0.84, p<0.0001) with a RR of 8.1 (95% CI=2.05-31.92, p=0.0028). The Kaplan-Meier survival curves for NT-proBNP [Table/Fig-3a&b] for the parameters of changing NT-proBNP status and optimal cut-point of 6341 pg/ml showed a statistically significant divergence (log-rank test, p<0.0001) suggesting that a rising NT-proBNP level after admission and a baseline NT-proBNP value >6341 pg/ml are associated with adverse cardiovascular outcomes on follow-up.
Receiver Operating Characteristic (Roc) Curves for the Performances of Admission and 48 Hour NT-ProBNP (N-Terminal Pro B-Type Natriuretic Peptide) Assays
RKaplan-Meier Survival Curves for a) Changing Patterns of NT-ProBNP after Admission B) Optimal NT-proBNP Value >6341pg/ml C) hsTropT and D) hsCRP (CRP=C-reactive protein; hs=high sensitivity; NT-proBNP=N-terminal pro B-type natriuretic peptide; TropT=cardiac Troponin T)

hsTropT
Elevated Troponin (>0.014ng/ml) was observed in the majority of patients (48/52) (92.3%). Specifically, patients with heart failure of ischemic aetiology had higher troponin values compared with patients of non-ischemic aetiology (0.47±0.68 versus 0.14±0.47 ng/ml, p<0.05). hsTropT correlated with serum creatinine (p=0.46, p=0.007), hsCRP (ρ =0.34, p=0.01) and a modest correlation was found with UA ρ =0.25, p= 0.07). When hsTropT was analysed as a dichotomous variable on Kaplan-Meier survival curves [Table/Fig-3c], no significant difference in survival was observed at a discriminatory cut-off of 0.014ng/ml (log-rank test, p=0.73).
hsCRP
Elevated hsCRP (≥ 0.5 mg/dl) was seen in 39 out of 52 patients (75%). A Kaplan-Meier survival curve analysis [Table/Fig-3d] with a discriminatory value of 0.5 mg/dl did not reveal statistical significance between the two curves (log-rank test, p=0.97).
Uric Acid
An elevated UA (>5.6mg/dl for females and >7 mg/dl for males) was found in 33 out of 52 patients (63.5%) with a mean value of 8.1±3.3 mg/dl. A significant inverse relation was noted between UA and LV EF (Spearman ρ= -0.29, p=0.03). A higher value was also observed in patients with adverse outcomes (8.8±3.9 vs 7.8±2.8 mg/dl) although this was not statistically significant (p=0.29).
Echocardiography: The average EF was 37.4±9.6%; majority of the patients thus had HFrEF (84.6%), the remainder (15.4%) having HFpEF. A comparison of these two groups with respect to baseline characteristics can be seen in [Table/Fig-4].
A Comparison of the two Groups of Heart Failure Patients with Reduced or Preserved Ejection Fraction
| Baseline characteristics | HFrEF (n=44) | HFpEF (n=8) | p-value |
|---|
| Age (in years) | 55.0±15.4 | 70.9±13.1 | 0.009 |
| % of males | 54.5 | 62.5 | 0.677 |
| Diabetes Mellitus (%) | 36.4 | 62.5 | 0.166 |
| Hypertension (%) | 29.5 | 75 | 0.014 |
| BMI (in kg/m2) | 23.1±2.5 | 23±2.8 | 0.919 |
| % of Ischemic heart failure | 27.3 | 50 | 0.200 |
| Uric Acid (mg/dl) | 8.4±3.2 | 6.7±3.6 | 0.18 |
| Sodium (mEq/L) | 134.2±5.7 | 131.5±4.3 | 0.209 |
| Admission NT-proBNP (pg/ml) | 11327±10743.4 | 3966.4±5126.5 | 0.06 |
| 48-hour NT-proBNP (pg/ml) | 9386.9±11146.5 | 3068±3059 | 0.12 |
| hsTropT (ng/ml) | 0.28±0.6 | 0.05±0.05 | 0.288 |
| hsCRP (mg/dl) | 1.96±1.75 | 3.0±2.0 | 0.136 |
| LVIDd (mm) | 5.8±0.8 | 4.1±0.3 | <0.0001 |
| LVIDs (mm) | 4.8±0.7 | 2.6±0.4 | <0.0001 |
| LV ejection fraction (%) | 33.9±4.9 | 56.8±3.9 | <0.0001 |
| Diastolic Stage | 2.2±1.7 | 1±0.0 | 0.05 |
| Adverse Events (%) | 31.8 | 37.5 | 0.753 |
| Mortality (%) | 13.6 | 0 | - |
(BMI=Body mass index; CRP=C-reactive protein; HFrEF and HFpEF=Heart failure with reduced (r) and preserved (p) ejection fraction; hs=high sensitivity; LVID= Left ventricular internal dimension in d (diastole) or s(systole); NT-proBNP=N-terminal pro B-type natriuretic peptide, TropT=cardiac Troponin T).
Follow-up duration: Median follow-up of 4.8 months (range 1 day-6.6 months).
Adverse Events: A total of 17 patients (32.7%) had an end point on follow-up which included 6 deaths (11.5% overall mortality), 3 rehospitalisations for worsening HF symptoms and 8 patients in refractory HF (NYHA class III or IV). [Table/Fig-5] shows the comparison between the patients with or without an adverse event on follow-up. It can be observed from [Table/Fig-5] and the Kaplan-Meier survival curve in [Table/Fig-3a] that even a modest increase in the mean admission NT-proBNP level of 5% (absolute value of +747 pg/ml) resulted in a statistically significant increase in adverse outcomes. On the other hand, a 37.8% reduction in the mean admission NT-proBNP level was observed in patients who remained free of adverse events at the end of follow-up, suggesting that both the absolute values and the relative change in the NT-proBNP values following initiation of treatment can predict adverse outcomes. The other three biomarkers (hsTropT, hsCRP and UA) were not significantly different between the two groups. On univariate analysis [Table/Fig-6], the only predictors of adverse outcomes were the admission and 48h NT-proBNP levels together with the change in the NT-proBNP status.
Comparison Between Patients with or without Adverse Outcomes on Follow-Up
| Baseline Characteristic | Adverse Event | No Adverse Event | p-value |
|---|
| Age (in years) | 57.6±10.8 | 57.3±18.2 | 0.95 |
| % of males | 52.9 | 57.1 | 0.78 |
| Duration of hospital stay (days) | 5.9±2.9 | 5.6±3.1 | 0.74 |
| Diabetes Mellitus (%) | 52.9 | 34.3 | 0.19 |
| Hypertension (%) | 35.3 | 37.1 | 0.89 |
| Body mass index (kg/m2) | 23.3±2.4 | 23.1±2.6 | 0.79 |
| Blood Glucose (mg/dl) | 169.4±117.8 | 162.9±132.8 | 0.86 |
| Hemoglobin (gm/dl) | 11.9±2.4 | 12.8±2.9 | 0.27 |
| Total blood count (per cumm) | 11741±6285 | 9868±3189 | 0.15 |
| Serum Creatinine (mg/dl) | 1.3±0.4 | 1.2±0.4 | 0.615 |
| Uric Acid (mg/dl) | 8.8±3.9 | 7.8±2.8 | 0.295 |
| Sodium (mEq/L) | 132.7±7.1 | 134.3±4.8 | 0.341 |
| Admission NT-proBNP (pg/ml) | 14800.4±11637.4 | 7957.6±9092.9 | 0.0245 |
| 48hour NT-proBNP (pg/ml) | 15547.7±12348.2 | 4950.0±7580.1 | 0.0004 |
| Group 1 (%) | 76.5 | 11.4 | <0.0001 |
| Group 2 (%) | 23.5 | 88.6 | <0.0001 |
| hsTropT (ng/ml) | 0.25±0.47 | 0.23±0.6 | 0.905 |
| hsCRP (mg/dl) | 2.2±1.9 | 2.0±1.7 | 0.703 |
| LVIDd (mm) | 5.4±0.9 | 5.6±0.9 | 0.456 |
| LVIDs (mm) | 4.3±1.0 | 4.5±1.1 | 0.529 |
| EF (%) | 36.9±9.9 | 37.6±9.5 | 0.807 |
| Follow-up duration (in days) | 96.9±67.8 | 136.8±34.3 | 0.007 |
(CRP=C-reactive protein; EF=Left ventricular ejection fraction; Groups 1 and 2=Groups with rising or declining NT-proBNP levels respectively after admission; hs=high sensit ivity; LVID= Left ventricular internal dimension in d (diastole) or s (systole); NT-proBNP=N-terminal pro B-type natriuretic peptide; TropT=cardiac Troponin T)
Univariate Analysis for Predicting Adverse Events on Follow-Up
| Variable | Odds Ratio (95% CI) | p-value |
|---|
| Age>65 years | 0.4 (0.09-1.7) | 0.22 |
| Serum Creatinine>1.5mg/dl | 0.77 (0.2-2.94) | 0.70 |
| Admission NT-proBNP>6341pg/ml | 6.23 (1.66-23.32) | 0.007 |
| 48-hour NT-proBNP>4988pg/ml | 18.75 (3.6-97.4) | 0.0005 |
| Rising NT-proBNP | 18.6 (4.26-81.22) | 0.0001 |
| Declining NT-proBNP | 0.05 (0.01-0.23) | 0.0001 |
| hsTropT | 1.5 (0.14-15.59) | 0.73 |
| hsCRP | 1.87 (0.44-7.93) | 0.39 |
| Uric Acid>7mg/dl | 1.54 (0.47-5.11) | 0.48 |
| LVIDd | 0.83 (0.23-3.02) | 0.78 |
| EF<40% | 0.71 (0.19-2.63) | 0.61 |
| Sodium<135mEq/L | 1.73 (0.53-5.72) | 0.37 |
(CRP=C-reactive protein; EF=Left ventricular ejection fraction; hs=high sensitivity; LVID= Left ventricular internal dimension in d (diastole) or s (systole); NT-proBNP=N-terminal pro B-type natriuretic peptide; TropT=cardiac Troponin T)
Effect of renal dysfunction on biomarkers: The biomarkers showed significant correlation with serum creatinine (NT-proBNP ρ=0.38, p=0.005; hsTropT ρ=0.46, p=0.007; hsCRP ρ=0.34, p=0.01 and UA ρ=0.48, p=0.003).
Discussion
NT-proBNP was determined at admission and 48h later with an objective of evaluating the predictive power of both the absolute and the change in NT-proBNP values following initiation of treatment. A 48h value would also reflect the kinetics of circulating NT-proBNP, given that half life of NT-proBNP is only 70-120 min [17,18]. Increased ventricular wall stress due to cardiomyocyte stretch secondary to volume or pressure overload is the primary stimulus for the synthesis and secretion on BNP [5,18,19]. In a prospective study of 1586 patients in the Breathing Not Properly (BNP) multinational study, Maisel et al., found BNP to be the single most accurate predictor of the presence or absence of congestive heart failure [3]. Similar outcomes of better diagnostic accuracy over conventional diagnostic strategy was established in the BASEL [20] (BNP) and PRIDE [5] (NT-proBNP) studies. We found a statistically significant increase in adverse outcomes with a trend towards increasing mortality in patients showing a rising pattern of NT-proBNP following admission; conversely, a fall in NT-proBNP value of nearly 37% was seen in patients who did not experience adverse outcomes on follow-up. On univariate analysis, we found that an admission NT-proBNP level >6341 pg/ml and 48h NT-proBNP level >4988 pg/ml predicted adverse outcomes on follow-up (Odds Ratio, OR-6.23, 95%CI-1.66-23.32, p=0.007 and OR-18.75, 95%CI-3.6-97.4, p=0.0005 respectively). BNP/NT-proBNP have proven to be independent predictors of adverse cardiovascular outcomes in several multicentre prospective studies [3,6,14,21]. Several studies and reviews on the predictive power of serial measurement of BNP/NT-proBNP have been published [7,21–23]. Both rising [7] and declining [21,23,24] patterns have been shown to be associated with clinical outcomes in prospective studies. In a prospective study of 241 adult patients aged >25y, Michtalik et al., reported that a <50% decrease of admission BNP at discharge was found to increase the risk of readmission or death within one year by 40% [7]. Conversely, in one small study of 37 ADHF patients with serial measurements of NT-proBNP at admission, 4,12,24 hours and predischarge, progressive reduction to a complete relief of HF symptoms was accompanied by a reduction of 58% in the level of NT-proBNP [23]. Given the robust data on the serial changes in NT-proBNP and association with adverse outcomes, a ‘BNP guided therapy’ may soon be accepted as a standard of care in AHF. Current guidelines [12] however, do not support a routine use of serial measurements to guide therapy, although most standard HF guidelines [11–13,25] recommend the use of NT-proBNP/BNP in patients presenting to ED with acute dyspnea to improve diagnostic accuracy, especially when the diagnosis is uncertain [12,25]. We found an inverse correlation of NT-proBNP with body mass index (BMI) (r= -0.35, p=0.01) similar to that observed in the BNP study [26]. Although, increased clearance from adipocytes has been postulated as a cause of lower BNP values in obese people [22], a greater degree of cardiac cachexia and increased BNP was thought to simply reflect the severity of disease in the BNP study [26].
In our study, patients with HFpEF had nearly three times lower values of NT-proBNP compared to those with HFrEF (p=0.06). A lower BNP in patients with HFpEF was also observed in studies where echocardiographic data was available [8,14]. In the DOSE trial[8], the variability was attributed to less severe HF, high prevalence of obesity in patients with HFpEF and increased clearance by adipocytes.
cTn is a heterotrimeric complex consisting of TnC, TnI and TnT; all being present in a 1:1:1 stoichiometric ratio [1,27]. Troponin was almost universally elevated in our patients (92.3%) with a mean value of 0.24±0.56 ng/ml. Such large scale elevations upto 98% in AHF have been described in several studies using sensitive cTn assays [28,29]. Conventional older generation assays have yielded lower prevalence of cTn elevation in several prospective studies (34.5-80%) [30,31]. hsTropT correlated with serum creatinine (ρ=0.46, p=0.007) similar to the observation in the EFFECT study [30]. An important observation was the significant difference in hsTropT levels in ischemic versus non-ischemic heart failure (0.47±0.68 vs 0.14±0.47 ng/ml, p<0.05). Data on the differing incidence of cTn elevation in ischemic vs nonischemic HF are conflicting [9,29,32,33]. While some studies [9,29] including the ASCEND-HF [29] did not find significant difference, other studies [32,33] have found a significant increase in the Tn levels in patients with ischemic HF which was shown to be related to increased mortality in the ischemic group [33]. It has been speculated that increased cTn in the ischemic group reflects a higher degree of myocyte injury in HF [33]. Pathophysiological factors thought to be responsible for ongoing myocyte injury include excessive adrenergic stimulation through renin, angiotensin, aldosterone or endothelin signalling pathways, abnormalities in calcium handling, inflammatory cytokines, nitric oxide and oxidative and mechanical stress [3,30,34]. Transient increase in cell membrane permeability secondary to myocardial strain or subendocardial ischemia can cause leakage of cytosolic troponin [1,35]. However, most of the cTn in cells is not free (5-8% of TnT and 3.5% of TnI is the free fraction in cell) [27,36] but bound to myofibrils, suggesting a more severe injury in AHF. Apoptosis has been suggested as another mechanism of cTn release [1,35,37]. Troponin has been shown to be independent predictor of in-hospital mortality and adverse outcomes on follow-up in several prospective studies [9,28,30]. Both positive cTn at baseline and conversion to positive levels were associated with worse outcomes at 60d in an analysis from the PROTECT Pilot Study [37]. cTn was found to predict both short term and one year mortality in the BASEL V study [38]. However, not all studies are consistent with these results. In the ASCEND-HF biomarker substudy, elevated cTn was associated with worsened in-hospital outcomes like length of stay and worsening HF, but was not associated with worsened postdischarge outcomes at 30 or 180 days [29].
hsCRP is a hepatocyte-derived inflammatory cytokine shown to be increased in the setting of AHF, with high plasma hsCRP levels portending poor long-term outcomes (ADEPT Neurohormonal substudy) [39]. hsCRP correlated with Troponin (ρ=0.34, p=0.01) and UA (ρ=0.25, p=0.07) suggesting a link between inflammation, myocyte injury and increased oxidative stress in this cohort of AHF patients.
An elevated UA (>5.6mg/dl for females and >7 mg/dl for males) was found in 33 out of 52 patients (63.5%) with a mean value of 8.1±3.3 mg/dl. A significant inverse relation was noted between UA and LV EF (Spearman ρ= -0.29, p=0.03) suggesting a more prevalent state of oxidative stress in patients with more severe LV systolic dysfunction. UA correlated with admission NT-proBNP (p =0.34, p=0.01) and hsTropT (p =0.27, p=0.05) and creatinine (p=0.48, p=0.0003). UA is a marker of impaired oxidative metabolism and increased oxidative stress [40]. Activation of xanthine oxidase by tissue hypoxia in HF has been proposed as the mechanism of elevated UA in HF [40] although increased oxidative stress can result from an imbalance between reactive oxygen species and endogenous oxidative defence mechanisms [4]. A higher value was also observed in patients with adverse outcomes (8.8±3.9 vs 7.8±2.8 mg/dl) although this was not statistically significant (p=0.29).
Hyponatremia is the most common electrolyte abnormality in HF. In an analysis from OPTIMIZE-HF registry, Gheorghiade et al., analysed the predictive value of hyponatremia [41]. Both in-hospital and follow-up mortality was increased in patients with lower sodium values. In the ESCAPE study [42], hyponatremia was shown to be an independent predictor of mortality. Hyponatremia was seen in more than half (55.8%) of our patients. A trend towards lower sodium levels was noted in both the groups with rising NT-proBNP levels and increased adverse events.
Conclusion
We have prospectively evaluated the prognostic significance of four serum biomarkers in this small cohort of acute heart failure patients. Although hsTropT, hsCRP and UA were elevated in the vast majority of patients, only NT-proBNP predicted adverse outcomes on follow-up. Several important relations of biomarkers with various outcomes were derived in this study. For instance, the significant excess increase in troponin values in patients with ischemic heart failure, the correlations between hsCRP, hsTropT and UA suggesting a link between inflammation, myocyte injury and oxidative stress, as well as the linear relation between all the biomarkers and worsening renal function. NT-proBNP levels were inversely related to BMI and LV function. A change in the admission NT-proBNP level during the course of treatment was significantly associated with adverse outcomes. Even a modest increase of 5% above the baseline value was associated with increase in adverse outcomes; conversely, a fall in NT-proBNP value of nearly 37% was seen in patients who did not experience adverse outcomes on follow-up. We, therefore suggest a serial measurement of NT-proBNP, with at least one sample 48h after admission in patients admitted with AHF. It is hoped that more intensive and frequent follow-up of these patients would translate into early referral for rehospitalisation and reduced mortality. Large scale prospective studies to test a strategy of ‘BNP-guided therapy’ are warranted. Likewise, more research is needed to understand the link between inflammation, myocyte injury and oxidative stress in AHF which could provide therapeutic targets in treating this group of patients with an often dismal prognosis.