Early treatment is becoming increasingly popular in modern orthodontic philosophies and it is imperative that the mixed dentition space analysis is accurately done before such orthodontic treatment is offered [1]. Early detection of a deficiency in arch length is usually indicative of potential future dental crowding or malalignment.
The concept of dental space analysis is not a recent idea. Review of the literature indicating attempts to predict the width of the unerupted permanent canines and premolars were published in the early 1900’s and can be categorized into three basic methods:
Typically, the mesiodistal dimensions of unerupted canines and premolars have been extrapolated from measurements of the erupted permanent mandibular incisors using the Tanaka and Johnston prediction equations [5] or calculated using Moyers [6] probability tables. Both prediction techniques were developed using a population of “probable” North European ancestry.
To date, no data have been published regarding either the study of mixed dentition analysis or the study of mesiodistal tooth sizes in the Kodava community in Coorg population. The Kodavas inhabit the Coorg district in Karnataka. They are of unknown origin, are ethnically distinct, have unique facial and physical characteristics, distinct language (Kodava), dress, unique lifestyle and culture of their own. The purpose of this study is to evaluate the reliability of Tanaka and Johnston and Moyer’s (75th percentile) mixed dentition prediction methods in Kodava sample, to formulate regression equations for predicting the mesiodistal widths of unerupted canines and premolars and to construct probability tables for the Kodava population.
Materials and Methods
The dental study models of 60 subjects (30 males and 30 females) who belong to the Kodava community were collected from the patients visiting the dental college and rural satellite centres of the college.
The criteria for selection of subjects were:
Native Kodavas of age group between 14 -20 years.
The teeth to be measured had to be fully erupted, free of restorations, fractures or proximal caries and no evidence of hypoplasia or anomalous form.
Angles class I molar relation with no or minor malocclusion
Alginate impressions were made and the impressions were poured in laboratory dental stone (Type III) immediately. All measurements were taken directly from the unsoaped plaster study models. The teeth measured included the mandibular permanent central and lateral incisors, the maxillary and mandibular permanent canines, first and second premolars.
A digital caliper (Aerospace Co.) with a calibrated digital micrometer, read to the nearest 0.01mm was used to record all mesiodistal dimensions. The mesiodistal crown diameter of the teeth was measured, with the points of the caliper placed on the normal contact areas. The caliper was inserted from the buccal or labial with the instrument held at right angle to the long axis as described by Hunter and Priest [11] [Table/Fig-1].
A digital caliper was used to record all mesiodistal dimensions

Teeth were measured manually, and independent measurement by a second investigator was also done to compare interexaminer reliability. Interexaminer reliability was 0.2mm as suggested by Richardson and Malhotra [12]. The 2 sets of measurements were compared. When they varied by 0.2mm or less, the measurements were averaged. In instances where the measurements varied by more than 0.2mm, the teeth were remeasured and the nearest three measurements were averaged; however, this remeasurement seldom proved necessary.
Then the values obtained for the right and left segments were averaged so that there will be one value for maxillary canine and premolars and one value for mandibular canines and premolars for each value of mandibular incisors.
The following statistical analyses were calculated on the Kodava population.
1) Utilizing the data collected, a range, mean, and standard deviation of the tooth groups were determined for combined groups and for males and females separately. Students unpaired t-test was used to compare the sex differences between the groups of teeth that were statistically evaluated.
2) Actual tooth measurements obtained from the sample were compared with the predicted values derived from Tanaka and Johnston equations. In Tanaka and Johnston prediction formula, the sum of the mesiodistal widths of the four mandibular incisors are correlated with the sum of the mesiodistal diameters of the mandibular and maxillary canines and premolars. The Tanaka and Johnston regression equation [5] is as follows:
Y= 10.5 + 0.5 (X) (Mandibular canine-premolar segment)
Y= 11.0 + 0.5 (X) (Maxillary canine-premolar segment)
Y= the estimate of the sum of the mesiodistal widths of the unerupted canines and premolars on either the right or left side.
X=the sum of the mesiodistal widths of the four mandibular incisors.
The difference between the predicted widths of the canine and premolars according to Tanaka and Johnston [5] and the actual widths of the canine and premolars were tested for significance using students paired t-test.
Moyers had proposed charts at probability levels ranging from 5th to 95th percentiles for predicting the size of unerupted canines and premolars. For clinical applications, Moyers recommended values established at the 75th percentile [6]. Actual measurements were statistically compared with the predicted values obtained from the Moyers probability tables at the 75th percentile confidence levels using student’s paired t-test.
3) Correlation and regression analysis were performed and standard regression equations for both sexes combined and for males and females separately were developed that could be used clinically for the prediction of tooth sizes in Kodava sample. These “least square” regression equations were of the form Y =A + B(X) where Y equals the predicted mesiodistal size of canine and premolars (maxillary and mandibular) in one quadrant in millimeters and X equals the measured mesiodistal widths of the four permanent mandibular incisors in millimeters. A+B equal the constants to be derived (A is the y-intercept and B the slope of the regression line).
4) From the data obtained, probability charts were constructed to be used for the Kodava population.
Results
The determination of sex difference was performed for groups of teeth that were to be used for statistical evaluation. There were statistically significant difference between the sum of mesiodistal widths of mandibular incisors (p=0.02) and the sum of permanent canines and premolars in the mandibular arch (p=0.007) between males and females. The combined mesiodistal widths of canines and premolars of the male subjects were significantly larger than the females. But in the maxillary arch, the sum of mesiodistal widths of canines & premolars between males and females showed differences but were not statistically significant (p=0.177) [Table/Fig-2].
Comparison of mesiodistal widths of groups of teeth between male and female subjects
| Sum of teeth | Sex | Mean±SD | p-value |
|---|
| Mandibular incisors | M(n=30) | 22.39±1.28 | 0.02 |
| F(n=30) | 21.57±1.35 |
| Mandibular canines, first and second premolars | M(n=30) | 20.65±0.89 | 0.007 |
| F(n=30) | 19.93±1.09 |
| Maxillary canines, first and second premolars | M(n=30) | 21.01±0.85 | 0.177 |
| 20.68±0.96 |
Students paired t-tests were performed to compare the differences between the measured mesiodistal widths of canine, first and second premolars and the predicted values derived from Moyers (75%) and Tanaka and Johnston methods for the maxillary and mandibular arch for males and females respectively.
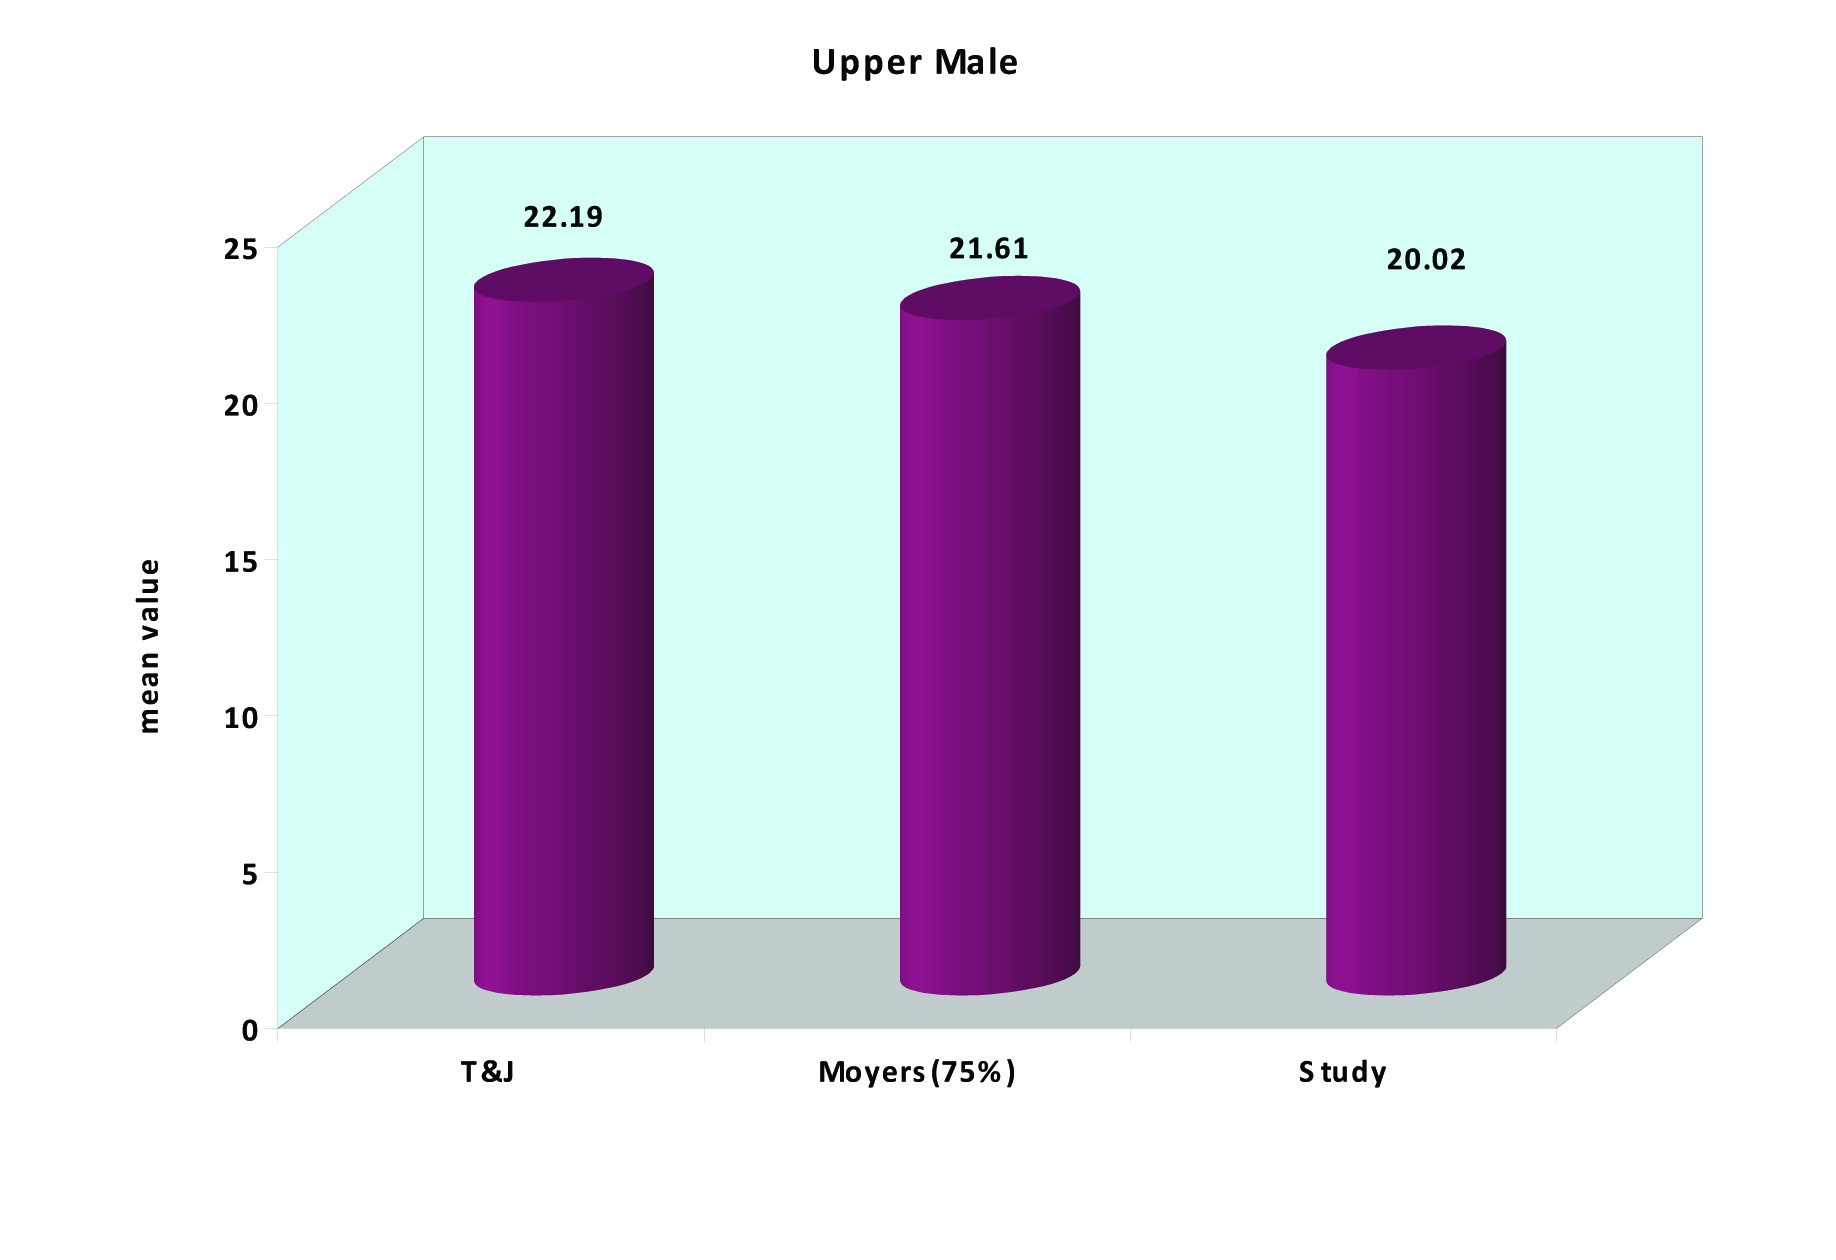
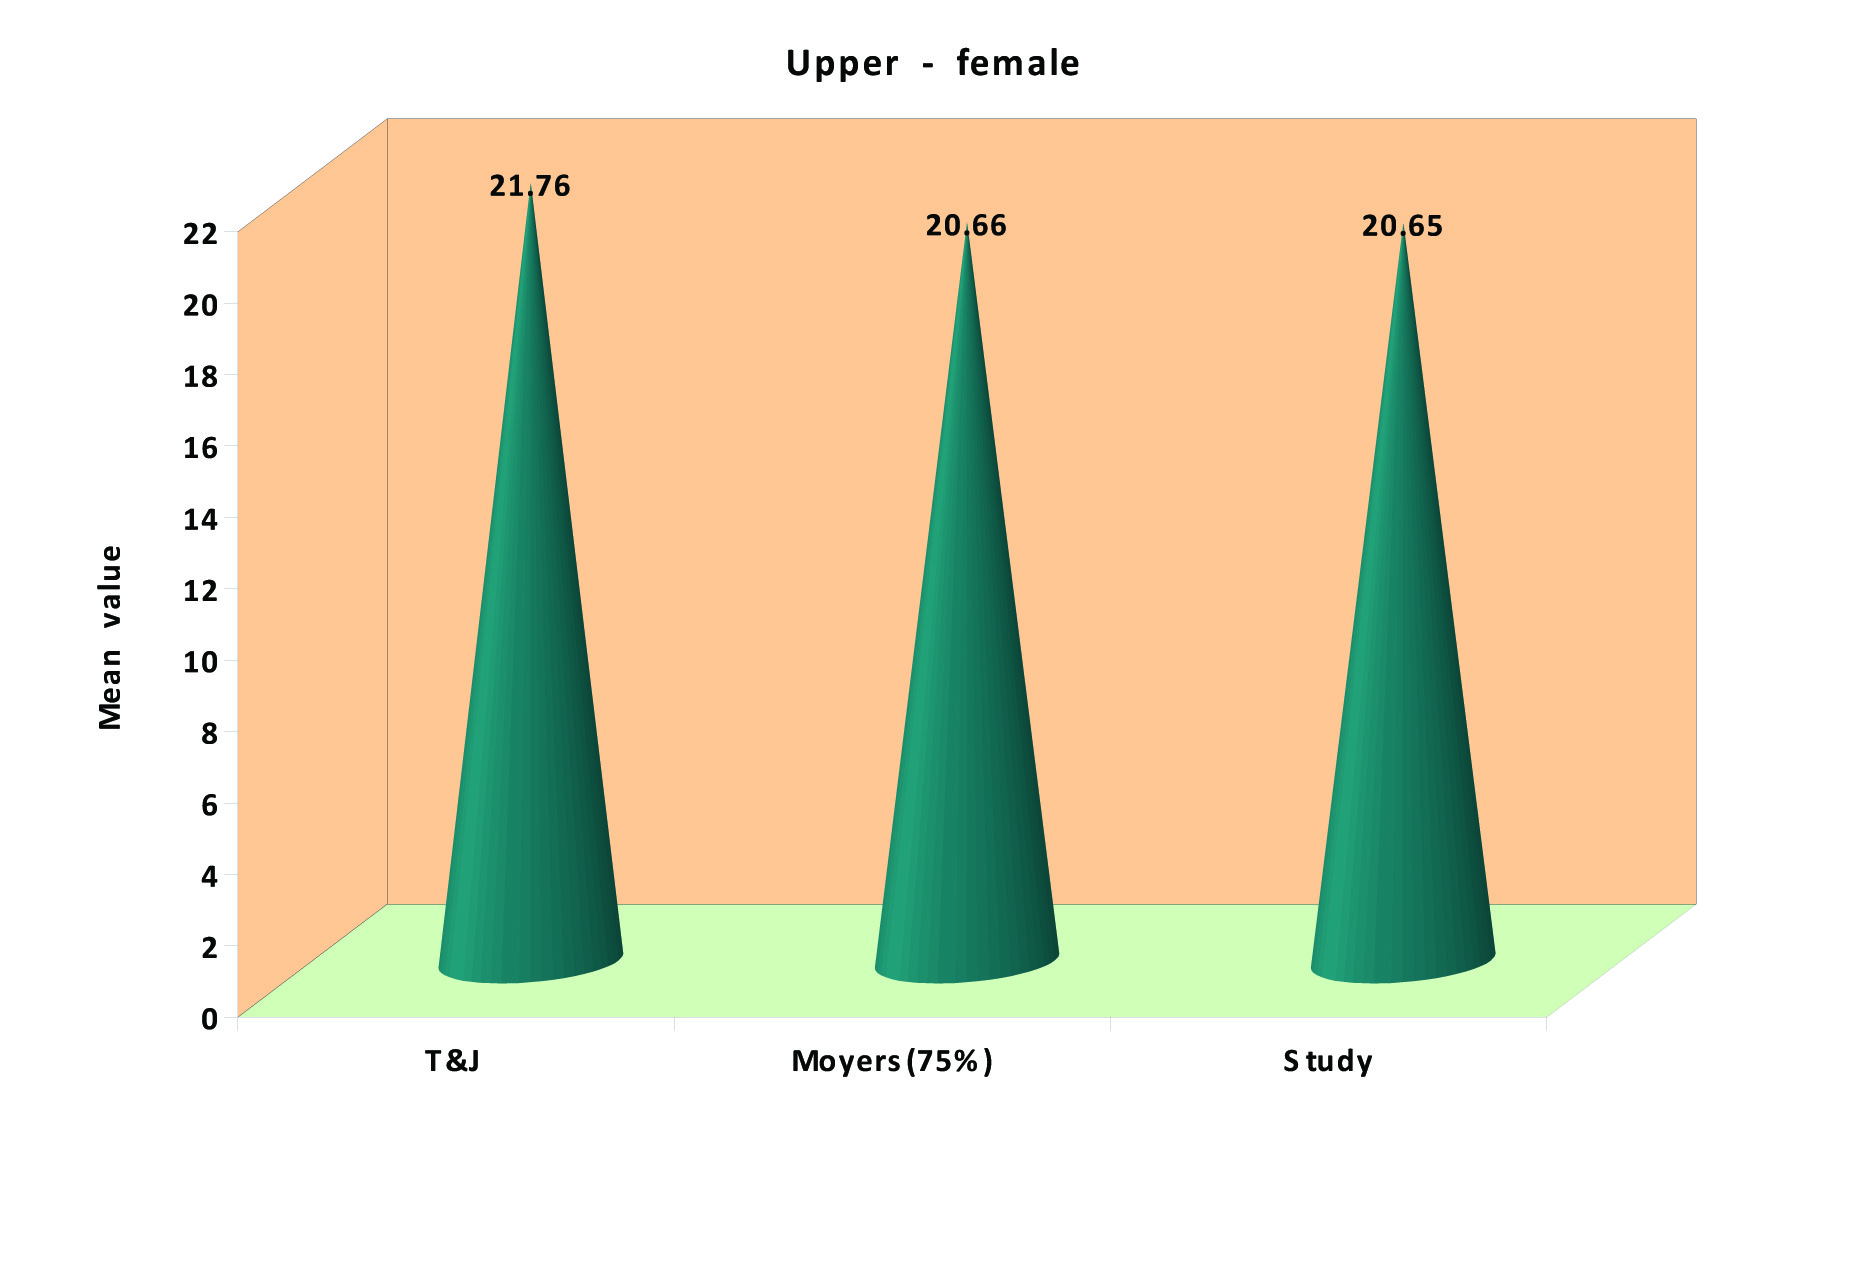
In the maxillary arch, Tanaka and Johnston method overestimated the measured values for both males and females. Moyers (75%) also overestimated the measured values more in males than females [Table/Fig-3,4].
Comparison of actual measurements and those predicted by Moyers (75%) and Tanaka–Johnston equations in male subjects in the maxillary arch
Comparison of actual measurements and those predicted by Moyers (75%) and Tanaka –Johnston equations in female subjects in the maxillary arch
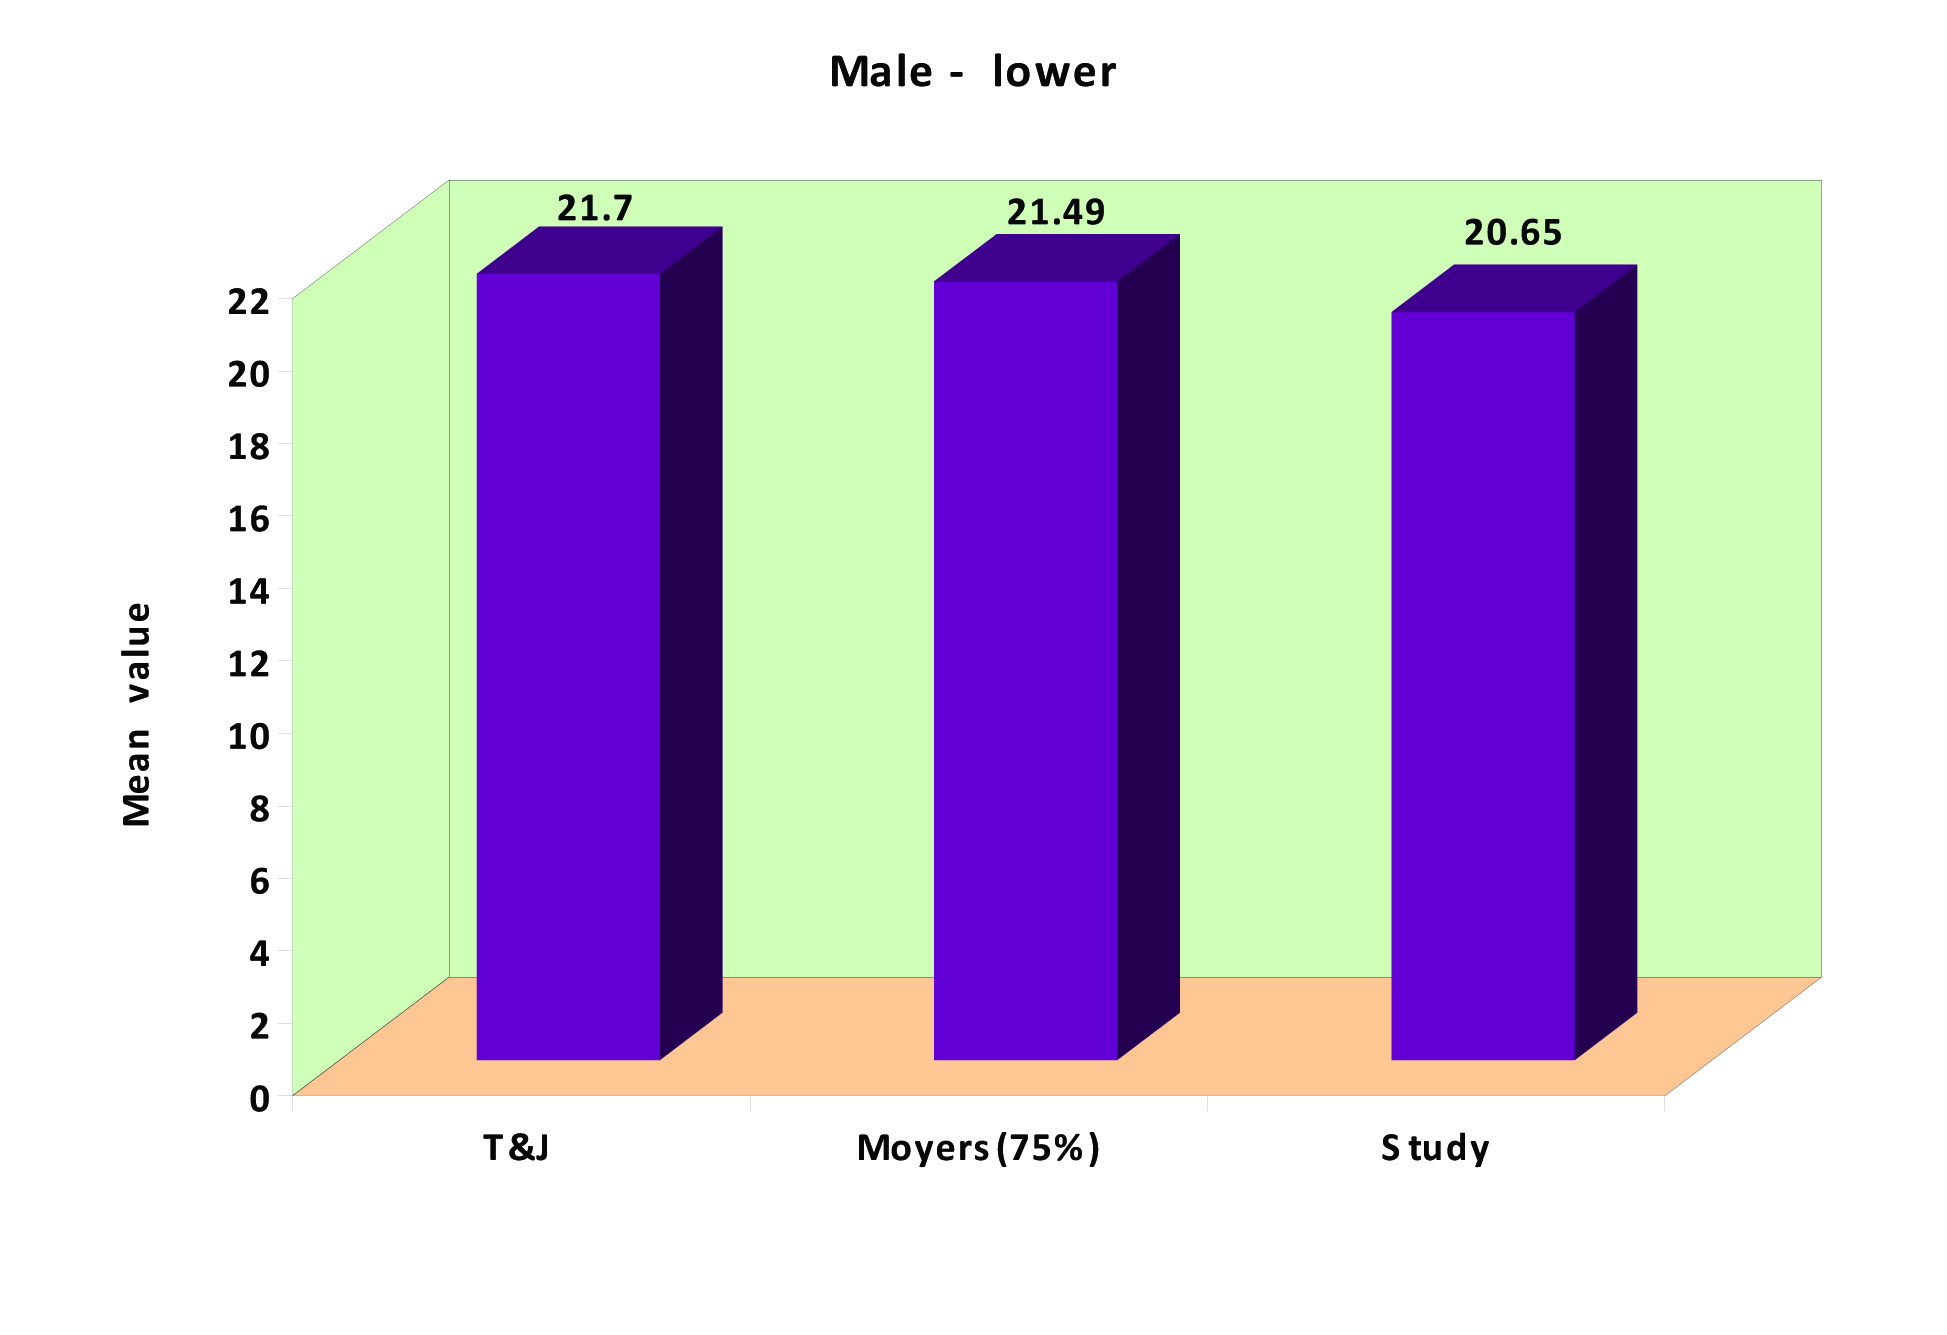
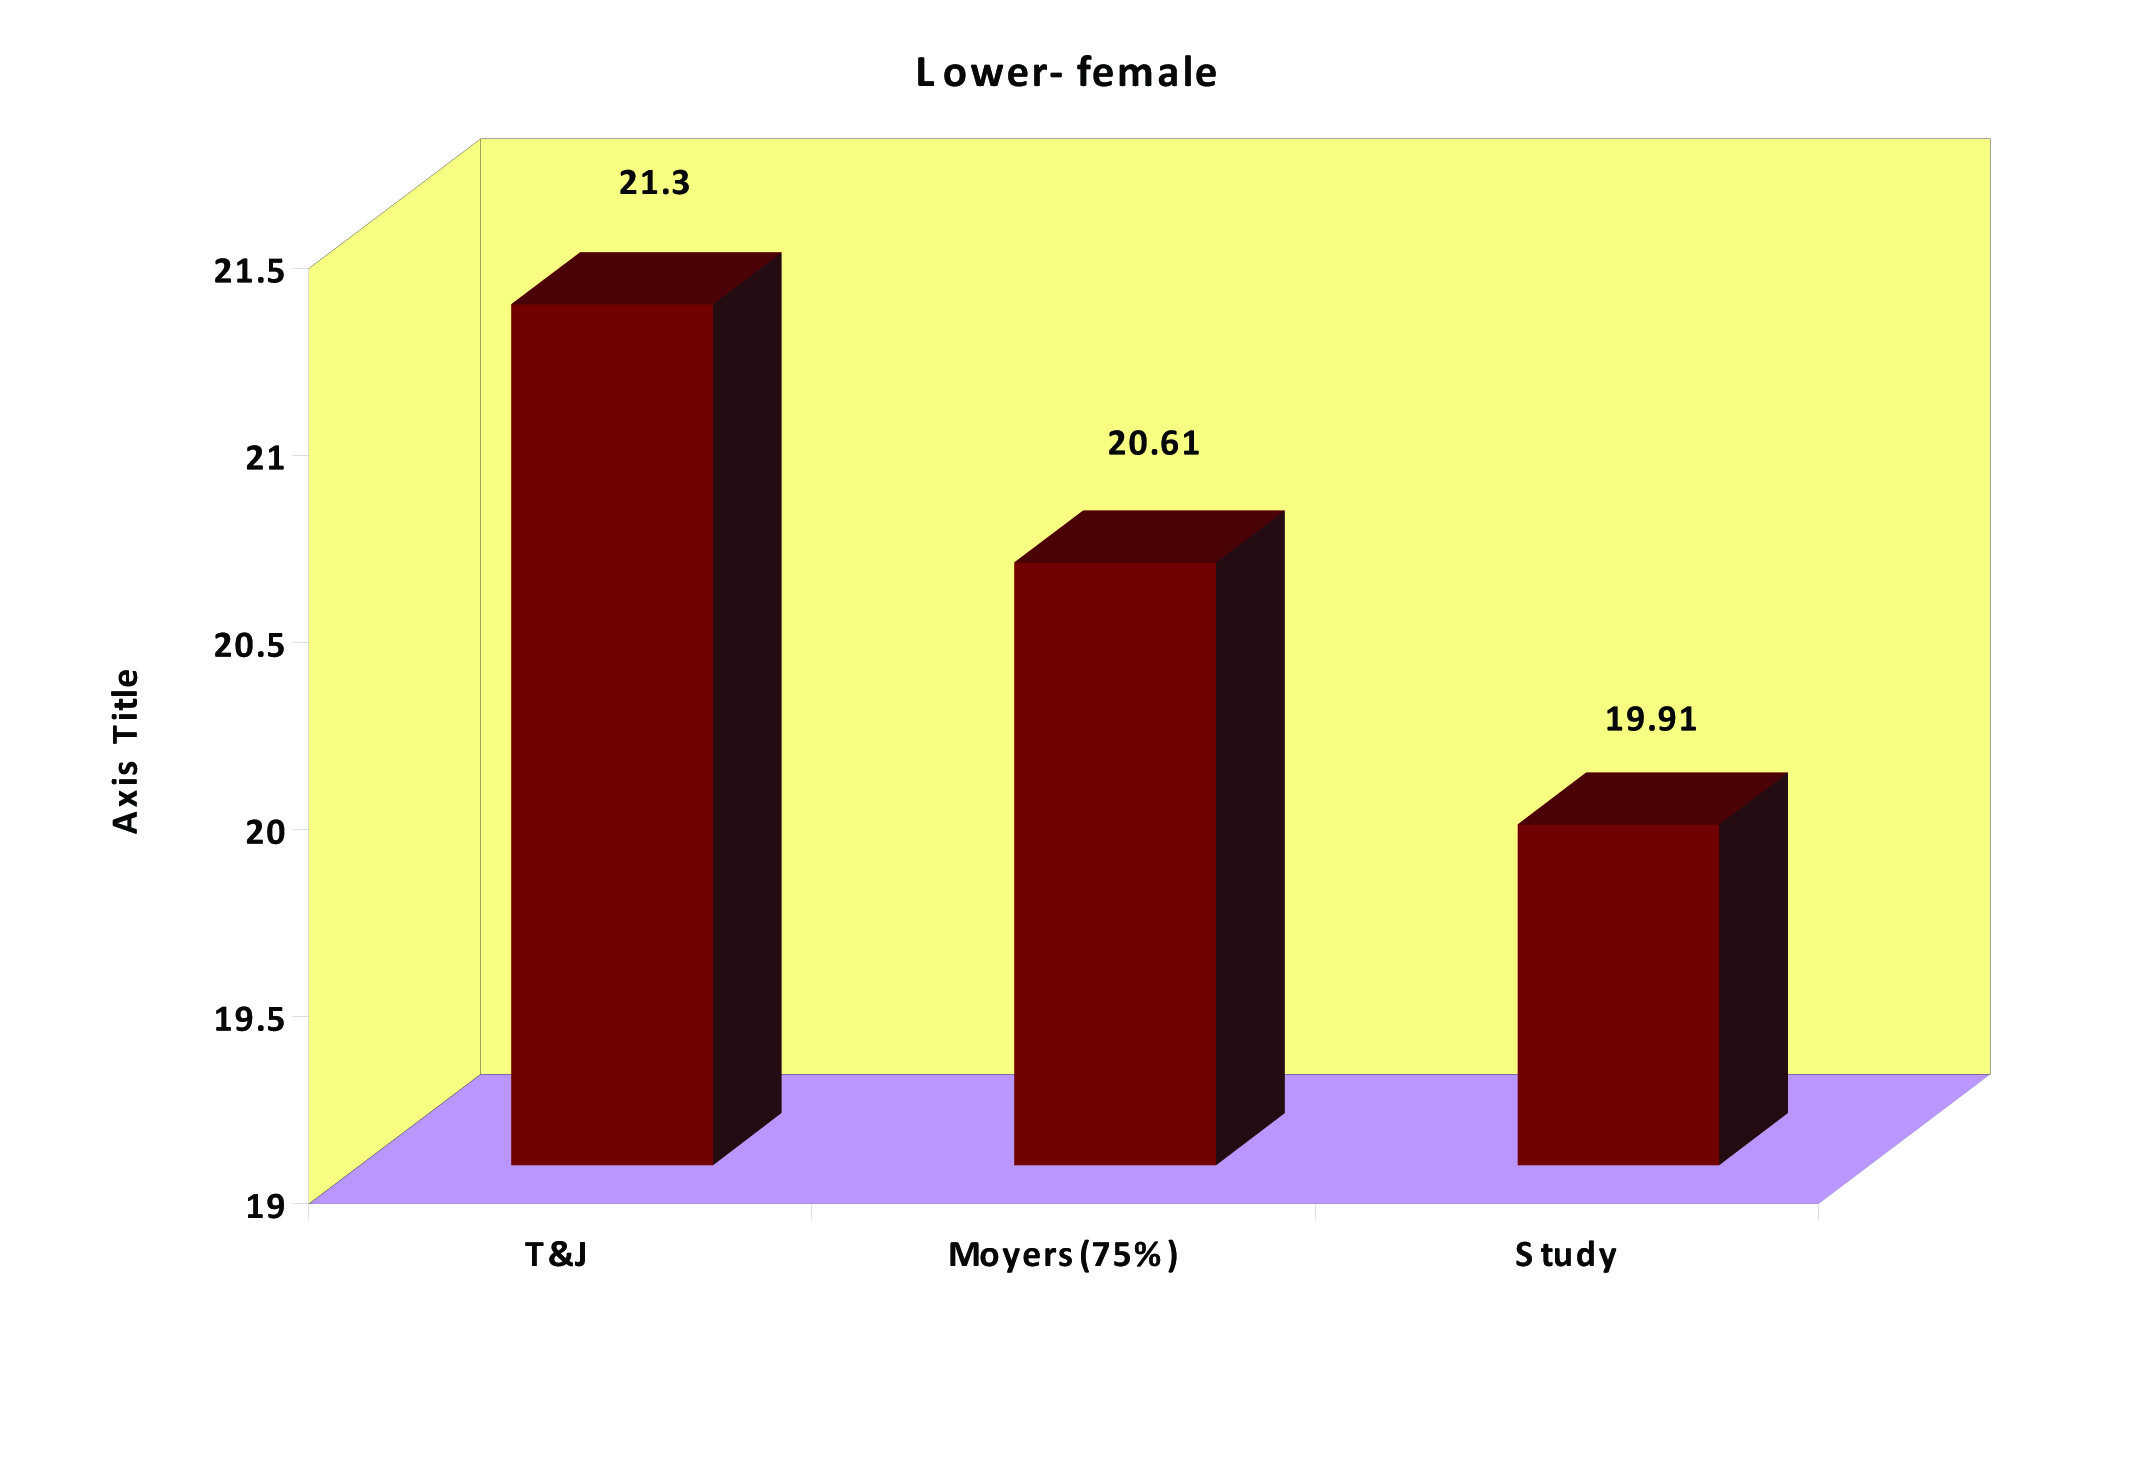
In the mandibular arch, statistically significant differences were observed between the predicted Tanaka and Johnston equations and the actual values (p=0.001). Moyers (75%) also showed statistically significant difference from the measured mesiodistal sum widths of canines and premolars (p=0.001) but was less significant than those predicted by Tanaka and Johnston equations [Table/Fig-5,6].
Comparison of actual measurements and those predicted by Moyers (75%) and Tanaka –Johnston equations in male subjects in the mandibular arch
Comparison of actual measurements and those predicted by Moyers (75%) and Tanaka –Johnston equations in female subjects in the mandibular arch
Considering the mean values for lower incisors, upper and lower canines and premolars, in the maxillary arch, the actual value of canine and premolars were coincident with Moyers 65% probability level in males and 35% probability level in females. In the mandibular arch, the actual measurements of canine and premolars were coincident with the Moyers 50% probability level for both males and females.
The correlation co-efficient between the sum of mandibular incisors and the sum of canine and premolars were 0.46 (for lower arch) and 0.6 (for upper arch) in male subjects, and 0.60 and 0.52 respectively, in female subjects. When both sexes were combined, the co-efficient were, 0.59 for the lower, and 0.58 for the upper arches. Standard error of estimate ranged from 0.68-0.89 [Table/Fig-7]. New probability tables were prepared for male and female Kodava population [Table/Fig-8,9].
Regression parameters for Kodava sample
| Canine premolar segment | Sex | Correlation coefficient (r) | Coefficients of determination (r2) | p-value value | Sth error of estimate (SEE) |
|---|
| A | B |
|---|
| Mandi-bular arch | M | 0.46 | 0.21 | 10.40 | 0.32 | 0.79 |
| F | 0.60 | 0.36 | 9.29 | 0.49 | 0.89 |
| M + F | 0.59 | 0.353 | 10.20 | 0.45 | 0.76 |
| Maxillary arch | M | 0.60 | 0.36 | 12.05 | 0.40 | 0.68 |
| F | 0.52 | 0.28 | 12.56 | 0.37 | 0.83 |
| M + F | 0.58 | 0.34 | 12.25 | 0.39 | 0.75 |
Probability table for predicting the mesiodistal crown diameters of unerupted canine and premolars for males
| Maxillary canine and premolars |
|---|
| £ 21/12 = | 20.0 | 21.0 | 22.0 | 23.0 | 24.0 | 25.0 |
| 95% | 21.28 | 20.71 | 21.89 | 22.13 | 22.76 | 22.96 |
| 85 % | 21.09 | 20.70 | 21.86 | 21.63 | 22.75 | 22.54 |
| 75 % | 20.60 | 20.64 | 21.58 | 21.38 | 22.73 | 22.50 |
| 65% | 0.49 | 20.62 | 21.33 | 21.21 | 22.18 | 22.47 |
| 50 % | 20.32 | 20.82 | 20.95 | 21.10 | 21.36 | 21.92 |
| 35% | 19.55 | 19.78 | 20.54 | 20.76 | 21.32 | 21.56 |
| 25 % | 19.11 | 9.50 | 20.31 | 20.72 | 21.30 | 21.42 |
| 15 % | 19.00 | 9.47 | 20.14 | 20.48 | 21.18 | 21.27 |
| 5 % | 18.84 | 18.95 | 20.13 | 20.33 | 20.98 | 21.12 |
| Mandibular canine and premolars |
|---|
| 95% | 20.36 | 20.47 | 22.23 | 22.96 | 21.59 | 22.46 |
| 85 % | 20.30 | 20.38 | 22.19 | 21.57 | 21.40 | 22.35 |
| 75% | 20.23 | 20.35 | 21.64 | 20.77 | 21.38 | 22.29 |
| 65 % | 20.15 | 20.33 | 21.18 | 20.63 | 21.14 | 22.24 |
| 50% | 20.04 | 19.95 | 20.66 | 20.42 | 20.76 | 21.86 |
| 35% | 19.24 | 19.57 | 20.35 | 20.32 | 20.59 | 21.47 |
| 25% | 18.72 | 19.60 | 20.15 | 20.28 | 20.48 | 21.33 |
| 15 % | 18.67 | 19.53 | 19.82 | 20.06 | 20.45 | 21.20 |
| 5 % | 18.50 | 19.40 | 19.80 | 19.52 | 20.43 | 21.01 |
Probability table for predicting the mesiodistal crown diameters of unerupted canine and premolars for females
| Maxillary canine and premolars |
|---|
| £ 21/12 = | 20.0 | 21.0 | 22.0 | 23.0 | 24.0 |
| 95% | 20.69 | 20.35 | 21.58 | 22.01 | 22.45 |
| 85 % | 20.65 | 20.33 | 21.51 | 21.00 | 22.43 |
| 75 % | 20.50 | 20.28 | 21.21 | 21.56 | 22.50 |
| 65% | 20.41 | 20.14 | 21.33 | 21.11 | 22.00 |
| 50 % | 19.98 | 19.79 | 20.89 | 21.04 | 21.36 |
| 35% | 19.45 | 19.38 | 20.78 | 20.66 | 21.20 |
| 25 % | 19.00 | 19.12 | 20.50 | 20.72 | 20.79 |
| 15 % | 18.68 | 18.99 | 20.10 | 20.38 | 20.45 |
| 5 % | 18.59 | 18.80 | 20.09 | 20.30 | 20.24 |
| Mandibular canine and premolars |
|---|
| 95% | 20.20 | 20.88 | 22.17 | 22.28 | 21.85 |
| 85 % | 20.00 | 20.78 | 21.53 | 21.18 | 21.84 |
| 75% | 19.59 | 20.66 | 21.60 | 20.10 | 21.80 |
| 65 % | 20.15 | 20.22 | 21.46 | 20.89 | 21.49 |
| 50% | 19.40 | 19.41 | 20.17 | 20.65 | 20.97 |
| 35% | 19.10 | 18.63 | 20.03 | 19.95 | 20.49 |
| 25% | 18.21 | 18.25 | 19.81 | 19.80 | 20.18 |
| 15 % | 17.63 | 18.16 | 19.55 | 19.50 | 20.10 |
| 5 % | 17.33 | 18.06 | 19.07 | 19.42 | 20.06 |
Discussion
Definite racial and ethnic differences in tooth sizes have been emphasized in other studies. Most odontometric studies have found that mesiodistal tooth widths to be larger in black populations than in Caucasian ones [12,13]. The mesiodistal crown dimensions of the teeth for men and women from various studies in both the arches are presented in [Table/Fig-10]. Comparison of mean mesiodistal tooth widths in the present study and in other population groups have confirmed that black South Africans have the largest teeth of all groups for both sexes. However, the present sample tend to have smaller combined mesiodistal tooth widths in both sexes than in other population groups compared.
Mesiodistal crown dimensions of the teeth for men and women from various studies
| Study | Sex | Sample | Arch | Mean |
|---|
| Frankel and Benz [13] (black Americans) | M | 39 | LI | 23.06 |
| | UCPM | 22.57 |
| | LCPM | 22.53 |
| F | 41 | LI | 22.94 |
| | UCPM | 21.58 |
| | LCPM | 21.78 |
| Schimer and Wiltshire [17] (south African) | M | 50 | LI | 23.92 |
| | UCPM | 23.45 |
| | LCPM | 23.22 |
| F | 50 | LI | 23.66 |
| | UCPM | 22.20 |
| | LCPM | 22.28 |
| Yuen et al., [20] (Hong Kong Chinese) | M | 51 | LI | 23.15 |
| | UCPM | 22.30 |
| | LCPM | 23.37 |
| F | 46 | LI | 23.28 |
| | UCPM | 21.58 |
| | LCPM | 22.67 |
| Jaroontham and Godfrey [21] (Thai) | M | 215 | LI | 23.89 |
| | UCPM | 23.31 |
| | LCPM | 23.16 |
| F | 215 | LI | 23.23 |
| | UCPM | 21.77 |
| | LCPM | 22.64 |
| Present study (Kodava) | M | 30 | LI | 22.39 |
| | UCPM | 21.00 |
| | LCPM | 20.65 |
| F | 30 | LI | 21.57 |
| | UCPM | 20.68 |
| | LCPM | 19.93 |
Significant sexual dimorphism has also been noted in other studies [8,14]. This is supported by this study where Kodava males presented with statistically significant larger widths of lower incisors, lower canines and premolars than females; however in the maxillary arch, though the combined widths of canines and premolars of males were larger than females, it was statistically insignificant.
In this study, except for the maxillary unerupted canines and premolar in female subjects, the Moyers analysis (75%) and Tanaka and Johnston prediction equations overestimated the actual size for Kodava teeth widths. The results of this study indicated that the currently popular Moyers analysis (75%) and Tanaka and Johnston prediction equations were not sufficiently accurate to predict the mesiodistal widths of unerupted canines and premolars in Kodava population. This conclusion was consistent with other studies that compared Moyers and Tanaka and Johnston prediction equations to populations other than Caucasian American children. According to Al Khadra [15], Moyers chart at the 75th percentile and Tanaka Johnston equations overestimated the size of buccal segments in a Saudi Arab population. Similar results were obtained by Diagne et al., [16] on Senegalese population where the Tanaka and Johnston equations overestimated the actual values. In contrast Schimer and Wiltshire [17] concluded that Moyers prediction tables underestimated black South African tooth size. Buwembo et al.,[18] conducted a study on Ugandan population and concluded that Moyers probability tables could be used to predict tooth widths at specific percentile probabilities, but Tanaka and Johnston technique tends to overestimate the tooth widths.
When the mean values of lower incisors, upper and lower canines and premolars were considered, the present study showed that actual value for upper canines and premolars were coincident with the Moyers 65% probability level for males and 35% probability level for females, and the actual values of lower canines and premolar measurements for both males and females was coincident with the Moyers 50% probability. In contrast Rani and Goel [19], when applying Moyers prediction tables to a section of the south Indian population found it to be more applicable at the 35% level, instead of 75% as observed by Moyers for his sample. Ivan Philip et al.,[20] concluded that the Moyer’s probability tables significantly underestimated the canine and premolar mesiodistal width of contemporary Indian children.
This difference can be explained by the difference in the racial origins of the sample between these studies and the sample of Moyer’s and Tanaka and Johnston. It was therefore inevitable to derive regression equations and coefficients of correlation between the combined mesiodistal widths of four permanent mandibular incisors and the combined widths of canines and premolars for Kodavas. Data from this study were used to generate statistically significant regression equations that can be used in prediction of unerupted canines and premolar widths for the Kodava children. Estimated equations for both males and females combined:
Maxillary Y = 12.25 + 0.39 (X)
Mandibular Y = 10.20 + 0.45 (X)
Estimated equations for males:
maxillary Y = 12.05 + 0.40 (X)
Mandibular Y = 10.40 + 0.32 (X)
Estimated equations for females:
maxillary Y = 12.56 +0.37 (X)
mandibular Y= 9.29 + 0.49 (X)
The correlation coefficient (r) of the present study ranged from 0.46 - 0.60 with the highest correlation for male subjects in the maxillary arch and female subjects in the mandibular arch and least correlation coefficient for male subjects in the mandibular arch (standard error 0.68 - 0.89). The regression coefficients calculated in the present study slightly differed from those published by Tanaka and Johnston. The interpretation of the Kodava subjects indicated that the mandibular incisors demonstrated a slightly lower correlation, r= 0.58 (Tanaka –Johnston r=0.62) and r=0.59 (Tanaka – Johnston r= 0.65) for maxillary and mandibular buccal segments. The correlation coefficients for the Kodavas between the buccal segments of each arch were found to be smaller than for Hong Kong Chinese [21] in both sexes but higher than for Thai boys [22] in the maxillary buccal segments and for black Senegalese girls [14] in the mandibular buccal segments [Table/Fig-11]. Differences in coefficient values between the various ethnic studies illustrate tooth size variability between different ethnic groups. Some investigators have shown that the use of both sexes together is possible without the impairment of the results in the correlations between the sizes of teeth. Gardner [23] However, it is quite clear from the results of most odontometric studies that sex dimorphism does exist in mesiodistal widths of permanent teeth. Sex dimorphism is also demonstrated in the present study.
Regression parameters for buccal segment widths from various investigations
| study | Sex | Arch | r | a | b | SEE | r2 |
|---|
| Diagne et al[16] (black Senegalese) | M F M + F | Maxilla | 0.68 | 9.60 | 0.55 | 0.74 | 0.46 |
| Mandible | 0.73 | 5.45 | 0.72 | 0.82 | 0.54 |
| Maxilla | 0.51 | 13.77 | 0.35 | 0.66 | 0.26 |
| Mandible | 0.63 | 8.74 | 0.56 | 0.76 | 0.40 |
| Maxilla | 0.68 | 9.87 | 0.53 | 0.71 | 0.46 |
| Mandible | 0.73 | 5.67 | 0.70 | 0.81 | 0.54 |
| Yuen et al[20] (Hong Kong Chinese) | M F M + F | Maxilla | 0.79 | 7.97 | 0.66 | 0.68 | 0.62 |
| Mandible | 0.77 | 8.82 | 0.58 | 0.61 | 0.60 |
| Maxilla | 0.65 | 8.30 | 0.61 | 0.81 | 0.42 |
| Mandible | 0.69 | 6.66 | 0.64 | 0.82 | 0.47 |
| Maxilla | 0.60 | 11.87 | 0.47 | 0.84 | 0.36 |
| Mandible | 0.64 | 10.30 | 0.50 | 0.82 | 0.41 |
| Jaroontham and Godfrey[21] (Thai) | M F M + F | Maxilla | 0.54 | 13.36 | 0.41 | 0.88 | 0.29 |
| Mandible | 0.58 | 11.92 | 0.43 | 0.85 | 0.34 |
| Maxilla | 0.62 | 11.16 | 0.49 | 0.78 | 0.39 |
| Mandible | 0.65 | 9.49 | 0.53 | 0.78 | 0.42 |
| Maxilla | 0.60 | 11.87 | 0.47 | 0.84 | 0.36 |
| Mandible | 0.64 | 10.30 | 0.50 | 0.82 | 0.41 |
| Present study (Kodava) | M F M + F | Maxilla | 0.60 | 12.05 | 0.40 | 0.68 | 0.36 |
| Mandible | 0.46 | 10.40 | 0.32 | 0.79 | 0.21 |
| Maxilla | 0.52 | 12.56 | 0.37 | 0.83 | 0.28 |
| Mandible | 0.60 | 9.29 | 0.49 | 0.89 | 0.36 |
| Maxilla | 0.58 | 12.25 | 0.39 | 0.75 | 0.34 |
| Mandible | 0.59 | 10.20 | 0.45 | 0.86 | 0.35 |
Limitations
Further evaluation of the new prediction tables should be done particularly to establish prediction error when applied to large groups of Kodava subjects. A larger sample size could lead to the formulation of even more accurate and applicable probability tables for the Kodava population.
Conclusion
The commonly used Tanaka and Johnston and Moyers (75%) prediction methods were not as accurate when applied to our sample of Kodava population since it tends to overestimate the actual measurements. New regression equations for the Kodava population were formulated for predicting the mesiodistal widths of unerupted canines and premolar segments for males and females separately.
The prediction tables formulated, based on the data from Kodava community, should be accurate when applied to local children, despite the ethnic diversity of Kodava.