The mandible is a key component of oropharyngeal function and facial appearance. Segmental resection of mandible may be indicated for oncological or other reasons and it can lead to significant morbidity, Loss of continuity of the mandible destroys the balance of the lower face and leads to decreased mandibular function by deviation of the residual segment toward the surgical site. When reconstructing such mandibles it is desirable to restore not only the contour, but also the masticatory function [1].
The use of free revascularized flaps has become a valuable means for the rehabilitation of these patients, despite unfavourable local conditions such as large defects, irradiation and lack of adequate quantity of surrounding soft tissues. The bone segmented can be transplanted with muscle and skin pad that allows simultaneous reconstruction of both hard and soft tissues, with considerable improvement of facial contour and oral functions such as speech and deglutition. Further, placing dental implants in the reconstructed areas helps to overcome problems related to the dental rehabilitation with removable prostheses [2,3].
Various donor sites provide vascularized bone and soft tissue for maxillo-mandibular reconstruction; the Fibula-free flap has demonstrated high reliability and adaptability for the reconstruction of maxilla-mandibular defects, due to its length (up to 25-27cm), its vascular pedicle, and its ability to be bent in order to follow the shape of the interrupted mandible or maxilla. It can be used as osteomuscular flap or osteomyocutaneous flap, providing the possibility of simultaneous reconstruction of deficient soft tissues on the intra oral side (cheek mucosa, palate, floor of the mouth, etc.). Moreover, fibular bone presents favourable conditions for implant placement and subsequent implant supported prosthetic rehabilitation, due to its diameter and the good quality of its cortical bone [1,2]. Implants are now routinely used to re-establish mastication in reconstructed mandible. However, the difference in height between the native mandible and reconstructed mandible leads to a vertical discrepancy and altered biomechanics while planning restorations. There may be an excess of soft tissue around the implants leading to frequent hyperplasia. Several studies have reported methods to minimize stress around implants in edentulous mandible, there is very little information regarding stress around implants in reconstructed mandible.
The purpose of this study was to evaluate, investigate and compare the effect of vertical and horizontal loads on the stresses around the implants supporting a fixed prosthesis in various reconstructed mandibles and in normal human mandible using the finite element method.
Finite element analysis (FEA) is commonly used for stress analysis of non-rigid bodies. The area of interest, the model (an implant and a part of normal and fibula reconstructed in this particular situation), is split into a mesh of elements. Physical properties are defined with each element. Boundary conditions (restrictions to physical properties stemming from the actual physical behaviour of the patient) are applied to outer models elements. The requested property, stress for example is investigated with in each element of the model. It is a computer- based method used to calculate and visually represent stresses and strains in complex structures subjected to simulated loads [4,5]. Three-dimensional finite element stress analysis has been extensively used to study the biomechanics of dental implants and offers many advantages over other methods [6–8].
In this study, FEA was used to analyse the stress around similar implants placed in identical locations in normal and reconstructed mandibular models. The difference between both models being the bone quality, quantity and the height of the abutments used.
Materials and Methods
Geometric Modeling
CT scanning of a normal human edentulous mandible was performed. Using 3D doctor software (Able software V4.0) a 3D model in STL format was generated and meshing of this model was done using Hypermesh software (version 12.3). On generating the 3D STL model format it was imported to Hypermesh software and a surface was created from available triangulated mesh data ,further solid (volume) for the same surface was created on which 3D tetra mesh was generated [Table/Fig-1].
Mesh structure [type I - type IV] Model A&B
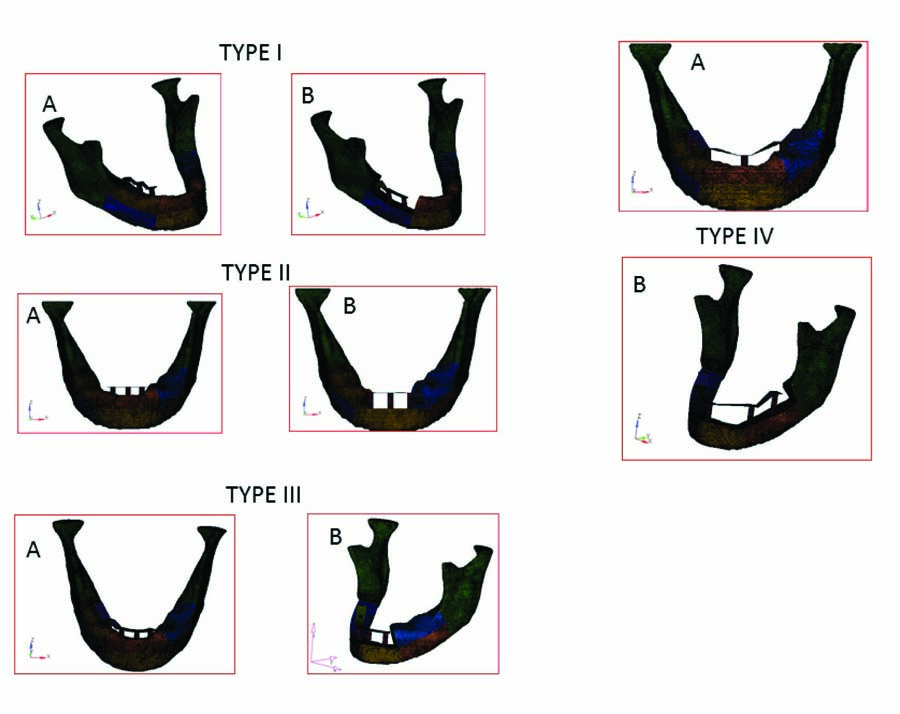
The construction of the fibular model was carried out in the same fashion. The average cortical thickness of the mandible and fibula were 2.5 and 1.5mm respectively. With these models, several types of reconstructed mandibles with different degrees of excision were designed based on the classification of defects by Franz-Josef Kramer et al., [9] according to the number of osteotomies of the fibula bone used in reconstruction these were as follows:
Type 1: Body alone reconstructed.
Type 2: Central segment alone reconstructed.
Type 3: Body and central segment reconstructed.
Type 4: Bilateral bodies including central segment reconstructed.
Material Properties and Meshing
All the materials used in the models were considered as homogenous, isotropic, and linearly elastic. The corresponding elastic properties such as young’s modulus (E) and Poisson ratio (μ) were determined from the literature [10] and are summarized in [Table/Fig-2]. All interfaces between the materials were assumed to be bonded or osseo integrated. Each model was divided into 25000 – 32000 small elements. Especially, for the regions around the fixtures, finer equal sized elements were selected to upgrade the accuracy of analysis. A superstructure representing the framework of abutment-supported fixed prosthesis was also constructed. Co-Cr was used as superstructure material. In previous literature [10] it was stated that Co-Cr alloy reduced the maximal and effective stress. The loading condition, implant location and supra structure was similar in both the models and the difference being length of the abutment which is 5mm in normal model and 12 mm in reconstructed model.
Material properties assigned to different material compounds of finite element model
| Material | Young’s Modulus(E) (Gpa) | Poisson’s ratio |
|---|
| Titanium (Abutment, Implant) | 117 | 0.35 |
| Cortical bone | 1.37 | 0.3 |
| Cancellous bone | 13.7 | 0.3 |
| CoCr alloy framework | 218 | 0.33 |
| Total | 1161 | 635 |
Boundary and Loading Conditions
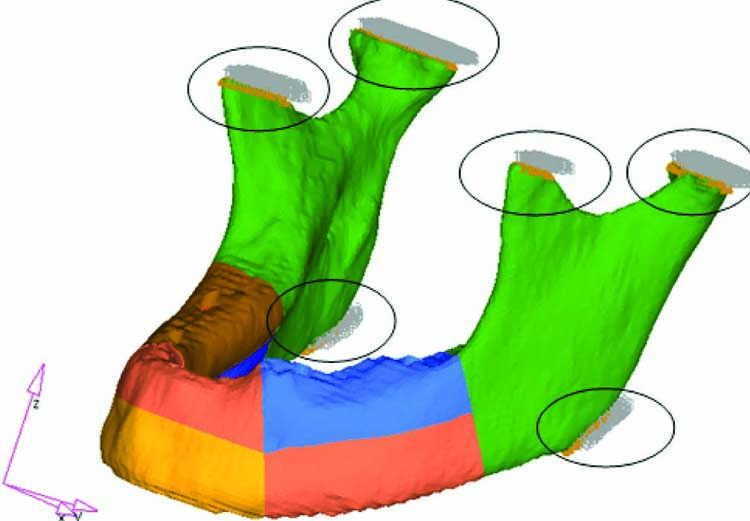
In previous studies, the masticatory load working on the molar region was reported to be 75–300 N [11–13], a vertical load of 200N and horizontal load of 50N was therefore adopted as the masticatory force and was applied to both the pontic and abutment portion of the superstructure. Six regions of the mandible were designated as fixed regions with zero displacement [Table/Fig-3]. These were condylar processes, the coronoid processes, and the mandibular angles to which masticatory muscles were attached. The whole modelling and solution processes were performed using Analysis - Solver - Optistruct software program.
Fixed in degrees of freedom
Results
Principal stresses and Von Mises stress have been used equally for interpreting the results of stress analysis. Von Mises stress values are defined as the beginning of deformation for ductile materials such as metallic implants. Since failure occurs when Von Mises stress values exceed the yield strength of an implant material, Von Mises stress criteria are important for interpreting the stresses occurring within the implant material [10].
The numerical analysis results are shown for Von Mises stresses occurring in the cortical bone around the cervical region of implants in four different situations in reconstructed models and their respective reference normal mandibles. A total of eight models were evaluated for von mises stresses after a Vertical loading of 200 N and Horizontal loading of 50N.
Type I
Model A: Normal Mandible (reference).
Model B: Right body reconstructed.
Implant location: 43, 45 and 47.
Vertical loading
The Von Mises stress was increased only in 45 region by 26% however, in the regions 43 and 47 the stresses were decreased by 20.9% and 45% respectively in the reconstructed mandible [Table/Fig-4,5].
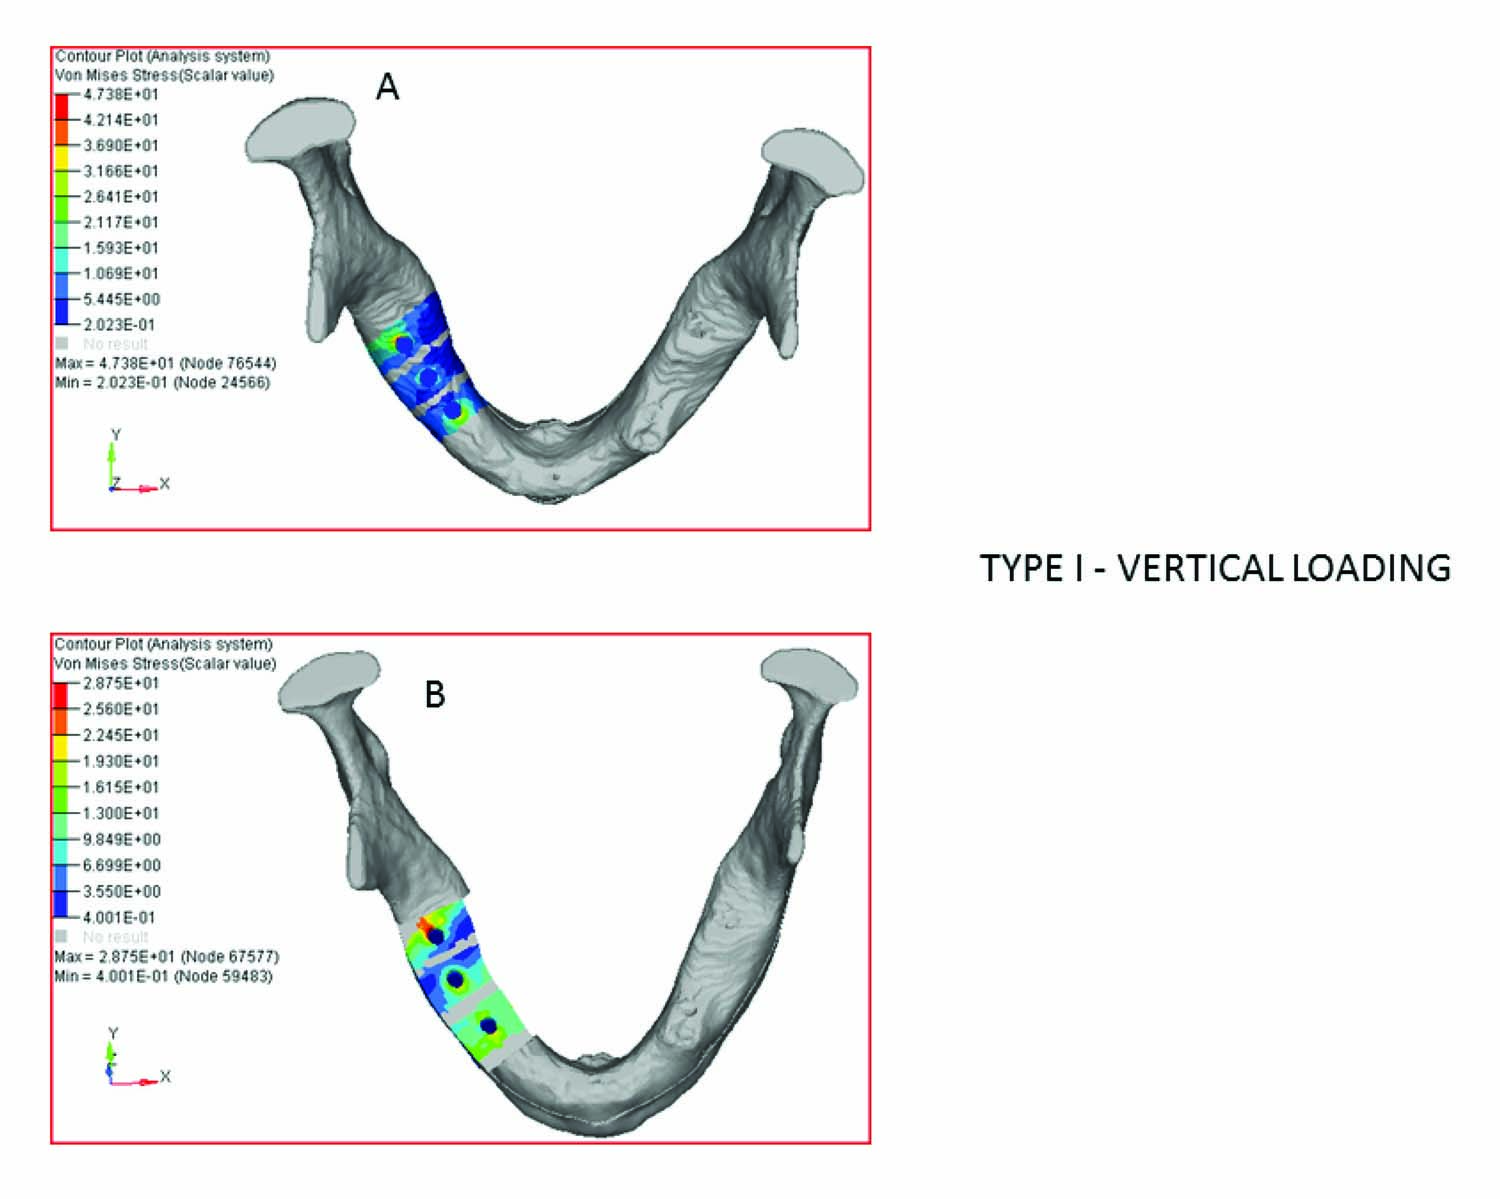
Type I - vertical loading
| Implant Location | Model A (Normal mandible). Von mises Stress values in MPa | Model B (Body alone Reconstructed)Von Mises Stress Values in MPa | Difference in stress (%) |
|---|
| 43 | 36.4 | 28.8 | 20.87 % |
| 45 | 15.4 | 20.6 | 26 % |
| 47 | 37.4 | 20.4 | 45 % |
| Mean | 29.73 | 23.26 | 21.74 % |
Horizontal loading
The Von Mises stress on horizontal loading in this case was relatively higher in reconstructed mandible by a mean difference of 25.1% [Table/Fig-6,7].
Type I –horizontal loading
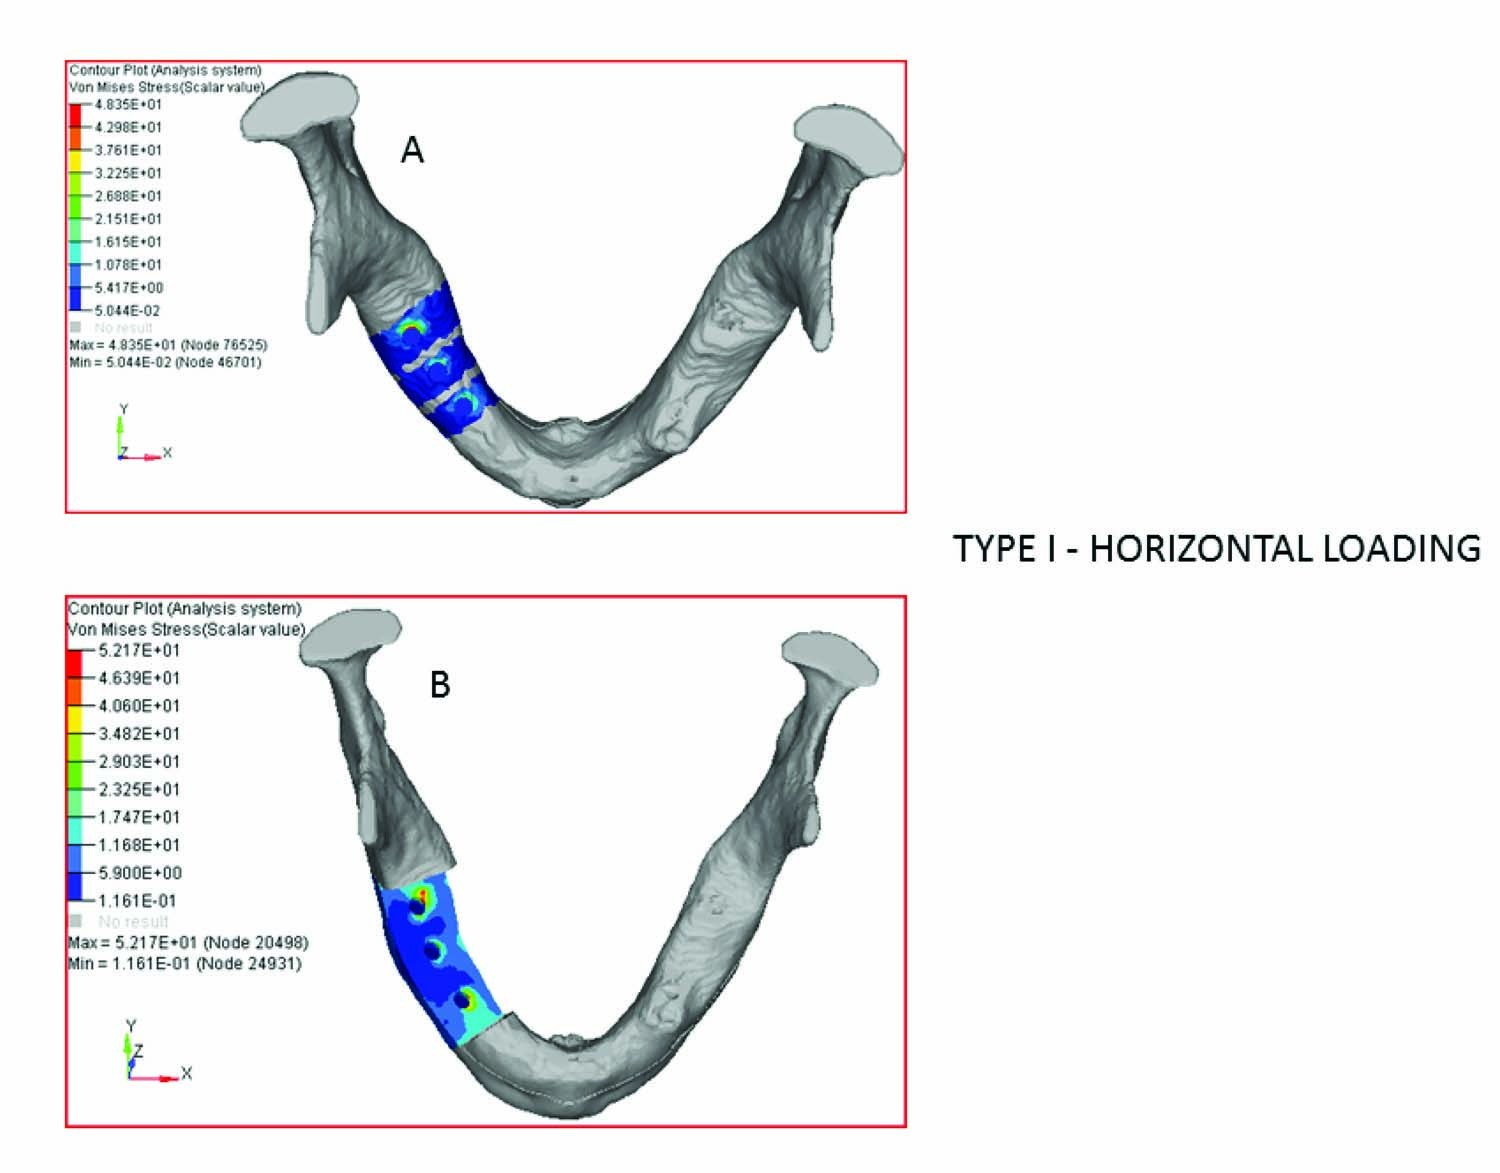
Type I - horizontal loading
| Implant Location | Model A (Normal mandible). Von mises Stress values in MPa | Model B (Body alone Reconstructed)Von Mises Stress Values in MPa | Difference in stress (%) |
|---|
| 43 region | 21 | 45.1 | 53 % |
| 45 region | 24 | 28 | 14.3% |
| 47 region | 48.4 | 52.2 | 7% |
| Mean | 31.3 | 41.8 | 25.1 % |
Type II
Model A: Normal Mandible (reference).
Model B: Central segment alone reconstructed.
Implant location: 33, 31 and 43.
Vertical loading
The Von mises stress on vertical loading was decreased by a mean difference of 29.9 % [Table/Fig-8,9].
Type II –vertical loading
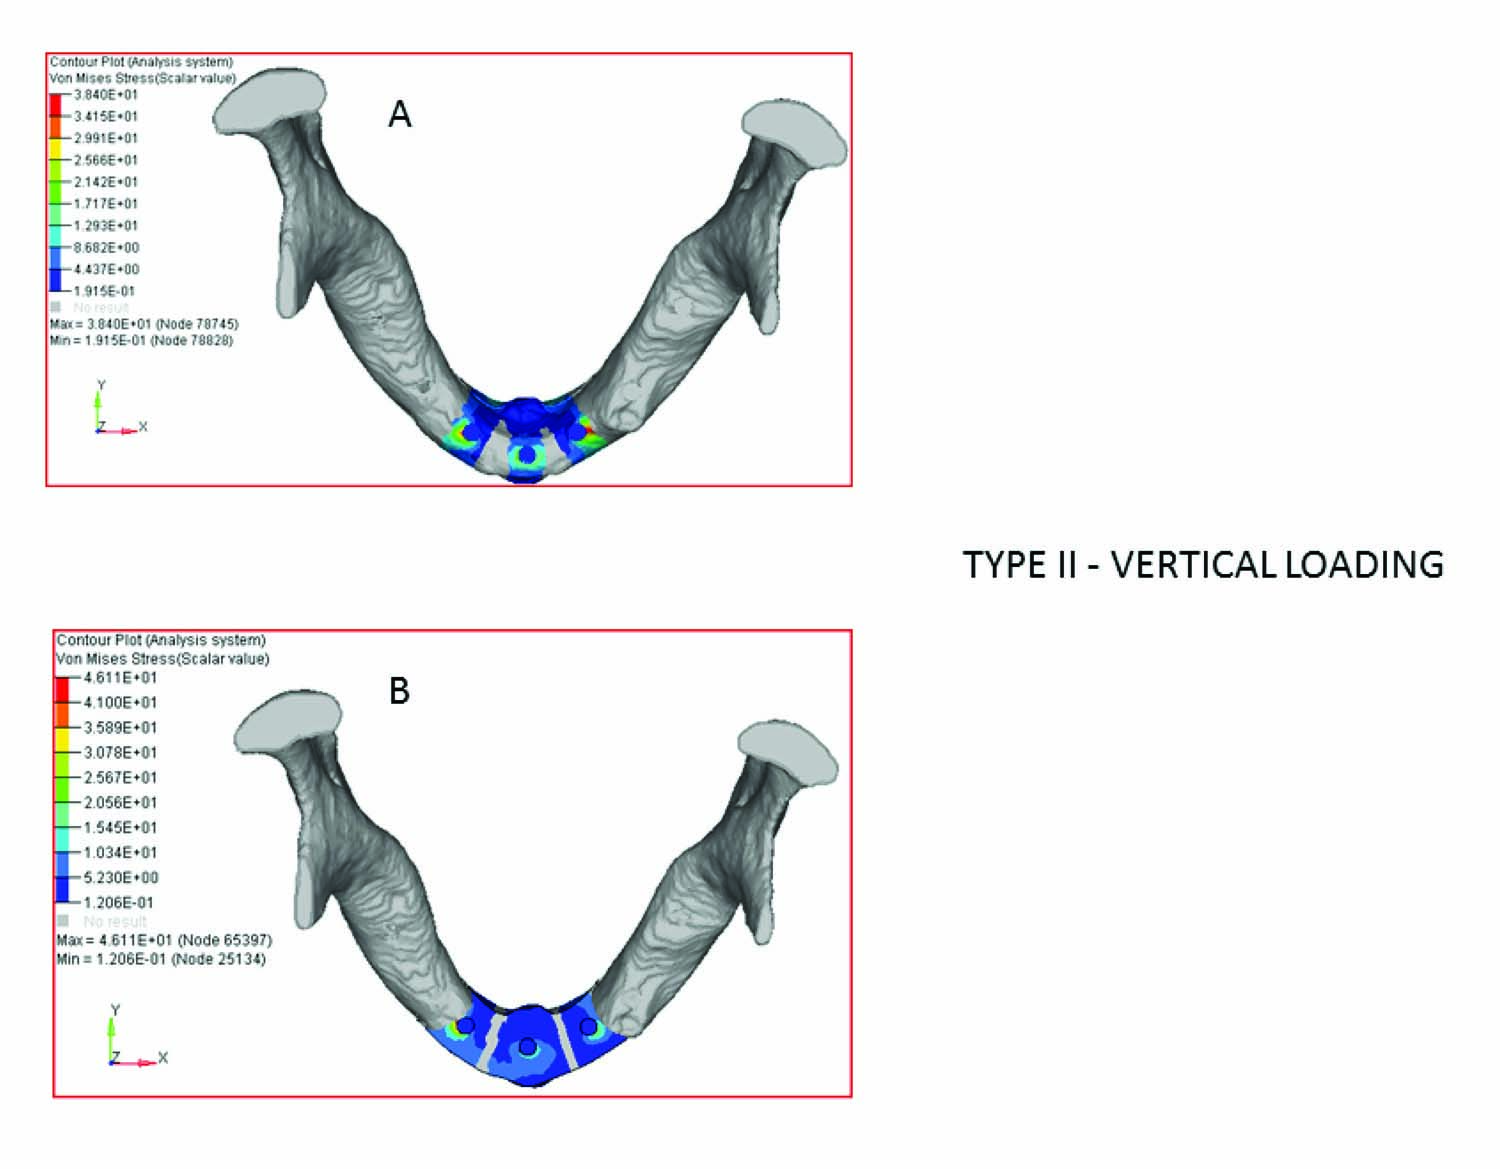
Type II – vertical loading
| Implant Location | Model A (Normal Mandible). Von mises Stress values in MPa | Model B (Body alone Reconstructed)Von Mises Stress Values in MPa | Difference in stress (%) |
|---|
| 33 | 38.4 | 22.0 | 42.7% |
| 31 | 21.2 | 16.5 | 22 % |
| 43 | 35.0 | 28.0 | 20 % |
| Mean | 31.53 | 22.1 | 29.9 % |
Horizontal loading
The Von Mises stress on horizontal loading in this case was higher by a mean difference of 15.5 % in reconstructed mandible [Table/Fig-10,11].
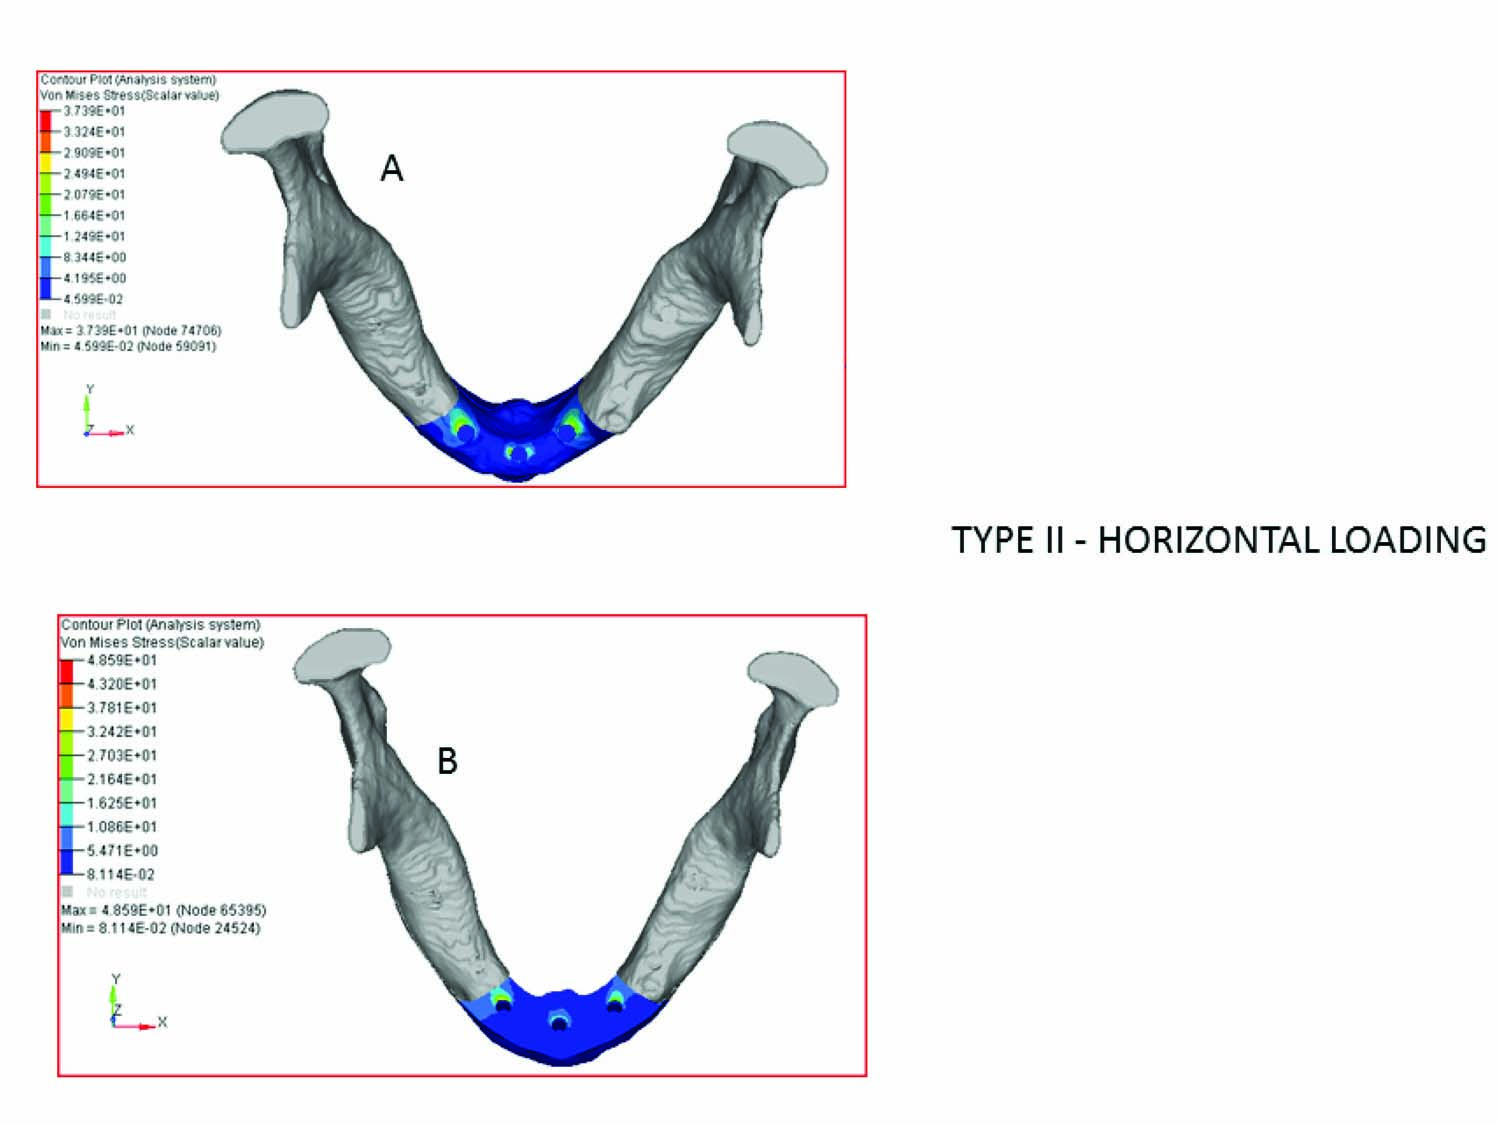
Type II – horizontal loading
| Implant Location | Model A (Normal mandible). Von mises Stress values in MPa | Model B (Body alone Reconstructed)Von Mises Stress Values in MPa | Difference in stress (%) |
|---|
| 33 region | 37 | 37.5 | 1.3% |
| 31 region | 21 | 24 | 12.5% |
| 43 region | 35 | 48.6 | 28% |
| Mean | 31 | 36.7 | 15.5% |
Type III
Model A: Normal Mandible (reference).
Model B: Right body reconstructed and Central segment reconstructed.
Implant location: 33, 31, 43, 45 and 47.
Vertical Loading
The Von mises stress on vertical loading in this case was higher by mean difference of 34.64 % in reconstructed mandible [Table/Fig-12,13].
Type III –vertical loading
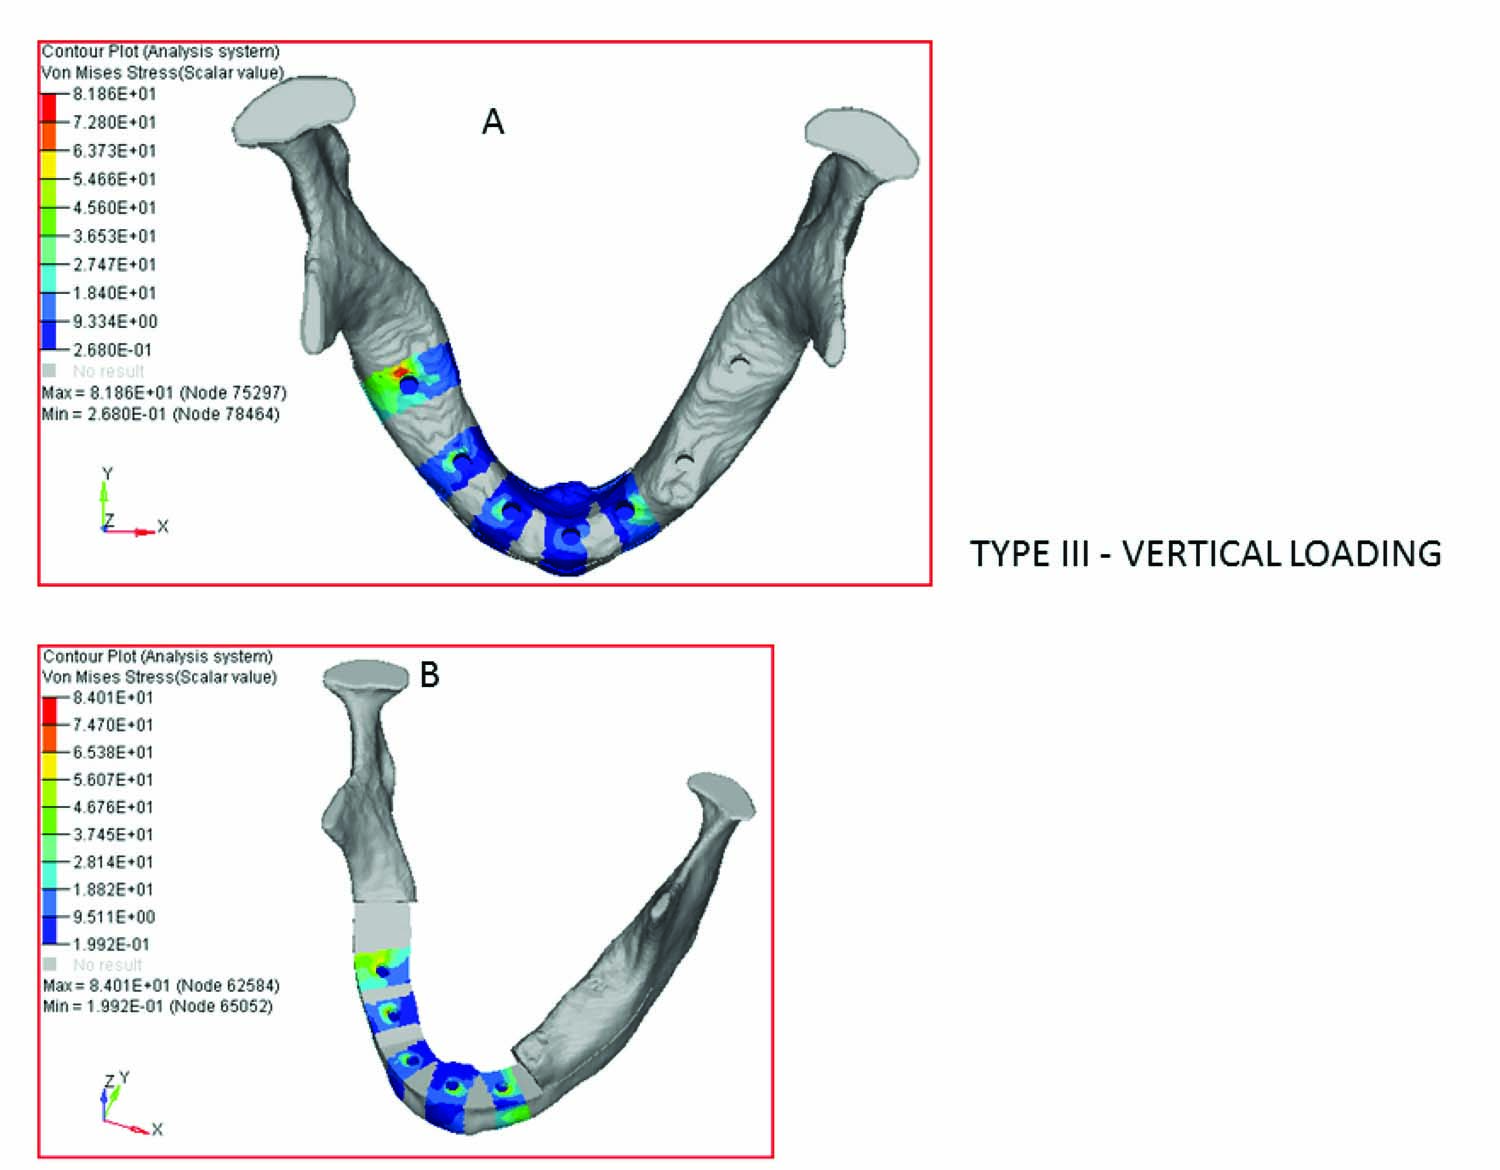
Type III – vertical loading
| Implant Location | Model A (Normal Mandible). Von mises Stress values in MPa | Model B (Body alone Reconstructed)Von Mises Stress Values in MPa | Difference in stress (%) |
|---|
| 33 | 46.2 | 68.4 | 32.5 % |
| 31 | 22.1 | 60.6 | 63.5 % |
| 43 | 38.1 | 43.0 | 11.4 % |
| 45 | 54.3 | 84.0 | 35.4% |
| 47 | 60.1 | 81.8 | 26.5% |
| Mean | 44.16 | 67.56 | 34.64 % |
Horizontal Loading
The Von mises stress on horizontal loading in this case was higher by a mean difference of 11.8 % in reconstructed mandible [Table/Fig-14,15].
Type III –horizontal loading
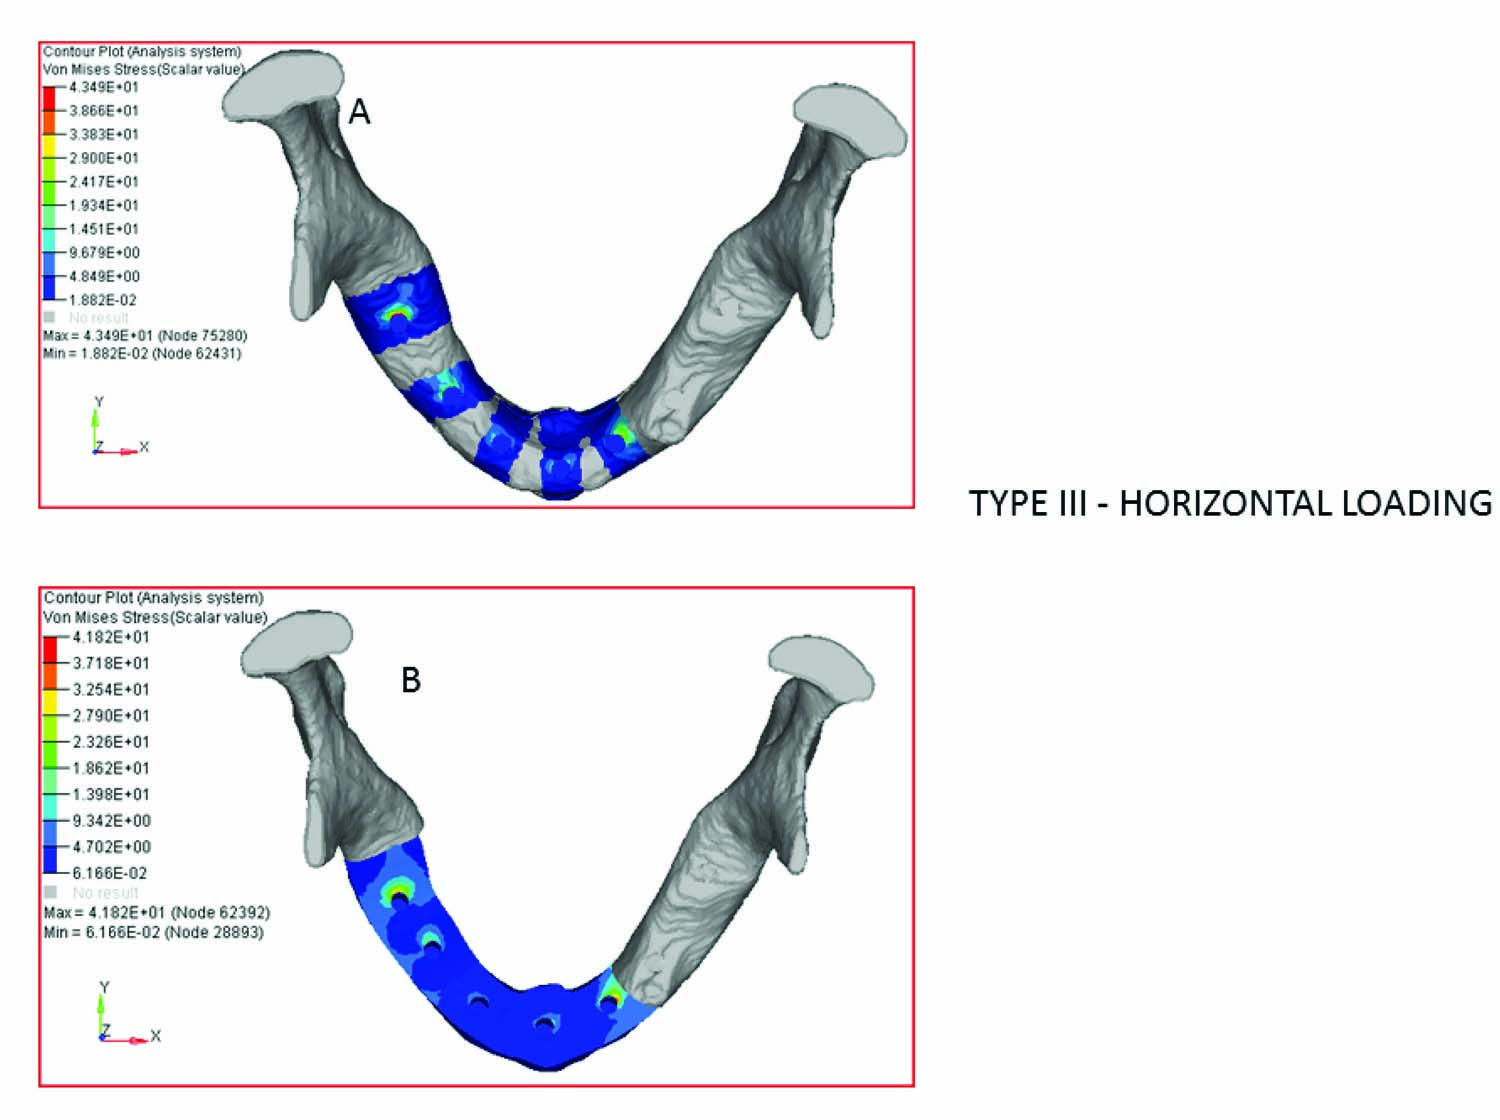
Type III - horizontal loading
| Implant Location | Model A (Normal Mandible). Von mises Stress values in MPa | Model B (Body alone Reconstructed)Von Mises Stress Values in MPa | Difference in stress (%) |
|---|
| 33 region | 29.2 | 41.8 | 30% |
| 31 region | 15.9 | 12 | 25% |
| 43 region | 8.6 | 12.0 | 28% |
| 45 region | 19.1 | 25.8 | 26% |
| 47 region | 43.5 | 40.3 | 7% |
| Mean | 23.26 | 26.38 | 11.8% |
Type IV
Model A: Normal Mandible (reference).
Model B: Bilateral bodies including central segment reconstructed
Implant location: 36, 33, 31, 43, and 46.
Vertical loading
The Von mises stress on vertical loading in this case was higher by a mean difference of 32.6% in reconstructed mandible [Table/Fig-16,17].
Type IV –vertical loading
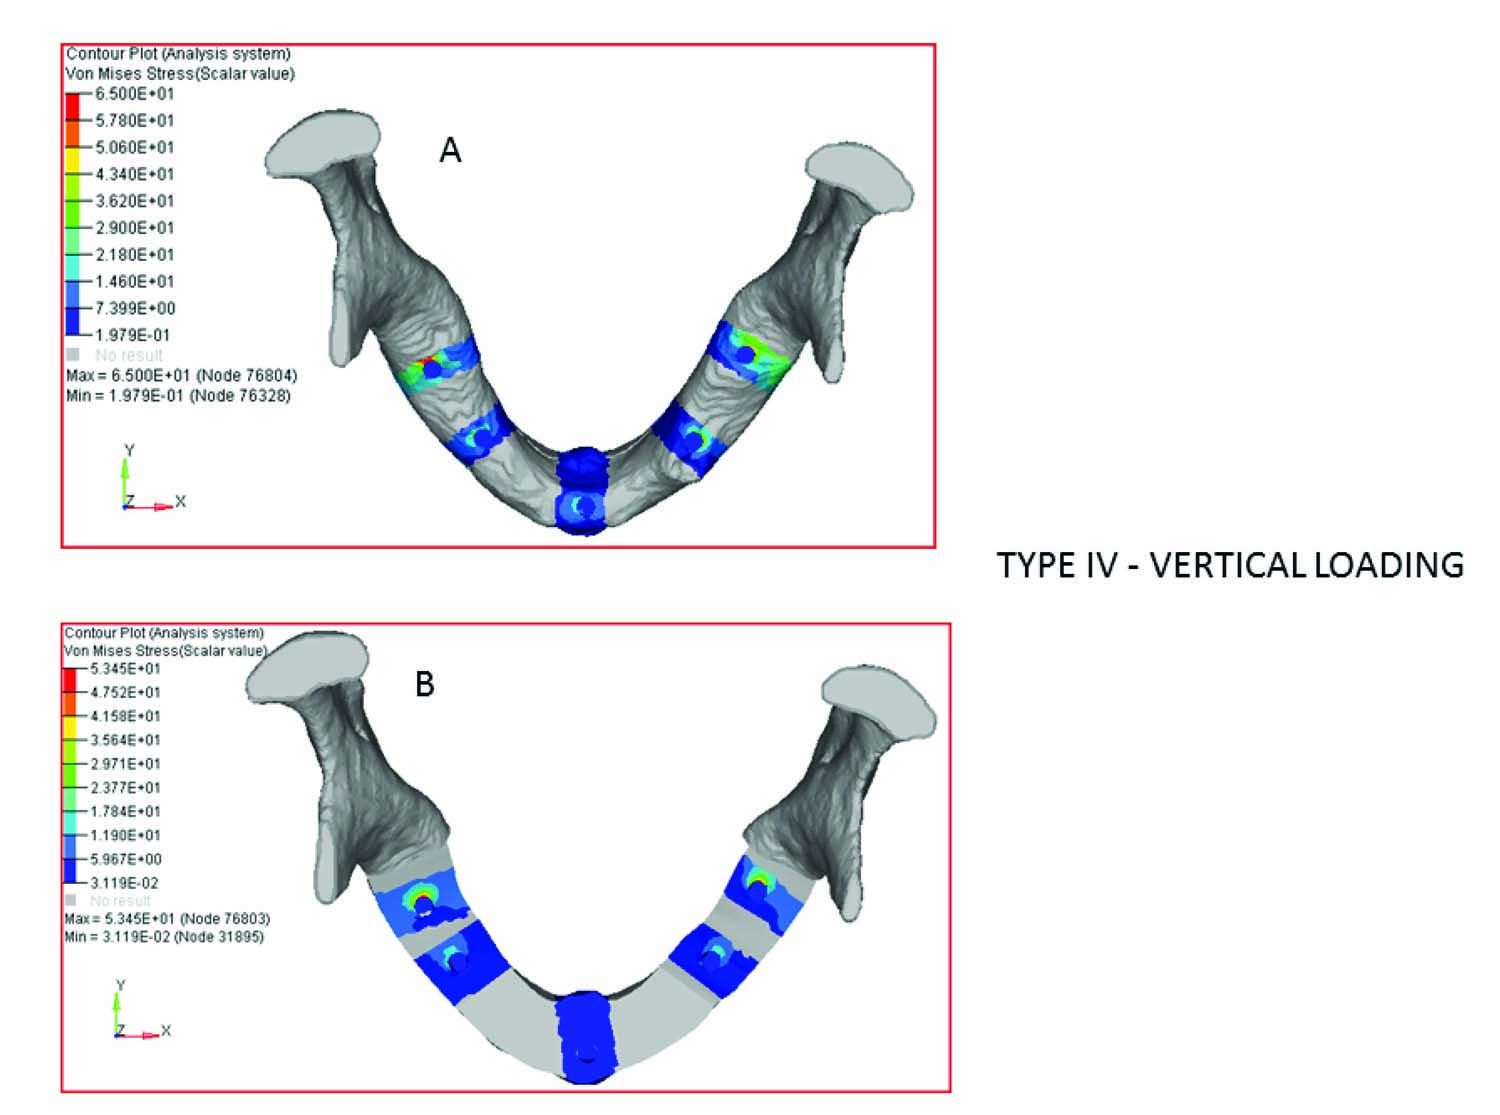
Type IV – vertical loading
| Implant Location | Model A (Normal Mandible). Von mises Stress values in MPa | Model B (Body alone Reconstructed)Von Mises Stress Values in MPa | Difference in stress (%) |
|---|
| 36 | 49.5 | 74.2 | 33.3 % |
| 33 | 38.5 | 69.8 | 45% |
| 31 | 29.2 | 28.2 | 3.4% |
| 43 | 37.5 | 65.5 | 43% |
| 46 | 65 | 88.7 | 27% |
| Mean | 44 | 65.28 | 32.6 % |
Horizontal loading
The Von mises stress on vertical Horizontal loading in this case was higher by a mean difference of 25.9 % in reconstructed mandible [Table/Fig-18,19].
Type IV –horizontal loading
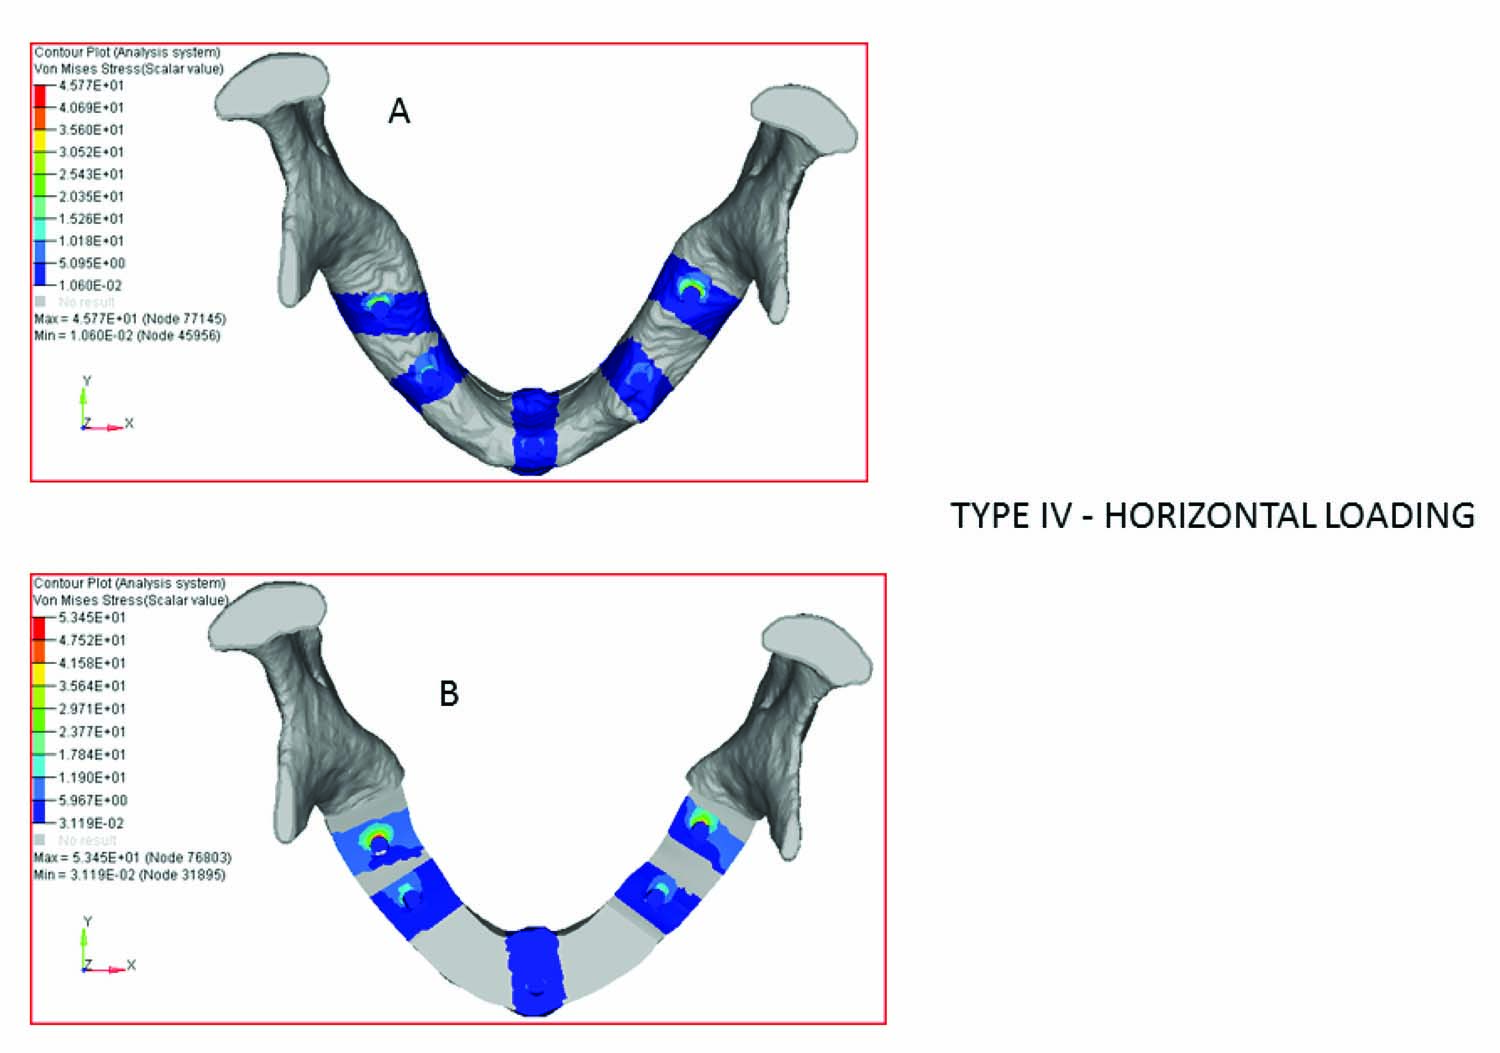
Type IV – horizontal loading
| Implant Location | Model A (Normal Mandible). Von mises Stress values in MPa | Model B (Body alone Reconstructed)Von Mises Stress Values in MPa | Difference in stress (%) |
|---|
| 36 region | 45.7 | 50 | 8.6 % |
| 33 region | 11.4 | 20.1 | 43.3% |
| 31 region | 10.8 | 7.7 | 28.7% |
| 43 region | 15.5 | 20.1 | 23% |
| 46 region | 28.4 | 53 | 46.4% |
| Mean | 22.36 | 30.18 | 25.9% |
Discussion
Model validation and mechanical analysis
In order to validate the model, the numerical analysis of the stresses occurring at the bone binding interface of reconstructed mandible were compared with data from experiments previously reported by YingTie et al., [14], who investigated the biomechanics of the mandible following reconstruction with autogenous bone grafts.
According to several studies [15–19], the maximum stresses in the bone were always located around the neck of the implant due to the thickness of cortical bone which has highest modulus of elasticity when compared to the cancellous bone.
In this study the maximum von mises stress (ণ E Max) around the neck of the implant was evaluated and the FEA models were constructed based on the type of defect and the number of osteotomies needed for the fibula bone used in reconstruction.
Analysis under Vertical and Horizontal loading
When type I models which included a normal reference mandible and a right body reconstructed mandible were evaluated under a vertical loading of 200 N the ণ E Max values were comparatively smaller in reconstructed mandible except for the implant in 45 region [Table/Fig-5] this shows that the deformation is almost the same as the normal reference mandible, as the reconstruction is within a smaller area that involves the central segment alone. Whereas when the models were evaluated for horizontal force of 50 N the ণ E Max value is comparatively high for all the implants in reconstructed mandible [Table/Fig-7]. This could be explained by the fact that the height of the abutment chosen for the reconstructed mandible was 12mm which was 7mm more than the normal mandible, the occlusal height serves as the moment arm for force components directed along the faciolingual axis like working or balancing contacts, tongue thrusts, or in passive loading by the cheek and oral musculature as well as force components directed along the mesio distal axis. The moment contribution of a force component directed along the vertical axis is not affected by the occlusal height because no effective moment arm exists.
When type II models which included a normal reference mandible and central segment alone reconstructed mandible was evaluated under vertical loading. The results were similar to type I with maximum von mises stress values ণ E max [Table/Fig-9] were comparatively lesser in all the three implants. The same reason as Type I can be attributed for less stress around the implants in reconstructed part on vertical loading. When the models were evaluated for horizontal loading [Table/Fig-11] the results were same as Type I, theণ E max values are more around all the three implants in reconstructed part with a mean difference of 15.5%. Hence, there is an effective moment arm existing.
Both Type I and Type II can be grouped together where there is influence only on lateral loading and no influence on vertical loading since the area of reconstruction is small. Hence, a fixed prosthesis with contacts relieved during eccentric movements would be a design of choice. The use of double barrel fibula flap and bicortical engagement could be considered which would result in an improved reconstruction of the alveolar process, thus allowing superior individual implant positions and angulations [9,20,21].
When type III models which included a normal reference mandible and body and central segment reconstructed mandible were evaluated under a vertical loading, theণ E Max values [Table/Fig-13] are higher in reconstructed mandible by a mean difference of 36.64%. This could be explained by the fact that the height of the reconstructed bone is 13mm only when compared to normal reference mandible which had a height of 21mm, with reduced height and increased area of reconstruction there was a larger deformation resulting in more flexure of the reconstructed bone compared to normal mandible. This increase in stress due to increased area of reconstruction and decreased bone height causing increased mandibular flexure was in accordance with previous studies done by Ying Tie et al., [14], Fernando Zarone et al., [19], and H. J. A. Meijer et al., [22], when the models were evaluated for horizontal loading the ণ E Max values [Table/Fig-15] were found to be larger around the distal implants in reconstructed mandible with a mean difference of 11.8% increase when compared to the normal reference mandible this could be explained by the deformation of the mandible where both compressive and tensile stress acting in this case as explained by T.Nagasao et al.,[15].
When type IV models which included a normal reference mandible and bilateral bodies including central segment reconstructed mandible was evaluated under a vertical loading, the ণ E Max values [Table/Fig-17] are higher in reconstructed mandible by a mean difference of 32.6% increase because of the height of the reconstructed mandible which is well below the residual normal ridges on either side. When the models were evaluated for horizontal loading the ণ E Max values [Table/Fig-19] were found to be larger around all the implants in reconstructed mandible when compared to the normal reference mandible with a mean difference of 25.9% increase which could be explained by the deformation of the mandible where both compressive and tensile stress acting in this case as explained by T.Nagasao et al., [15] Only five implants were placed in this case. Increasing the number of implants with an increased antero posterior spread may reduce the stress around the implants on both horizontal and vertical loading. Hence, considering all the above facts a bar retained overdenture would be a prosthetic design of choice.
Both the Types III and IV can be grouped together where both vertical and horizontal forces produced higher stress around implants in reconstructed mandible when compared to the normal reference mandible. The areas of reconstruction were more in both these cases accounting for more deformation and more stress. Therefore greatest care should be taken to reduce the stress of this region to avoid complications. When an implant is supported by wider areas of the cortical bone, the stresses around the fixture are distributed more evenly.
In all the models under vertical loading the stress was situated only at the distal side of the implant. This location may be explained by the flexure of the mandible in case of a superstructure with connected abutments, where the bar prevents the movement of the abutments. When the structure is loaded, the mandible deforms, but the abutments are kept in place by the bar causing an extreme amount of stress at the distal side of the implants. This finding is in accordance with previous study conducted by H. J. A. Meijer et al., [22] which revealed that stress analysis of the bone around dental implants is incomplete if the model constructed does not account for the deformation of mandible.
Reconstruction with Fibula bone has numerous advantages like good length limitations, bicortical in nature, consistent bone shape throughout, segmental blood supply that allows complete freedom in osteotomy site selection and a thin island of intermediate thickness that can be designed of large dimensions and muscle that is useful for replacing soft tissue bulk.
The main limitation of fibula bone is its limited height (rarely more than 15mm) particularly in partial mandibular discontinuity leads to a considerable discrepancy in height between reconstructed and non-reconstructed segments, this results in very long clinical crowns to restore an adequate occlusal plane, the end result of which would be an unfavourable crown to implant ratio with a risk of mechanical overload. And difference in increased soft tissue thickness might contribute to the differences in resiliency in both of these tissues. Hence surgical procedures which would enhance the available bone height in the reconstructed areas would be an added advantage.
Conclusion
Von Mises stresses (ণ E Max) were higher in all the reconstructed models on horizontal loading.
Under vertical loading the stress were more in type III and type IV models which had a larger area of reconstruction.
The flexure of bone with implants and supra structure is an important factor on vertical loading.
A fixed prosthesis may be indicated in type I and Type II reconstructions. To allow superior individual implant positions and angulations surgical techniques to increase the available bone height could be considered.
A bar retained overdenture by placing more number of implants is advocated in type III and type IV defects.
Von Mises stresses are greater around distal implants in long areas of reconstruction.