Prevalence of Insulin Resistance in Siblings of Type 2 Diabetics of North West Punjabi Population
Sukhraj Kaur1, Mridula Mahajan2, B.S. Bal3
1 Lecturer, Department of Biochemistry, Government Medical College, Amritsar, India.
2 Professor and Head, Department of Biochemistry, Government Medical College, Amritsar, India.
3 Professor, Department of Medicine, Government Medical College, Amritsar, India.
NAME, ADDRESS, E-MAIL ID OF THE CORRESPONDING AUTHOR: Dr. Sukhraj Kaur, 243 Diamond Avenue Majitha Road, Amritsar-143001, India Phone : 9646142606, E-mail : Sukhrajkaur2005@yahoo.co.in
Context: Insulin resistance a physiological condition is marked by hyperglycemia and failure of cells to respond to normal action thus hyperinsulinemia. It is prevalent in individuals having genetic predisposition and family history of type 2 diabetes mellitus. Physically inactive individuals having sedentary life style are also at a risk of developing insulin resistance.
Aim: The present study was planned to observe the prevalence of insulin resistance or pre diabetes in various age groups of North West Punjabi population.
Materials and Methods: A total of 400 families comprising of 1159 offsprings of diabetic patients and siblings amongst each were included in the present study. All these 400 families had history of type 2 diabetes mellitus in the present or past generation. Written consent was taken from the head of the family for inclusion in the study. Fasting samples were collected and analysed for Glucose, Glycosylated Hb, complete lipid profile, Insulin and c-peptide. Body mass index, waist hip ratio and HOMA-IR were calculated. Comparison of mean of various parameters was done using student t-test. Analysis of variance (ANOVA) was applied for comparison between groups followed by Bonferroni post hoc analysis. Pearson’s correlation method was used for quantitative variables. Statistical significance was defined as p<0.05 (two tailed).
Results: Prevalence of impaired fasting glucose both in males and females increased with advancing age. Hyperglycemia along with hyperinsulinemia, hypercholesterolemia and hypertriglyceridemia was observed in individuals having impaired fasting glucose. Individuals belonging to age group of >18-35 years were more prone to insulin resistance as compared to other age groups.
Conclusion: Insulin resistance at a young age of 18-35 years predisposes these individuals to coronary events. Females in reproductive years are more prone to insulin resistance or pre diabetes as compared to males of the same age group.
Diabetics, Family history, Insulin resistance, North west punjabi population, Siblings
Introduction
Pre diabetes impaired fasting glucose and or impaired glucose tolerance almost always precedes type 2 diabetes mellitus which is a cardio metabolic syndrome. The epidemic of diabetes is accelerating in the developing world with an increased proportion of individuals in younger age group i.e. children and adolescents. In the year 2013, 382 million individuals were suffering from type 2 diabetes mellitus, whereas another 175 million had pre diabetes [1]. The decrease in age of onset of type 2 diabetes is more evident since last decade [2] and it has been reported that 0.2% of total global population of diabetes is under the age of 15 years [3]. This increase can be attributed to adverse life style like physical inactivity and obesity which are also the key components for development of insulin resistance [4]. In individuals with genetic predisposition the rate of development of insulin resistance is very high thus predisposing this population to the risk of developing type 2 diabetes mellitus and cardio vascular disease. Insulin resistance can be considered as long asymptomatic period before the development of overt diabetes. The condition of insulin resistance or pre diabetes can be detected [5] and if managed with dietary, life style modifications [6] and/ or pharmacological intervention [7] can delay if not prevent the onset of type 2 diabetes mellitus in the population. Familial aggregation of insulin resistance in children of type 2 diabetics is 30% in siblings and 80% in identical twins [8]. Keeping in view the magnitude of prevalence of diabetes preceded by pre diabetes or insulin resistance, the present study was planned to observe the prevalence of insulin resistance in genetically predisposed individuals (i.e. offsprings of individuals suffering from type 2 diabetes) belonging to north west Punjabi population.
Materials and Methods
The present study was conducted in the Department of Biochemistry in association with Department of Medicine Government Medical College Amritsar, India. The subjects were recruited for the present study by conducting door to door survey of some villages of Amritsar and Tarn Taran district. Each diabetic individual was considered as one family unit and the offsprings of the diabetic individuals who were siblings amongst themselves in the age group of 10 to 55 years were included in the present study. Informed consent was taken from the diabetic individuals who were also the head of the family for inclusion of their families in the present study. The individuals were free to leave the study at any point. Blood samples were collected by conducting community camps of the registered individuals, all the individuals were advised to observe an overnight fast. To comply with these instructions the samples were collected early in the morning. Apart from various biochemical parameters i.e. Fasting plasma glucose [9], Glycated Hb [10], Insulin [11], C-peptide [12] and complete lipid profile [13–16], anthropometric measurements like waist hip ratio and BMI were also calculated. The status of beta cell function, %age sensitivity to insulin and insulin resistance were calculated using HOMA-IR 2 [17]. To avoid any instrumental error same procedure and measuring instruments were used to check the height, weight and waist hip measurements in all the individuals. The data collected was analyzed using SPSS software (version 16.0). The project was cleared by college ethical committee.
Results and Discussion
To collect the sample size a door to door survey of some of the villages of border belt of Amritsar and Tarn Taran district was conducted. A total of 400 families who had a history of type 2 diabetes gave their consent to join the present study. These families comprised of 1159 individuals (i.e. offsprings of diabetic individuals who were siblings amongst themselves). Individuals in the age group of 10 to 55 years were enrolled for the present study. Out of total 1159 individuals, 635 were males and 524 were females. These siblings were subdivided into four groups depending on their age i.e. group I ≤ 18 years, group II >18-35 years, group III >35-45 years and group IV >45 years [Table/Fig-1]. It was observed that maximum number of individuals belonged to the age group of >18-35 years.
Distribution of the siblings according to age and sex
| Age Group | Number of siblings |
|---|
| Total | Male | Female |
|---|
| upto18 years | 228 | 132 | 96 |
| >18 to 35 years | 742 | 403 | 339 |
| >35 to 45 years | 169 | 90 | 79 |
| >45years | 20 | 10 | 10 |
| Total | 1159 | 635 | 524 |
All the individuals belonging to each group were divided into three categories depending on the levels of fasting plasma glucose as normal, IFG and diabetic [Table/Fig-2] as suggested by American Diabetes Association in its guidelines [18]. The % age of individuals with impaired fasting glucose (IFG) increased with advancing age both in males (from 15.2% to 30%) and females (from 22.9% to 60%), with prevalence being more in females than in males [Table/Fig-2].
Number of the siblings on the basis of fasting plasma glucose levels in the various age groups
| Group | Males | Females |
|---|
| Total no. of sibli-ngs | Normal | IFG | Diabetic | Total no. of siblings | Normal | IFG | Diabetic |
|---|
| ≤18 years | 132 | 108 (81.8%) | 20 (15.2%) | 4 (3%) | 96 | 68 (70.88%) | 22 (22.9%) | 6 (6.22%) |
| >18-35 years | 403 | 266 (66%) | 84 (20.84%) | 53 (13.16%) | 339 | 202 (59.6%) | 93 (27.43%) | 44 (12.97%) |
| >35-45 years | 90 | 45 (50%) | 26 (28.9%) | 19 (21.1%) | 79 | 39 (49.38%) | 24 (30.37%) | 16 (20.25%) |
| >45 years | 10 | ---- | 3 (30%) | 7 (70%) | 10 | ------ | 6 (60%) | 4 (40%) |
Various biochemical investigations like glycosylated Hb, S. Insulin, C-peptide, lipid profile complete (Total cholesterol, Triglycerides, HDL-C, LDL-C and VLDL-C) along with anthropometric measurements used to calculate waist hip ratio and body mass index were estimated in all the individuals belonging to each age group.
A comparison of fasting plasma glucose levels of all the individuals included in each age group revealed that fasting plasma glucose levels were significantly more in individuals with IFG and diabetes when compared to that of normal individuals, also the diabetics had significantly raised fasting plasma glucose levels when compared to individuals with impaired fasting glucose. This trend was common both in males and females. Similar observations were revealed with glycosylated hemoglobin levels estimated in individuals with impaired fasting glucose and diabetes [Table/Fig-3]. Enzo Bonora and Jaakko Tuomilehto [18] states that the estimation of glycosylated Hb along with fasting glucose is important or the levels of glycosylated Hb clearly demarcated the individuals with IFG and diabetes from normal individuals.
Comparison of fasting plasma glucose and glycosylated Hb in individuals of various age groups
| Age | Sex | Glucose | Glycosylated Hb |
|---|
| Normal | IFG | Diabetic | Normal | IFG | Diabetic |
|---|
| ≤18 years | Males | 82.32 ±1.12 | 111.05 ±8.7* | 160.2 ±2.3* | 4.3 ±0.51 | 5.89 ±0.35* | 7.2 ±1.46* |
| Females | 81.36 ±1.3 | 109.6 ±6.18* | 173±2.1* | 4.29 ±0.39 | 5.81 ±0.4* | 7.6 ±1.08* |
| >18-35 years | Males | 81.2 ±1.3 | 110.6 ±6.5* | 192.9 ±6.9† | 4.3 ±0.5 | 5.8± 0.53* | 6.55 ±6.3† |
| Females | 84.7 ±1.3 | 111.9 ±7.3* | 174.4 ±5.8† | 4.4 ±0.64 | 5.8± 0.38* | 6.25 ±1.2† |
| >35-45 years | Males | 84.1 ±1.3 | 109±6.1* | 198 ±40† | 4.3 ±0.5 | 5.8 ±0.2* | 6.3 ±0.9† |
| Females | 82.3 ±3.7 | 113.4 ±6.9* | 174 ±39.7† | 4.4 ±0.5 | 5.7 ±0.2* | 6.13 ±0.8† |
| >45 years | Males | ---- | 109.67 ±2.8 | 196.1 ±4 .06* | ---- | 5.80 ±0.34 | 6.74 ±1.51* |
| Females | ---- | 117.5 ±8.9 | 148.5 ±2.2* | ---- | 6.2 ±0.3 | 6.45 ±0.1 |
* p<0.001 when IFG and diabetics were compared with each other and normal
†p<0.001 when diabetics were compared with normal
Juvenile diabetes or type 1 diabetes was ruled out by estimating levels of S. Insulin and C-peptide in the age group of ≤ 18 years. Levels of S. Insulin were more in IFG and diabetics as compared to normal individuals thus clearly depicting synthesis and secretion of insulin thereby clearly indicating prevalence of pre diabetes or insulin resistance in these young individuals [Table/Fig-4]. Corresponding to insulin levels the c-peptide were more in individuals with IFG and diabetes as compared to normal and there was a positive correlation with insulin levels (r=+0.709, p<0.001).
Comparison of S. Insulin and C-peptide in individuals of various age groups
| Age | Sex | S.Insulin | C-peptide |
|---|
| Normal | IFG | Diabetic | Normal | IFG | Diabetic |
|---|
| ≤18 years | Males | 10.83 ± 6.1 | 15.37 ± 6.6† | §20.04 ±4.33II | 22.06 ±1.0 | 35.6 ±1.49† | §24.97 ±8.37II |
| Females | 11.28 ± 6.4 | 15.03 ± 4.8† | 16.84 ± 6.33II | 24.76 ±1.64 | 36.13 ±1.7† | ‡35.33 ±1.56II |
| >18-35 years | Males | 11.68 ±6.3 | 16±9.10† | ‡§25.3 ±5.6II | 26.7 ±1.7 | 31.4 ±1.98† | §39.36 ±2.4II |
| Females | 12.11 ±6.4 | 18.96 ±6.6† | 19.28 ±6.6II | 25.19 ±1.6 | 28.29 ±1.77 | §37.53 ±1.9II |
| >35-45 years | Males | 10.1 ±5.0 | 15.1 ±5.9† | §19.18 ±8.1II | 24.5 ±1.0 | 29.9 ±1.3† | §35.7 ±3.4II |
| Females | 10.4 ±4.0 | 13.5 ±4.9† | §20.8 ±7.1II | 22.7 ±1.0 | 31.6 ±1.6* | §42.9 ±2.9II |
| >45 years | Males | ---- | 11.20 ±4.86 | 23.86 ±3.2† | ---- | 16.7 ±1.14 | ‡57.6 ±2.03† |
| ---- | 13.8 ±4.5 | 22.5 ±2.6† | ---- | ‡§31.7 ±1.8 | 27.2 ±1.3† |
* p< 0.05 when IFG and diabetics were compared with each other.
† p<0.001 when IFG and diabetics were compared with each other.
‡ p<0.05 when males were compared with females.
§p<0.05 when IFG were compared with diabetics
IIp<0.001 when diabetics were compared with normal.
As the levels of fasting plasma glucose progressed from normal and IFG to diabetes levels of insulin and c-peptide varied significantly but only in males. In females belonging to age group of ≤ 18 years and >18-35 years no significant variation in the levels of insulin was observed when IFG and diabetics were compared with each other thereby clearly indicating that hyperinsulinemia was prevalent in females belonging to these age groups [Table/Fig-4]. In adolescent group (≤ 18 years), this trend may be attributed to growth hormone levels that stimulate both synthesis and secretion of insulin [19].
A positive correlation of fasting plasma glucose with insulin (r= +0.425, p<0.001) indicated secretion of insulin in response to hyperglycemia. C-peptide is a byproduct of insulin which is cleaved off for production of insulin was found to be more in IFG and diabetics as compared to normal individuals [Table/Fig-4]. In females belonging to the age group of ≤ 18 years no significant variation in the levels of C-peptide was observed when IFG and diabetics were compared amongst each other. In all the other individuals belonging to various age groups levels of c-peptide were more in diabetics as compared to normal and IFG both in males and females.
Levels of total cholesterol were more in individuals with hyperinsulinemia and hyperglycemia [Table/Fig-5] As stated by Manisha C [20], Angelo, [21], Wilckon DE, [22], Enas A, [23] and OMP Ganda, [24] levels of cholesterol are more in individuals with IFG due to biosynthesis of cholesterol via HMG Co A pathway and preventing its uptake by the tissues for utilization. The IFG male individuals belonging to the age group of >45 years had more levels of cholesterol as compared to diabetics and this variation was statistically significant in males [Table/Fig-5], whereas in females the variation amongst IFG and diabetics was statistically not significant as these individuals were on treatment hence no definite conclusion could be drawn.
Comparison of cholesterol and triglyceride in individual of various age groups
| Age | Sex | Cholesterol | Triglycerides |
|---|
| Normal | IFG | Diabetic | Normal | IFG | Diabetic |
|---|
| ≤18 years | Males | 173.6 ±2.64 | 180 ±3.13† | ‡§221.7 ±4.3II | 101.9 ±6.65 | 104.5 ±3.88 | §‡112.7 ±5.4 |
| Females | 169.7 ±2.35 | ‡194 ±3.36† | 197 ±6.6″ | 95.9 ±3.78 | §118.5 ±4.21 | §95.8 ±5.6 |
| >18-35 years | Males | 187.5 ±4.2 | 185 ±4.3 | §206 ±4.2II | 123.0 ±6.4 | 132.7 ±6.7 | §166 ±9.2II |
| Females | 191.5 ±4.0 | 198.8 ±3.6 | §214 ±4.41II | 120.3 ±5.1 | ‡160 ±9.5 | ‡§180 ±11.3II |
| >35-45 years | Males | 191 ±3.7 | 196.5 ±4.2 | §215 ±4.8II | ‡143 ±5.3 | 163 ±5.5† | 183 ±8.7§II |
| Females | 172 ±3.6 | 206.8 ±5.3† | ‡§295 ±5.3II | 123 ±3.5 | ‡148 ±5.3* | 177 ±8.5§ |
| >45 years | Males | ---- | 218 ±4.3 | §199.4 ±3.6 | ---- | ‡162 ±7.3 | §207.4 ±8.2 |
| Females | ---- | 187.5 ±4.9 | 197.5 ±1.8 | ---- | 145 ±5.8 | ‡§225.5 ±12.4 |
*p<0.05 when IFG were compared with normal
†p<0.001 when IFG were compared with normal individuals
‡ p<0.05 when males were compared with females
§ p<0.05 when diabetics were compared with IFG
IIp<0.001 when diabetics were compared with normal individual
Mean LDL-C levels (in males and females) in all the age groups i.e. ≤ 18 years, >18-35 years, >35-45 years and >45 years although were more in IFG and diabetic individuals yet the values were within normal limits [Table/Fig-6].
Comparison of Lipoproteins in individuals of various age groups
| Age | Sex | HDL-C | LDL-C | VLDL-C |
|---|
| Normal | IFG | Diabetic | Normal | IFG | Diabetic | Normal | IFG | Diabetic |
|---|
| ≤18 years | Males | 50.2±7.2 | 49.8±5.6 | 53.2±7.8 | 101.2±2.8 | 103±2.3 | ‡145.9±4.1§ii | 20.3±1.34 | 16.91±7.7 | 22.5±1.09 |
| Females | 50.2±7.7 | 50.4±8.0 | 49.6±7.950 | 90.7±3.2 | ‡125.6±3.0† | 128.5±3.0ii | 19.2±7.5 | 18.7±8.43 | 19.16±3.1 |
| >18-35 years | Males | 50±7.2 | 49±7.1 | 48±7.0 | 112.5±4 | 106.6±3 | §126±4.7ii | 24.8±1.2 | 27.1±1.3 | §33.8±1.9 |
| Females | 50±7.1 | 47±6.7 | 48±6.6 | 112±3.7 | 116±3.8 | §131±4.5ii | 24.2±1.1 | 31.8±1.9 | 36.1±2.2 |
| >35-45 years | Males | 49±7.0 | 48±5.2 | 48±5.6 | 112±4.2 | 119±4.7 | §125±5.4 | 28.6±1.0 | 29±1.1 | §36±1.7ii |
| Females | 50±7.0 | 48±5.3 | 47±5 | 115±4.5 | †128±3.5‡ | ‡§137±6.4ii | 24.6±1.5 | 29±1.1 | §35±1.7ii |
| >45 years | Males | | 46±3.4 | 47±6.9 | | ‡139.4±2.5 | 110±2.9† | | 32.5±1.4 | §41±1.6* |
| Females | | 51.6±8.5 | ‡42±5.2 | | 101.4±4.2 | 109±9.6 | | 29.0±1.1 | §45±2.4* |
*p<0.05 when IFG were compared with normal
†p<0.001 when IFG were compared with normal individuals
‡ p<0.05 when males were compared with female
§ p<0.05 when diabetics were compared with IFG
IIp<0.001 when diabetics were compared with normal individual
Hyperglycemia leading to hypercholesterolemia and hypertriglyceridemia may be responsible for slight variation in LDL-C levels (LDL-C with fasting plasma glucose r= +0.950, p<0.001, LDL-C with Total Cholesterol r= +0.950, p<0.001). Raised levels of triglycerides in response to hyperglycemia (r=+1.0, p<0.001) leads to raised levels of VLDL-C in individuals with IFG . No significant variation was observed when IFG and diabetics were compared amongst each other [Table/Fig-6]. As stated by Coppack et al., [25], unrestricted lipolysis in insulin resistance leads to increased fatty acid flux in liver and increased synthesis of triglycerides in liver thereby affecting the levels of VLDL-C. Levels of HDL-C are affected by physical inactivity.
Hyperinsulinemia associated with hypertriglyceridemia and low levels of HDL are atherogenic, moreover glycosylation of HDL-C and LDL-C takes place leading to decrease in the half life of glycosylated HDL-C, receptors do not recognize to scavenge it, whereas glycosylated LDL stays longer in circulation. These glycosylated lipoproteins are immunogenic and can damage the arterial endothelium, the situation is aggravated by increased circulating C-peptide which induces local inflammation [26].
HOMA-IR calculations in all the individuals belonging to various age groups indicated loss of β-cell function in diabetes and IFG as compared to normal individuals both in males and females [Table/Fig-7].
Comparison of Beta cell function, % sensitivity and Insulin resistance in individuals of various age groups
| Age | Sex | % Beta cell function | % sensitivity to insulin | Insulin resistance |
|---|
| Normal | IFG | Diabetic | Normal | IFG | Diabetic | Normal | IFG | Diabetic |
|---|
| ≤18 years | Males | 144.9 | 100† | 77.3†§ | 94.9 | 63.8† | 40.03†§ | 1.3 | 1.9* | 2.6†§ |
| Females | 159.4 | 91.4† | 50.5†§ | 93.8 | 65.5† | 44.3†§ | 1.4 | 1.7 | 2.46†§ |
| >18-35 years | Males | 155.35 | †88.1‡ | 60.23†§ | 85.78 | 76.21† | 40.38†§ | 1.5 | 1.73 | 4.94†§ |
| Females | 163.34 | 103.81† | 52.18†§ | 88.57 | 61.58‡† | 44.43†§ | 1.45 | 2.11‡† | ‡ 6.99§† |
| >35-45 years | Males | 136.73 | 103† | 52.8†§ | 99.1 | 54.8† | 44.5†§ | 1.2 | 2.0* | ‡9.24†§ |
| Females | 145.8 | 89.4‡† | 60.1*§ | 98.03 | 60.9† | 39†§ | 1.2 | 1.83 | 3.08†§ |
| >45 years | Males | | 112.5 | †55.5‡ | | ‡43.3 | ‡28.3† | | ‡2.3 | 3.6† |
| Females | | 87.1‡ | 81.4 | | 60.5 | 34.1† | | 1.8 | 3.0† |
* p<0.05 when IFG and diabetics were compared with normal individuals
† p< 0.001 when IFG and diabetics and normal individuals were compared with each other
‡p<0.05 when males and females were compared amongst each other
§p<0.05 when IFG and diabetics were compared with each other
There are five stages in progression to diabetes from IFG which are marked by changes in β-cell function [27]. As the levels of fasting glucose rises from normal to IFG and diabetes the function of β-cell decreases.
All the individuals (both males and females) were less sensitive hence more resistant to insulin. Maximum resistance to insulin was seen in individuals belonging to the age group of >18-35 years and >35-45 years [Table/Fig-7].
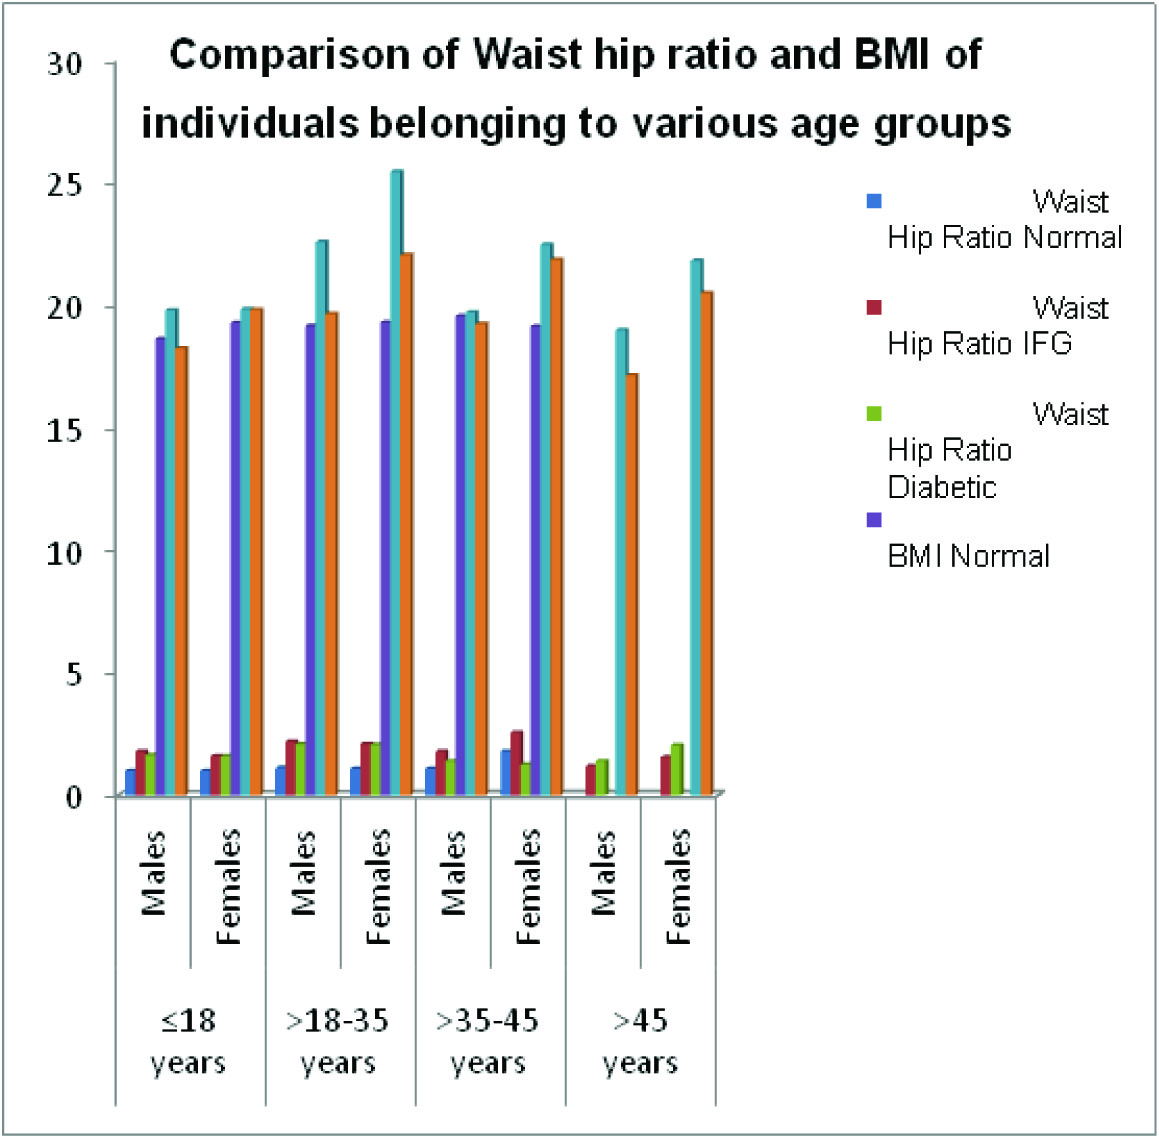
Anthropometric measurements i.e. height, waist and waist hip ratio were recorded and BMI of all the individuals was calculated. The waist hip ratio did not vary significantly when young IFG and diabetic individuals (belonging to the age group of ≤ 18 years and >18-35 years were compared amongst each other). In the age group of >35-45 years the females having IFG had considerably more waist hip ratio as compared to IFG males whereas in the age group of >45 years the ratio was reverse [Table/Fig-8].
Comparison of anthropometric parameters in individools of various age groups
| Age | Sex | Waist Hip Ratio | BMI |
|---|
| Normal | IFG | Diabetic | Normal | IFG | Diabetic |
|---|
| ≤18 years | Males | 1.0 | 1.8* | 1.64 | 18.64 | 19.81 | 18.25 |
| Females | 1.0 | 1.6 | 1.6 | 19.30 | 19.85 | 19.83 |
| >18-35 years | Males | 1.13 | 2.2 | 2.1 | 19.17 | ‡22.60 | 19.66 |
| Females | 1.1 | 2.1 | 2.07 | 19.32 | ‡25.46* | 22.06 |
| >35-45 years | Males | 1.1 | 1.8 | 1.4 | 19.57 | 19.72 | 19.25 |
| Females | 1.8 | 2.57§ | ‡1.26 | 19.15 | †22.48* | 21.86 |
| >45 years | Males | ----- | 1.2 | 1.4 | ----- | 19.0 | 17.14 |
| Females | ----- | 1.56 | 2.05§ | ----- | †21.83 | †20.5 |
*p<0.05 when IFG diabetic and normal were compared with each other
† p<0.05 males and females were compared with each other
‡ p<0.05 when IFG and diabetics were compared with each other
§p<0.001 when IFG, diabetic and normal were compared with each other
Comparison of Waist hip ratio and BMI of individuals belonging to various age groups
Conclusion
It can be concluded from the present study that pre diabetes or insulin resistance, hyperinsulinemia along with hypertriglyceridemia is present in adolescents and young individuals i.e. belonging to the age group of ≤ 18 years and >18-35 years, thus predisposing these individuals to coronary events. Females in the reproductive years are more prone to pre diabetes or insulin resistance. Impaired fasting glucose along with deranged waist hip ratio and BMI play a significant role in predicting potential diabetics.
* p<0.001 when IFG and diabetics were compared with each other and normal
†p<0.001 when diabetics were compared with normal
* p< 0.05 when IFG and diabetics were compared with each other.
† p<0.001 when IFG and diabetics were compared with each other.
‡ p<0.05 when males were compared with females.
§p<0.05 when IFG were compared with diabetics
IIp<0.001 when diabetics were compared with normal.
*p<0.05 when IFG were compared with normal
†p<0.001 when IFG were compared with normal individuals
‡ p<0.05 when males were compared with females
§ p<0.05 when diabetics were compared with IFG
IIp<0.001 when diabetics were compared with normal individual
*p<0.05 when IFG were compared with normal
†p<0.001 when IFG were compared with normal individuals
‡ p<0.05 when males were compared with female
§ p<0.05 when diabetics were compared with IFG
IIp<0.001 when diabetics were compared with normal individual
* p<0.05 when IFG and diabetics were compared with normal individuals
† p< 0.001 when IFG and diabetics and normal individuals were compared with each other
‡p<0.05 when males and females were compared amongst each other
§p<0.05 when IFG and diabetics were compared with each other
*p<0.05 when IFG diabetic and normal were compared with each other
† p<0.05 males and females were compared with each other
‡ p<0.05 when IFG and diabetics were compared with each other
§p<0.001 when IFG, diabetic and normal were compared with each other
[1]. International Diabetes federationIDF diabetes atlas 2013 6th EditionBrussels, Belgium [Google Scholar]
[2]. Kaur Sukhraj, Mahajan Mridula, Declining age of onset of type 2 diabetes mellitus in North West Punjabi populationJournal of clinical and diagnostic research 2011 5(3):425-29. [Google Scholar]
[3]. Alberti George, Zimmet Paul, Shaw Jonathan, Bloomgarden Zachary, Karfman Francine, Type 2 diabetes in young- the evolving epidemicDiabetes care 2004 27(7):1798-1811. [Google Scholar]
[4]. Hamburg Naomi M, McMackin Craig J, Huang Alex L, Shenouda Sherene M, Widlansky Michael E, Schulz Eberhard, Physical inactivity rapidly induces insulin resistance and microvascular dysfunction in healthy volunteersArterioscler Thromb Vasc Biol 2007 Dec 27(12):2650-56. [Google Scholar]
[5]. Martinez Francisco Javier, Villa Eduardo, Serrano Joaquin, Garcia-Rodes Rafael, Diagnosis of Insulin resistanceDrugs 1993 46(suppl 2):165-71. [Google Scholar]
[6]. McAuley Kirstein A, Williams Sheila M, Mann Jim I, Goulding Ailsa, Chisholm Alex, Wilson Nocla, Intensive life style changes are necessary to improve insulin sensitivityDiabetes care 2002 25(3):445-52. [Google Scholar]
[7]. Matthaei S, Stumvoll M, Kellerer M, Haring HU, Pathophysiology and pharmacological treatment of Insulin ResistanceEndocr Rev 2000 21(6):585-618. [Google Scholar]
[8]. Arfa Iman, Abid Abdelmajid, Malouche Dhafer, Alaya Nissaf Ben, Azegue Theophile Roland, Manrai Imam, Familial aggregation and excess maternal transmission of type 2 diabetes in TunisiaPost grad Med J 2007 83(979):348-51. [Google Scholar]
[9]. Trinder P, Determination of blood glucose using an oxidase-peroxidase system with a non-carcinogenic chromogenJ. clin. Path 1969 22:158-61. [Google Scholar]
[10]. Klenk D C, Hermanson G T, Krohn R I, Fujimoto E K, Mallia A K, Smith P K, Determination of glycosylated hemoglobin by affinity chromatography: comparison with colorimetric and ion-exchange methods, and effects of common interferencesClinical Chemistry 1982 28(10):2088-94. [Google Scholar]
[11]. Boehm Timothy M, Lebovitz Harold E, Statistical Analysis of Glucose and Insulin Responses to Intravenous Tolbutamide: Evaluation of Hypoglycemic and Hyperinsulinemic StatesDiabetes Care 1979 2(6):479-90. [Google Scholar]
[12]. Kuzuya H, Blix PM, Horwitz DL, Steiner DF, Rubenstein AH, Determination of free and total insulin and C-peptide in insulin treated diabeticsDiabetes 1977 26:22-26. [Google Scholar]
[13]. Allain Charles C, Poon Lucy S, Chan Cicely S. G, Richmond W, Fu Paul C, Enzymatic Determination of Total Serum CholesterolClinical Chemistry 1974 20(4):470-75. [Google Scholar]
[14]. Brustein M, Scholnick HR, Morfin R, Rapid method for the isolation of lipoprotein from human serum by precipitation with polyanionsJ Lipid Res 1970 11:583-95. [Google Scholar]
[15]. McGowan MW, Artiss Joseph D, Standbergh Donald R, Zak Bennie, A peroxidase coupled method for the colorimetric determination of Serum triglyceridesClin Chem 1983 29/3:538-42. [Google Scholar]
[16]. Friedwald William T, Levy Robert I, Fredrickson Donald S, Estimation of concentration of low density lipoprotein cholesterol in plasma, without the use of preparative ultracentrifugeClinical Chemistry 1972 18(6):499-502. [Google Scholar]
[17]. Matthews DR, Hosker JP, Rudenski AS, Naylor BA, Treacher DF, Turner RC, Homeostasis model assessment: insulin resistance and beta-cell function from fasting plasma glucose and insulin concentrations in manDiabetologia 1985 28(7):412-19. [Google Scholar]
[18]. Enzo Bonora, Jaakko Tuomilehto, The pros and cons of diagnosing diabetes with A1CDiabetes care 2011 34(2):S184-90. [Google Scholar]
[19]. Takano A, Haruta T, Iwata M, Usui I, Uno T, Kawahara J, Growth hormone induces cellular insulin resistance by uncoupling phosphatidylinositol 3-kinase and its downstream signals in 3T3-L1 adipocytesDiabetes 2001 50(8):1891-900. [Google Scholar]
[20]. Chandalia M, Garg A, Lutjohann D, Beneficial effects of high dietary fiber intake in patients with type 2 diabetes mellitusNEJM 2000 342(19):1392-98. [Google Scholar]
[21]. Scanu Angelo M, Lawn Richard M, Berg Kåre, Lipoprotein (a) and AtherosclerosisAnnals of Internal Medicine 1991 115(3):209-18. [Google Scholar]
[22]. Wilcken DE, Wang XL, Dudman NP, The Apo A, B, a of coronary risk: back to kindergartenAust N Z J Med 1992 22(5 Suppl):570-75. [Google Scholar]
[23]. Enas Enas A, Mehta Jwahar, Malignant Coronary Artery Disease in Young Asian Indians: Thoughts on Pathogenesis, Prevention, and TherapyClin C’ardiol 1995 18:131-35. [Google Scholar]
[24]. Ganda Om P, Soeldner J Stuart, Gleason Ray E, Alterations in Plasma Lipids in the Presence of Mild Glucose Intolerance in the Offspring of Two Type II Diabetic ParentsDiabetes Care 1985 8(3):254-60. [Google Scholar]
[25]. Coppack SW, Frayn KN, Humphreys SM, Dhar H, Hockaday TD, Effects of insulin on human adipose tissue metabolism in vivoClin Sci (Lond) 1989 77(6):663-70. [Google Scholar]
[26]. Vasic D, Walcher D, Proinflammatory effect of c-peptide in different tissuesInternational journal of Inflammation 2012 2012:932725Published online 2012 11. doi: 10.1155/2012/932725 [Google Scholar]
[27]. Weir Gordon C, Weir Susan Bonner, Five stages of evolving beta cell dysfunction during progression to diabetesDiabetes 2004 53(suppl 3):S16-21. [Google Scholar]