Effect of Isometric Exercise on QTc Interval
Arati Meher1, Manasi Bhattacharjee2, Parikha Rampal3, Raj Kapoor4, Renuka Sharma5
1 Senior Resident, Department of Physiology, Vardhman Mahavir Medical College and Safdarjung Hospital, New Delhi, India.
2 Assistant Professor, Department of Physiology, Vardhman Mahavir Medical College and Safdarjung Hospital, New Delhi, India.
3 MBBS Student, Vardhman Mahavir Medical College and Safdarjung Hospital, New Delhi, India.
4 Director Professor, Department of Physiology, Vardhman Mahavir Medical College and Safdarjung Hospital, New Delhi, India.
5 Professor, Department of Physiology, Vardhman Mahavir Medical College and Safdarjung Hospital, New Delhi, India.
NAME, ADDRESS, E-MAIL ID OF THE CORRESPONDING AUTHOR: Dr. Renuka Sharma, Department of Physiology, Vardhman Mahavir Medical College and Safdarjung Hospital, New Delhi- 110029, India. Phone : 9811430320, E-mail : drrenukasharma@yahoo.co.in
Introduction: The QTc interval is affected by heart rate, autonomic nervous system and diseases like diabetes. However, the affect of exercise which alters autonomic nervous system activity, on QTc is not clear. On the other hand, the incidence of sudden cardiac death increases many fold post exercise. These events may be better explained by studying the effect of exercise on QTc.
Aim: This study was designed with an aim to record the QTc interval changes in response to isometric exercise in a group of normal individuals with or without parental history of diabetes mellitus. Also the QTc duration was correlated with the LF-HF ratio.
Materials and Methods: Twenty nine, healthy medical students were subjected to isometric hand grip test for 5min. ECG was recorded pre-exercise and at various time intervals post-exercise.
Statistical Analysis: All data are expressed in mean ± SD. Intra group comparison was done using paired t-test and unpaired t-test was used for comparison among group I and group II subjects, and among males and females.
Result: The difference in the pre and post exercise QTc values both within and between groups was statistically significant with group I subjects recording lower values. The post exercise LF: HF values were significantly increased when compared to pre exercise values in both the groups. There was no correlation between LF: HF and QTc.
Conclusion: A longer than normal QTc interval predisposes to arrhythmia. Exercise brings about detectable changes in the QTc interval after a period of isometric exercise in normal individuals which in high risk individuals may predispose to sudden cardiac death. In addition women may be more susceptible to post-exercise arrhythmia owing to a longer QTc even at rest.
Autonomic nervous system, Isometric exercise, Sudden cardiac death, QTc interval
Introduction
Physical exercise can be regarded as a period of increased sympathetic activity with simultaneous parasympathetic withdrawal while the post-exercise period is about regaining the normal sympathovagal balance [1,2]. The beneficial effects of exercise on cardiovascular system have been proved beyond doubt [3,4]. On the other hand it has also been observed that risk of sudden cardiac events increases many fold immediately after exercise in susceptible individuals [5]. Further, a blunted parasympathetic nervous system at rest as assessed by the heart rate variability has been implicated in cardiovascular mortality [6,7]. Therefore, the interrelationship between the two limbs of the autonomic nervous system seems to be important in episodes of unfavourable cardiac events.
Assessment of cardiovascular response during exercise and recovery is an important tool to assess individual susceptibility to unfavourable cardiac events. Classical exercise testing primarily monitors ST segment changes in the ECG [8,9]. However, the QT interval, a measure of ventricular depolarisation and repolarisation, may be more informative [10]. The QT interval is measured from the beginning of the QRS complex to the end of T-wave and averaged over 3 to 5 beats in a single lead. The QT interval is known to be influenced by a number of factors of which heart rate is the most important. QT interval and heart rate are usually inversely related but this relationship is lost at both high and low heart rates [11]. Nevertheless, QT interval must be corrected for rate for which the Bazett’s square root formula is considered as the gold standard [12]. The corrected QT interval is referred to as the QTc. Gender also affects QTc interval with females observed to be having a longer QTc interval [13]. The autonomic nervous system affects QTc interval, independent of heart rate, as revealed by pacing studies [11,14]. Diseases such as diabetes mellitus, known to affect the autonomic nervous system, also prolong this interval. Prolongation of QTc is clinically significant as it predisposes to fatal arrhythmias [15].
The effect of exercise on QTc interval is highly variable [10,11,16,17] and the answer to increased post exercise cardiac mortality is likely to be found in the QTc interval changes. Another non invasive technique for assessing autonomic status of the heart is the heart rate variability (HRV). This is an electrocardiographic marker of sympathetic and parasympathetic influence on the sinus node. Of the many ways by which ECG is analysed to detect HRV, the frequency domain analysis is one. By this method, the total power of R-R interval variability is calculated and the component spectral bands are identified. Four spectral components designated high frequency (HF), low frequency (LF), ultra low frequency (ULF) and very low frequency (VLF) have been identified. The HF component has been defined as a marker of vagal modulation. The LF component is regarded primarily as a marker of sympathetic modulation by certain authors whereas some authors interpret it as a combination of sympathetic and parasympathetic activity. The LF/HF ratio therefore reflects global sympathovagal balance [18].
Therefore, these two highly informative but non invasively recorded parameters may be used to identify autonomic nervous system aberrations, if any, as well as to predict susceptibility to sudden cardiac events following a bout of exercise both in normal individuals and those with existing risk factors.
Aim
This study was designed with an aim to record the QTc interval changes in response to isometric exercise in a group of normal individuals with or without parental history of diabetes mellitus. Further, we also attempted to look for a correlation, if any, between QTc interval changes and LF-HF ratio.
Materials and Methods
A cross-sectional study was conducted in the Department of Physiology, Vardhaman Mahavir Medical College and Safdarjung Hospital, New Delhi, India after approval from the institutional ethical committee. The study included 29 subjects. They were healthy, medical students of both genders between the ages of 17-25 yrs. They were categorized into two groups: group I (subjects with parental history of diabetes mellitus): and group II (subjects without parental history of diabetes mellitus). They were selected on the basis of questionnaire on “personal information” filled by them. Subjects with any evidence of obesity, obstructive airway disease, asthma, musculo-skeletal abnormality, heart disease, anaemia, smokers or persons with history of drug abuse and those with diagnosed organic or psychiatric illness were excluded from the study.
After signing the informed consent form, the subjects underwent a brief physical examination, to rule out any systemic illness. Anthropometric data such as height, weight and body mass index were measured.
Baseline parameters: Pulse and blood pressure was measured and lead II ECG was recorded in all subjects for 5min using the Powerlab 8/30 of AD instruments.
Exercise protocol: After recording the baseline parameters, the subjects were asked to hold the grip of hand grip dynamometer in the dominant hand and compress the handle with maximum effort and the tension developed was measured (T1). The procedure was repeated and T2 was recorded. Tmax was calculated as an average of T1 and T2. 30% of Tmax was calculated and the subject was asked to perform the exercise at 30% of Tmax for 5min. After completion of isometric exercise, pulse rate and blood pressure were recorded immediately and at 1, 5 and 20 min. ECG recording was resumed and recorded till 20 min postexercise.
Data Acquisition: The baseline and post-exercise ECG was analysed to obtain QTc interval and LH:HF ratio using the Lab Chart Pro V7 software installed in the system.
Statistical Analysis: All values are expressed in mean ± standard deviation. SPSS version 17 was used for statistical analysis. Paired t-test was done to compare the pre and post exercise QTc values within the group. Unpaired t-test was done to compare means between group I and group II and males and females. Mann Whitney U-test was done to compare the LF:HF values. The QTc and LF: HF was correlated using Pearson correlation.
Results
The study was conducted in 29 subjects; of whom 14 reported a parental history of diabetes mellitus while the remaining 15 had no such history.
Anthropometric data
The anthropometric data namely, height, weight and BMI were comparable in both the groups [Table/Fig-1].
The table shows the anthropometric data of Group I and II. The observed differences in the values were not statistically significant
| Height (cm) | Weight (kg) | BMI |
|---|
| Group I (n=14) | 170.86 ± 8.19 | 61.43 ± 12.14 | 20.87 ± 2.50 |
| Group II (n=15) | 198.18 ± 9.73 | 62.00 ± 8.46 | 22.05 ± 2.5 |
Pre and post exercise QTc values: The mean pre-exercise QTc value was 329.79 ± 41.183 msec in the group I subjects and 362.07 ± 44.818 msec, in the group II subjects. Similarly the post-exercise QTc values were 330.07 ± 38.108 msec and 362.47 ± 43.182 msec in group I and group II respectively. The observed difference in the pre as well as post-exercise QTc values between the two groups was statistically significant with the group I subjects recording lower values. The difference in pre and post exercise QTc values also attained statistical significance within the same group with a longer interval recorded post-exercise [Table/Fig-2].
The table shows the pre and post exercise QTc values in msec (mean ± SD) in Group I and II. Both the groups showed a post exercise prolongation of QTc duration. Paired t test was done to compare the values within the same group whereas unpaired t test was done to compare means between two groups
| Pre-exercise QTc in msec | Post-exercise QTc in msec |
|---|
| Group I (n=14) | 329.79 ± 41.183* | 330.07 ± 38.108† |
| Group II (n=15) | 362.07 ± 44.818 | 362.47 ± 43.182† |
* p< 0.05 denotes comparison between Group I and II
† p<0.05 denotes comparison of pre and post exercise values within the same group
The table shows the pre and post exercise LF: HF values (mean ± SD) in Group I and II. The LF: HF showed a statistically significant increase in both the groups during the post exercise period
| Pre-exercise LF :HF | Post-exercise LF :HF |
|---|
| Group I (n=14) | 2.58 ± 1.23* | 2.86± 1.03† |
| Group II ( n=15) | 3.42 ± 1.86 | 3.65±2.26† |
* p< 0.05 denotes comparison between Group I and II
† p<0.05 denotes comparison of pre and post exercise values within the same group
Pre and post exercise LF: HF values: The LF: HF was 2.58 ± 1.23 and 3.42 ± 1.86 pre-exercise and 2.86 ± 1.03 and 3.65 ± 2.26 post-exercise in Group I and II respectively. The subjects in group I had significantly lesser LF: HF values than those of group II. The post-exercise LF: HF values were significantly increased when compared to pre-exercise values in both the groups [Table/Fig-3]. There was no correlation between LF: HF and QTc.
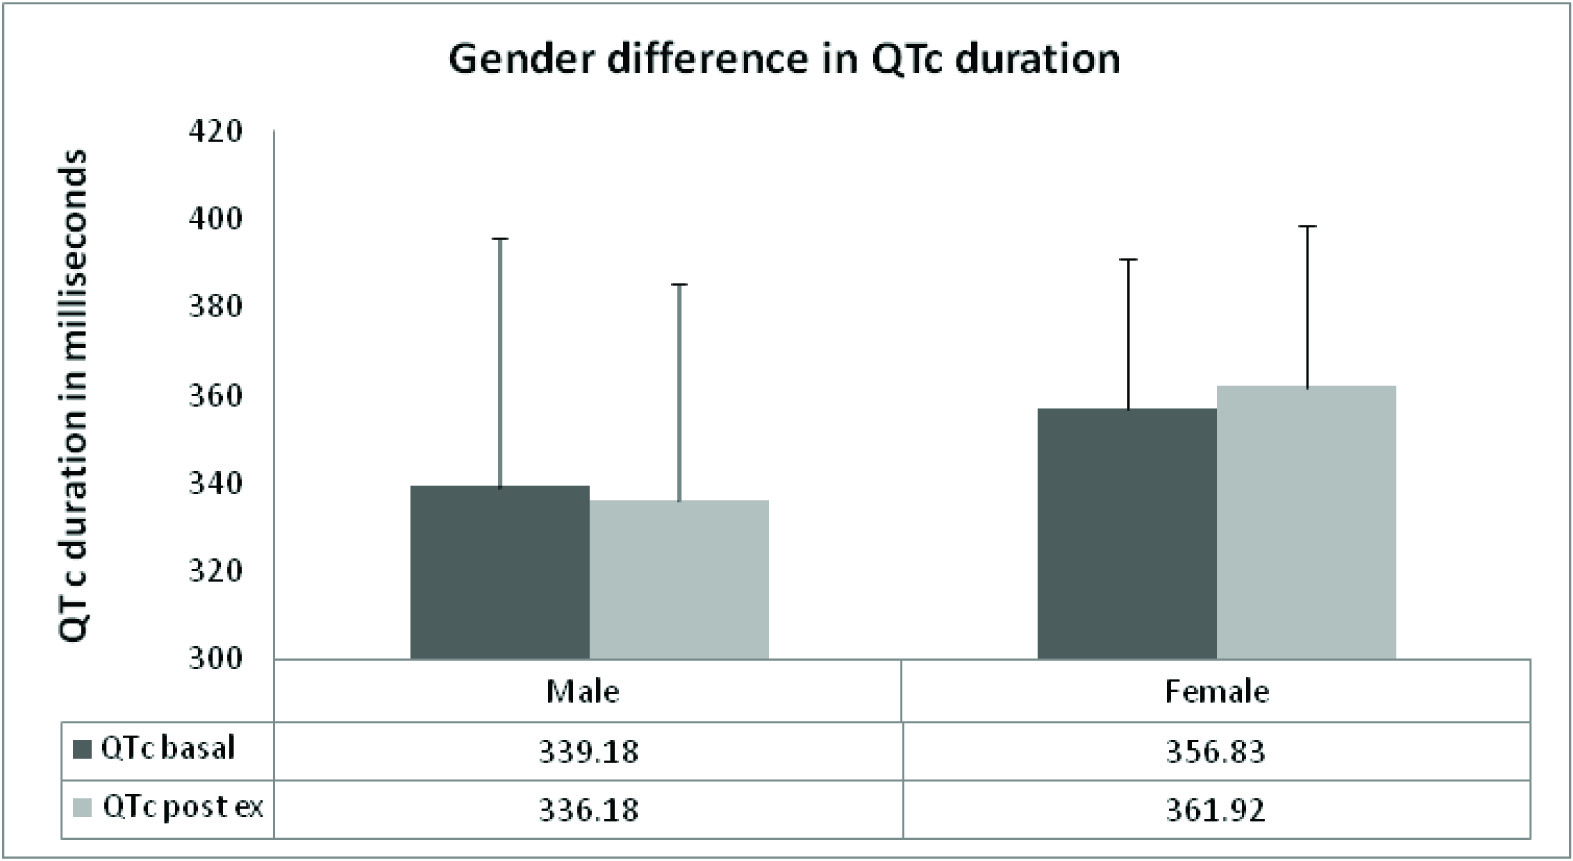
The figure depicts pre and post exercise QTc intervals in male and female subjects. The dark grey bar denotes pre exercise data and the light grey bar denotes the post exercise data. The mean pre and post exercise QTc values in males and females are written in the lower panel of the figure. The females had longer QTc duration as compared to males both before and after exercise. The male subjects exhibited a post exercise shortening of QTc interval. The observed gender differences did not attain statistical significance
Gender differences in QTc
The analysis of QTc values in male and female subjects revealed a longer duration in females as compared to the males in the basal state [Table/Fig-4]. In response to isometric exercise, shortening of QTc interval was observed in the males whereas the females exhibited a prolongation of the interval. However, these differences were not statistically significant.
Discussion
The duration of QTc interval is affected, among other factors by heart rate and the relative activity of sympathetic and parasympathetic nerves. Exercise as well as post-exercise recovery periods are usually associated with parasympathetic withdrawal [19]. Although, heart rate and QTc duration are known to bear an inverse relationship, the effect of autonomic nervous system on QTc is not clearly defined. Low sympathetic activity has been linked with prolonged QTc [20]. On the other hand, as the parasympathetic innervations to the heart demonstrate regional differences, it is difficult to decipher the overall vagal affect on cardiac repolarisation or the QTc interval [21]. It has been suggested that 2/3rd of the exercise induced QT changes are due to heart rate and 1/3rd of the changes are attributable to other factors [22]. Therefore, exercise induced QT changes are variable and difficult to explain.
The results of our study showed a prolongation of corrected QT interval after a period of isometric exercise. It was observed that the offsprings of diabetic parents tended to have shorter QTc intervals, both before and after exercise. We did not come across any study reporting QTc changes in healthy persons with a parental history of diabetes. Studies on diabetic individuals however have reported a longer QTc interval in them [23,24]. Further studies have to be done with a larger sample size to consolidate our observation of a shorter QTc interval in our group I subjects.
Post exercise lengthening of QT interval has also been reported in a study at University of Abuja [25]. A study by 2011 American Heart Association stated that there is substantial individual variability of normal repolarisation process in the post exercise recovery period [26]. Other studies have reported a shortening of QT interval following exercise [10,17,27]. Most of the studies have used pacing, serial sympathetic, parasympathetic or dual blockage to elucidate affect of autonomic nerves and exercise on the QT duration. The exercise protocol used is also different in these studies. A study by Srinath et al., [27] has utilized a similar paradigm as ours wherein they studied the affect of isometric exercise on the QT interval in obese and non obese individuals. They observed a significant decline in QT interval post exercise in both the groups. The authors have attributed the baseline differences in the QT interval to an enhanced sympathetic tone in the obese but they have not elaborated on the post exercise changes in QT interval.
The sympathovagal balance as reflected by the LF: HF ratio derived from analysis of heart rate variability was also within normal limits in all our subjects. The ratio increased in both groups post exercise, indicative of vagal blunting or a sympathetic enhancement. This can be explained on the basis of physiological changes induced by exercise on autonomic nervous system.
On grouping our subjects on the basis of gender, irrespective of parental history of diabetes, we observed that females exhibited a slightly longer QTc as is already reported in the literature [13,28]. The females showed a post exercise lengthening of QTc whereas the male subjects exhibited an exercise induced shortening of QTc. Mayuga et al., [28] have reported that gender differences in QTc disappear at higher heart rates while in our subjects the gender differences persisted after exercise. The contradictory findings may be related to the different exercise regimes used in the two studies as we used isometric exercise whereas Mayuga et al., followed the Bruce protocol.
It is difficult to categorise our findings on the basis of a simple cause and affect model. In our study, the subjects were not exposed to atrial pacing to fix heart rate nor were they exposed to any type of blockers. Therefore, the lengthening of QTc after exercise as demonstrated by us probably reflects a combined affect of heart rate and autonomic nervous system changes. Although we demonstrated an increase in the LF: HF after exercise which is indicative of parasympathetic hypoactivity, we could not find any statistical correlation between the ratio and QTc. This is probably because of the fact that the LF: HF reflects autonomic tone to the sinus node only and not ventricular tissue [20] whereas QTc interval is the electrocardiographic manifestation of ventricular depolarization and repolarisation. Also the various hemodynamic, metabolic and neuro-humoral factors that come into play during exercise must have been functional in our subjects and affected the QTc interval accordingly [10].
The fact that all values of QTc reported in this study lie within normal limits [29] indicates that our study group comprised of healthy individuals. The shorter but normal QTc duration in group I subjects is possibly due to the fact that it is too early for parental diabetes to produce QTc interval changes in their offsprings.
At this juncture we must comment on the significance of this study. At the outset we had emphasized the fact that sudden death post exercise is a matter of concern. Moreover, various authors have opined that the answer to sudden death, post exercise, may lie in the QTc interval changes [5]. Our study has revealed a prolongation of QTc duration after a period of isometric exercise in normal individuals irrespective of the presence or absence of parental history of diabetes mellitus. A longer than normal QTc interval predisposes to fatal arrhythmia [15]. In our study, we observed that exercise brings about detectable lengthening in the QTc interval. Though, these changes are well within the normal limits in healthy subjects, they do have an arrhythmogenic potential and may explain post exercise sudden cardiac death in high risk individuals. In addition, the findings of our study also explain the higher incidence of arrhythmia in women [30].
Conclusion
Women may be more susceptible to unfavourable cardiac events, post exercise owing to a longer QTc even at rest. We propose to continue this study in a larger number of subjects in order to consolidate the findings of this preliminary study.
* p< 0.05 denotes comparison between Group I and II
† p<0.05 denotes comparison of pre and post exercise values within the same group
* p< 0.05 denotes comparison between Group I and II
† p<0.05 denotes comparison of pre and post exercise values within the same group
[1]. Ekblom R, Goldbarg A, Kilbom A, Astrand P, Effects of atropine and propranolol on oxygen transport system during exercise in manScand J Clin Lab Invest 1972 30:35-42. [Google Scholar]
[2]. Fagraeus L, Linnarsson D, Autonomic origin of heart rate fluctuations at the onset of muscular exerciseJ App Physiol 1976 40:679-82. [Google Scholar]
[3]. Joyner MJ, Green DJ, Exercise protects the cardiovascular system: effects beyond traditional risk factorsJ Physiol 2009 587:5551-58. [Google Scholar]
[4]. Gielen S, Schuler G, Adams V, Cardiovascular effects of exercise trainingCirculation 2010 122:1221-38. [Google Scholar]
[5]. Albert CM, Mittleman MA, Chae CU, Lee IM, Hennekens CH, Manson JE, Triggering of sudden death from cardiac causes by vigorous exertionN Engl J Med 2000 343:1355-61. [Google Scholar]
[6]. Thayer JF, Yamamoto SS, Brosschot JF, The relationship of autonomic imbalance, heart rate variability and cardiovascular disease risk factorsInt J Cardiol 2010 141(2):122-31. [Google Scholar]
[7]. Narayanaswamy N, Moodithaya S, Halahalli H, Mirajkar AM, Assessment of Risk Factor for Cardiovascular Disease Using Heart Rate Variability in Postmenopausal Women: A Comparative Study between Urban and Rural Indian WomenISRN Cardiol 2013 11:858921 [Google Scholar]
[8]. Master AM, Oppenheimer ET, A simple exercise tolerance test for circulatory efficiency with standard tables for normal individualsAm J M Sc 1929 177:223-43. [Google Scholar]
[9]. Master AM, Nuzie S, Brown RC, Parker RC, The electrocardiogram and the “two- step” exercise: a test of cardiac function and coronary insufficiencyAm J M Sc 1944 207:435 [Google Scholar]
[10]. Paul N G YU, Bruce R A, Lovejoy F W, Pearson R, Observations on the change of ventricular systole (QT interval) during exerciseJ Clin Invest 1950 29:279-89. [Google Scholar]
[11]. Ahnve S, Vallin H, Influence of heart rate and inhibition of autonomic tone on the QT intervalCirculation 1982 65:435-39. [Google Scholar]
[12]. Indik J H, Pearson E C, Fried K, Woosley R L, Bazett and Fridericia QT correction formulas interfere with measurement of drug induced changes in QT intervalHeart Rhythm 2006 3:1003-07. [Google Scholar]
[13]. Omiya K, Sekizuka H, Kida K, Suzuki K, Akashi YJ, Ohba H, Influence of gender and types of sports training on QT variables in young elite athletesEur J Sport Sci 2014 14(1):S32-8. [Google Scholar]
[14]. Milne JR, Camm AJ, Ward DE, Spurrell R, Effect of intravenous propranolol on QT interval: a new method of assessmentBr Heart J 1980 43:1-6. [Google Scholar]
[15]. Cubeddu LX, QT prolongation and fatal arrhythmias: a review of clinical implications and effects of drugsAm J Ther 2003 10:452-57. [Google Scholar]
[16]. Cappato R, Alboni P, Pedroni P, Gilli G, Antoniols GE, Sympathetic and vagal influences on rate dependent changes of QT interval in healthy subjectsAm J Cardiol 1991 68:1188-93. [Google Scholar]
[17]. Chinushi M, Sato A, Lijima K, Suzuki K, Exercise related QT interval shortening with peaked T wave in a healthy boy with family history of sudden cardiac deathsPacing Clin Electrophysiol 2012 5(8):234-42. [Google Scholar]
[18]. Sztajzel J, Heart rate variability: a non invasive electrocardiographic method to measure the autonomic nervous systemSwiss Med Wkly 2004 134:514-522. [Google Scholar]
[19]. Andre D, Jens J, John RS, David R, Italo B, Modulation of QT interval during autonomic nervous system blockade in humansCirculation 2002 106:2238-43. [Google Scholar]
[20]. Randall W, Wurster R, Peripheral innervations of the heart in Vagal control of the heart: Experimental basis and clinical implications, edited by Levy M and Schwartz P. Armonk 1993 New YorkFutura:21-32. [Google Scholar]
[21]. Kannankeril PJ, Goldberger JJ, Parasympathetic effects on cardiac electrophysiology during exercise and recoveryAm J Physiol Heart Circ Physiol 2002 282:H2091-98. [Google Scholar]
[22]. Davey PP, Batemam JJ, Heart rate and catecholamine contribution to QT interval shortening on exerciseClin Cardiol 1999 22:513-18. [Google Scholar]
[23]. Riabykina GV, Laptev DN, Seid-Guseinov AA, Changes of QT interval duration in children and adolescents suffering from type 1 diabetes mellitusKardiologiia 2007 47:35-38. [Google Scholar]
[24]. Suys BE, Huybrecht SJ, De Wolf D, Op De Beeck L, Matthys D, Van Overmeire B, QTc interval prolongation and QTc dispersion in children and adolescents with type 1 diabetesJ Pediatr 2002 14:59-63. [Google Scholar]
[25]. Ogedengbe JO, Adelaiye AB, Kolawole OB, Effects of exercise on PR intervals, QRS durations and QTc intervals in male and female students of University of AbujaJ Pak Med Assoc 2012 62:273-75. [Google Scholar]
[26]. Berger WR, Gow RM, Kamberi S, Cheung M, Smith KR, Davis AM, The Qt and corrected QT interval in recovery after exercise in childrenCirc Arrhythm Electrophysiol 2011 4:448-55. [Google Scholar]
[27]. Srinath CG, Ravipati S, Cardiovascular response to isometric handgrip exercise test in obese and normal weight young adultsInt J of Biomed Research 2011 11:554-60. [Google Scholar]
[28]. Mayuga KA, Parker M, Sukthanker ND, Perlowski A, Schwartz JB, Kadish AH, Effects of age and gender on the QT response to exerciseAm J Cardiol 2001 87:163-67. [Google Scholar]
[29]. Ilan G, Arthur JM, Wojciech Z, Qt interval: how to measure it and what is normalJ Cardiovasc Electrophysiol 2006 17:333-36. [Google Scholar]
[30]. Villareal RP, Woodruff AL, Massumi A, Gender and cardiac arrhythmiasTex Heart Inst J 2001 28(4):265-75. [Google Scholar]