Background
In the field of diagnostic research the term ‘gold standard’ (GS) test is gradually being replaced with the term ‘reference standard’ test. This is because tests that can be considered perfect with 100% sensitivity and specificity are uncommon in reality. There is always an element of misclassification. However, such a test might be the only reference available against which newer tests can be evaluated and hence the name. Many conscious researchers have tried to highlight this issue, but it remains largely within the confines of academic interest rather than being applied practically [1,2].
In evaluating a new test (or index test) against an existent test which is not considered a GS test, we only assess if the new test is as good as the old one in terms of validity measures, and also look for added advantages (low cost, easy handling or field robustness that the old one doesn’t have) i.e., we measure ‘agreement’ between the two tests. When the existent test is considered a GS test our aim changes and we now try to see how close is the new test to the GS test or how it performs compared to alternatives. In the case of infectious diseases, the GS and the index tests often measure two different aspects of disease manifestation. The GS test often verifies the physical presence of an organism by culture, microscopy or other techniques, whereas the newer, cheaper and easier test measures antibodies or antigens or genetic materials, which are considered corroborative evidence to the presence of disease. The performance of these tests may also vary with the duration of illness. For example, a test may only be good in the early stages of the disease. This phenomenon adds further to the problem of imperfect GS tests. In this article we specifically try to look at the imperfectness of GS or reference standard test from the temporality view point and then try to explain its effect on the interpretation of diagnostic test studies.
We will use the example of typhoid fever to explain this concept because of its typical nature. But the discussion is relevant to any infectious disease with similar host-agent interaction. Also, to keep it simple we have only discussed changes in sensitivity as the validity measure but changes in specificity are also important.The GS test for typhoid fever is blood culture but clinically antibody tests are commonly used for diagnosis because they are quicker and cheaper.
Effect of Disease Duration on The Performance of Tests
We will discuss briefly the pathogenesis of typhoid fever. The typhoid bacteria enter the body via the oral route, spread throughout the body and increase in number by multiplication. In the first week of illness the bacterial concentration in blood is maximal, in the second and subsequent weeks due the host immune response the bacterial count in blood declines. This phenomenon reflects itself in the decreasing sensitivity of the blood culture, which is maximal (90%) in the first week and declines thereafter to around 60% in the third week or so (as measured against bone marrow culture – ‘supra’ GS test) [3–5]. Bone marrow culture is not used for routine diagnosis because it requires expertise and has associated risks involved. This declining sensitivity is due to the fact that culture medium allows growth only if the bacterial concentration in blood is above a minimum level. In the host immune response, the first antibody type to increase is the IgM fraction which becomes detectable towards the end of first week; its concentration continues to increase and then declines by the end of third week. The IgG fraction rises a bit later than IgM and peaks by the end of second week and then persists at varying levels for upto two years. This rise in antibodies is the reason for the decline in bacterial count (and hence the sensitivity of blood culture) and this is also the reason for the rise in antibody test’s sensitivity. We have depicted this interplay in a graph [Table/Fig-1]. The dashed line depicts the declining sensitivity of the blood culture with time. The continuous line depicts the increasing sensitivity of the antibody test with time.Three arbitrary vertical lines divide this graph into three comparative scenarios.
Varying sensitivities of the blood culture and antibody tests over time in typhoid fever
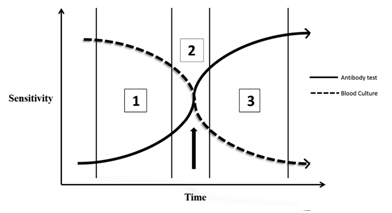
Scenario 1: In the first week of illness, sensitivity of the culture is greater than that of the antibody test.
Scenario 2: In the second week of illness, sensitivity of the culture is almost equal to that of the antibody test.
Scenario 3: In the third and subsequent weeks of illness, sensitivity of the culture is lesser than that of the antibody test.
These three time frames are arbitrary and do not strictly confine themselves to the weeks described, rather they give a sense of the temporality of this phenomenon. Beyond a certain time point as indicated by the arrow, the GS test’s sensitivity falls below that of the index test. The index test now becomes superior to the GS test and the GS is in no position to correctly validate the index test. The limitations of GS (GS) test come to light in the presence of a higher standard albeit non-practical test - in typhoid fever this ‘supra’ GS test is the bone marrow culture.
Reference Standard Misclassification – The Temporal Dimension
Biesheuvel et al., [6] have discussed the concept of ‘reference standard misclassification’ and how it affects diagnostic test studies with elegant graphs and numerical examples. Reference standard misclassification occurs when the GS is imperfect and it misclassifies a proportion of truly diseased into non-diseased or vice versa. Here we have tried to extend this concept by adding to it the temporal dynamics of agent-host interaction and to explain how it affects the interpretation of diagnostic test studies. The discussion will progress through a series of figures. The performance as discussed here refers to the sensitivity of the tests. The dashed line indicates performance of the GS test and the continuous line indicates the performance of the index test.
Situation I
[Table/Fig-2]
Different scenarios depicting the relation between GS (GS) test, index test (IT) and time
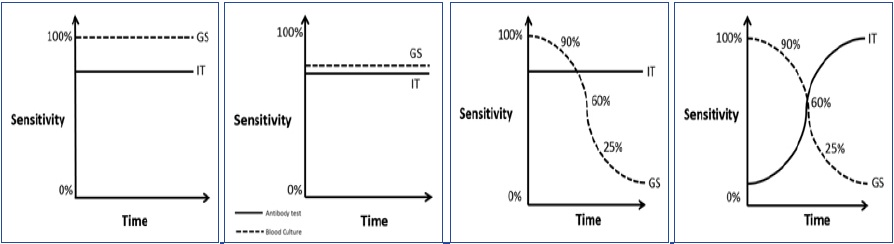
The GS test is perfect i.e., it has 100% sensitivity. This is the ideal situation for testing the index test, and also where the performances of the two tests are time independent, a rare occurrence in infectious diseases.This situation will provide an unbiased estimate of the index test’s sensitivity.
Situation II
[Table/Fig-3]
Consider this situation where the GS test has sub-optimal sensitivity (also known as tarnished or imperfect GS). Here the GS test misclassifies a proportion of truly diseased into false negative and a fixed proportion of non-diseased into false positive, the final effect of which will depend on the sample prevalence. In a high prevalence situation specificity of the index test will be more underestimated and in a low prevalence situation sensitivity of the index test will be more underestimated. In such a situation, our aim is to see if the index test (with the added advantages) is as good as the existent sub-optimal test, so that the old can be replaced with the new. This situation is less ideal than the previous one, but atleast both the tests have time independent performances.
Situation III
[Table/Fig-4]
Here, the GS test’s performance is time dependent - as the illness duration increases the GS test becomes less sensitive, however the index test has time independent performance. In such a situation the index test’s performance will be underestimated if the sample units are largely distributed in the later time frames, the underestimated measure may be sensitivity or specificity depending upon the sample prevalence, as described before. The converse of this situation is also possible, where the GS remains stable and the index test changes with time will lead to varying estimates of validity depending upon the distribution of sample units in the different time frames.
Situation IV
[Table/Fig-5]
Here the situation has reached maximum complexity - both the GS and index tests are time dependent. This is the situation that we had explained at the beginning of this discussion. With such dynamism it is difficult to predict the change in direction and magnitude of the effects. The results will again depend upon of the proportion of sample units distributed across the different time frames.
Role Change Phenomenon
Diagnostic test studies in typhoid fever research deal with this problem in two general ways. Firstly, the study may at the design stage itself explicitly state their inclusion criteria that will select only patients in specified time frames. Intuitively, such designs are impractical, have limited generalizability ability and hence rare. In the second approach, week wise subgroup analysis is done to try and demonstrate increase in sensitivity of the index test for those subgroup of patients who are in later stages of the illness. Examples of such studies include those done by Oslen SJ et al., [7]. Although not perfect strategies, these studies help the readers to apply their discretion at interpreting the results.It is also prudent of such studies to acknowledge the fact that in the later phase of illness, the false positives identified by the index test might be ‘truly positive’ as the blood culture has a sensitivity lower that of the index test. We would like to call this phenomenon the ‘role change’; as the ‘gold’ standard becomes ‘alloyed’ and the index test becomes the new ‘gold’ beyond defined time point i.e., their prior roles have been interchanged. This type of bias needs to be distinguished from the usual reference standard misclassification. It could be thought of as a ‘dynamic misclassification’. It is ‘one way’ when the GS alone is time dependent and ‘two way’ when both the GS and index tests are time dependent. Although the two methods mentioned above to deal with this ‘role change’ are not optimal solutions they are commonly found in literature. More optimal solutions may involve use of complex statistical methods [8].
A Brief Review
To evaluate the knowledge existing among researchers about reference standard misclassification specifically with reference to typhoid fever diagnostic studies and to identify the various strategies adopted by them to adjust for it, a literature review was undertaken. The search was conducted with the key words ‘typhoid diagnostic test’, ‘typhoid antibody tests’, ‘typhidot’, ‘tubex’, ‘widal’, ‘blood culture’ ‘reference standard misclassification’ ‘evaluation’, ‘sensitivity’, ‘specificity’, ‘validity’ using MEDLINE database. Selection criteria for articles included in the review were as follows: Study participants were clinically suspected to be typhoid cases, diagnostic test to be evaluated was Tubex, Typhidot or Widal, GS test was blood culture or a composite criteria, outcome was measured in terms of sensitivity and specificity and setting was hospital or community. Only articles published in english between 2006 and 2011were selected for review. After screening the study titles, 20 articles were selected for review. Out of which 4 articles were only description of diagnostic tests. The remaining 16 articles were taken up for further review [Table/Fig-6].
Review of studies evaluating validity of typhoid fever antibody tests published between 2006 and 2011
| Author & year of publication (ref no.) | Setting | Inclusion criteria | GS/ comparator tests | Index test(s) | Sensitivity and specificity (%) | Mentioned about RSM | Steps taken to adjust for RSM | Change in sensitivity/specificity after modified analysis |
|---|
| Sethi S,2006 [9] | Hospital | Clinical enteric fever patients | Blood Culture | Typhidot | 96, 86 | No | None | NA |
| Widal | 60,100 |
| Dutta S,2006 [10] | Community | Fever of 3 days or more | Blood culture | Typhidot | 47, 83 | No | Analysis restricted to ≤5 days, >5 days | NA |
| TUBEX | 47, 83 |
| Widal | 54, 84 |
| Jesudason MV, 2006 [11] | Hospital | Clinically suspected cases | Blood culture | Typhidot | 92, 99 | No | None | NA |
| Kawano RL, 2007 [12] | Hospital | Febrile patients suspected of typhoid mean age 2.5 years | Blood culture | TUBEX | 95, 80 | No | None | NA |
| SD Bioline IgM/IgG | 69, 79/71, 76 |
| Typhidot IgM/IgG | 55, 65/73, 46 |
| Mega IgM/IgG | 91, 49/96, 39 |
| Abdoel TH,2007 [13] | Hospital | Continuous high grade fever, toxic appearance and the presence of constitutional symptoms Age 7 - 55 years | Blood culture & Blood culture or compatible clinical picture or Widal test | Latex agglutination assay | Culture - 43, 57 Composite - 43, 97 | Yes, not explicitly | Composite standard, Agreement analysis, Duration wise analysis | Sensitivity and specificity increased across 4-6 days, 7-9 days & >9 days |
| Widal O antigen test | Culture - 49, 69 Composite - 39, 98 | Sensitivity and specificity decreased at 7-9 days and then increased |
| Prakash P,2007 [14] | Hospital | Children aged 1 - 12 years suspected of having typhoid fever | Blood culture | Typhidot IgM/IgG, WIDAL | NA | Yes | Duration wise analysis | NA |
| Rahman M,2007 [15] | Hospital | Patients presenting with fever > 3 days | Blood culture | TUBEX | 91, 82 | Yes | Subgroup analysis by excluding healthy non-febrile patients | Increase in specificity |
| Widal | 82, 70 |
| Naheed A,2008 [16] | Community | Fever of any duration for children <5 years old and fever of >3 days of duration for persons >5 years | Blood culture | TUBEX | 60, 64 | No | Duration wise analysis | NA |
| Typhidot | 67, 55 |
| Pastoor R,2008 [17] | Hospital | Patients presenting with clinical suspicion of typhoid Fever | Blood culture, Widal, clinical findings, response to treatment | Typhoid fever IgM flow assay | 62.1, 98 | Yes, not explicitly | Duration wise analysis | Sensitivity increased to 89.5% for patients presenting 3 days later |
| Begum Z,2009 [18] | Hospital | Clinical diagnosis | Blood culture and/or Widal | Widal test | 43, 85 | No | Composite standard | NA |
| Narayanappa D, 2010 [19] | Hospital | Age group of 1-15 years, who presented with fever of 5 days or more with clinical symptoms and signs suggestive of typhoid fever | Blood culture | Typhidot IgM | 92.6, 38 | Yes, not explicitly | Duration wise analysis | Sensitivity 96.9% in > 1 week patients, 100% for patients with fever 5-6 days, decreased for Widal |
| Widal | 34, 43 |
| Beig FK,2010 [20] | Hospital | Fever of ≥ 4 days with clinical suspicion of typhoid age 6 months to 12 years | Blood culture / Clinical diagnosis | Widal | 40, 91 | No | None | NA |
| Clinical diagnosis | Typhidot IgM | 90, 100 |
| Ley B,2011 [21] | Hospital | Children 2 m - 14 yr with history of 3 days of fever, or fever <3 days with at least 1 severity criteria | Blood culture | TUBEX | 79, 89 | No | None | NA |
| Keddy KH,2011 [22] | Hospital | Suspected typhoid fever with History of fever or documented fever >38 degree C | Blood culture | Widal (all anitgens) | 4-50, 80-95 | No | None | NA |
| TUBEX | 69, 73 |
| Typhidot IgM | 61, 75 |
| Typhidot IgG | 71, 70 |
| Hayat AS, 2011 [23] | Hospital | Group A (19)- positive blood culture; Group B (24) - febrile controls; Group C (24)- healthy controls. Aged - 18-45 years | Blood culture | Typhidot IgM | 95, 90 | No | None | NA |
| Fadeel MA, 2011 [24] | Hospital | Fever lasting for at least two days or temperature of ≥ 38.5°C | Culture or Widal positive | TUBEX | 75, 85 | No | None | NA |
| Typhidot IgG/IgM | 28-63/95-99 |
Footnote: NA – Not Available.
Majority of the studies were hospital based [9, 10–15, 16–24] and only two were done in community settings [10,16]. Most of the studies included patients who were clinically suspected as having typhoid fever. Blood culture was taken as GS test across all studies and a few studies had used a composite standard which included an extra test in addition to blood culture. Widal test was the most common second test to be included in the composite ‘standard’. Of the 16 studies reviewed, the possibility of reference standard misclassification was discussed explicitly in only two studies [14,15] and inferred implicitly in three studies [13,17,19] and the remaining studies did not mention it [9–12,16,18, 20–24]. The common strategies adopted in the articles that came closer to having adjusted/explained RSM were - using a composite standard [13, 17, 18], duration wise analysis (or restriction of analysis to patients presenting within a predefined week/day of illness) [10,13,14,16, 17,19], and agreement analysis [13]. Even though some studies have not mentioned RSM, they have taken steps that could adjust for this [10,16,18]. Atleast four [13,15,17,19] of the studies after doing modified analysis were able to show that there was change in the validity of the index tests. As far the temporality part of the problem goes, none of the 16 articles mentioned it, however certain articles [10, 13, 14, 16, 19] have done analyses that would probably take care of this in a primitive manner. This review reveals that a large proportion of studies have ignored the possibility of reference standard misclassification and its implication in study interpretation, let alone taking cognizance of the temporality of this phenomenon.
Possible Solutions for Imperfect GS or Lack of GS Test
The question that remains is how to design a study, which will take care of this temporality or account for it? There are certain ways to overcome the problem of imperfect GS or lack of GS test. A composite standard is one where we put together several component tests and set a minimum requirement to be fulfilled by a true case. This kind of composite standard may seldom find use outside research settings in lieu of high cost. As mentioned previously when there is no GS, the aim of our study is to prove that the new test agrees with the old test to an acceptable level, which is known as agreement analysis. Reitsma JB et al., [8] provide a good description of how to estimate the error rates of diagnostic tests when there is no GS test i.e., by the use of maximum likelihood estimation methods applied to latent class intervals.
Possible Solutions For The Temporality Problem
As for the temporality of the problem there is no simple solution. A multilevel modeling can be done with time as one of the levels. This will adjust for the time dependent variations of the test performance. We could alternately recruit equal proportions of patients in different phases of illness and calculate a separate validity measure for each subgroup. This will help us better understand how the test performance varies with time. Further research is required to better understand this phenomenon and design ways to adjust for it.
Conclusion
It is imperative that researchers involved in diagnostic test studies take into account the possibility of their GS being imperfect and design their study to prevent such bias or in the event of such failure atleast try to account for it in the analysis so that valid inferences can be made.It is important to consider the possibility of ‘role change’ and expect it in any diagnostic test study dealing with infectious diseases like typhoid fever, where the GS and index tests measure two different time related evidences of disease presence or absence.
[1]. Boyko EJ, Alderman BW, Baron AE, Reference test errors bias the evaluation of diagnostic tests for ischemic heart diseaseJ Gen Intern Med 1988 3:476-81. [Google Scholar]
[2]. Valenstein PN, Evaluating diagnostic tests with imperfect standardsAm J Clin Pathol 1990 93:252-58. [Google Scholar]
[3]. WHO Background document: The diagnosis, treatment and prevention of typhoid fever. Communicable Disease Surveillance and Response, Vaccines and Biologicals, 2003. (Available at whqlibdoc.who.int/hq/2003/WHO_V&B_03.07.pdf; accessed on 14.10.2011) [Google Scholar]
[4]. Wain J, Diep TS, Ho VA, Quantitation of bacteria in blood of typhoid fever patients and relationship between counts and clinical features, transmissibility, and antibiotic resistanceJ Clin Microbiol 1998 36(6):1683-87. [Google Scholar]
[5]. Ananthanarayanan R, Panicker CKJ, Textbook of microbiology 2005 8th edIndiaOrient BlackSwan/Universities Press [Google Scholar]
[6]. Biesheuvel C, Irwig L, Bossuyt P, Observed differences in diagnostic test accuracy between patient subgroups: is it real or due to reference standard misclassification?Clin Chem 2007 53(10):1725-29. [Google Scholar]
[7]. Olsen SJ, Pruckler J, Bibb W, Evaluation of rapid diagnostic tests for typhoid feverJ Clin Microbiol 2004 42(5):1885-89. [Google Scholar]
[8]. Reitsma JB, Rutjes AW, Khan KS, A review of solutions for diagnostic accuracy studies with an imperfect or missing reference standardJ Clin Epidemiol 2009 62(8):797-806. [Google Scholar]
[9]. Sethi S, Sharma S, Das A, Evaluation of typhoid assay for rapid diagnosis of typhoid feverJ Assoc Physicians India 2006 54:159 [Google Scholar]
[10]. Dutta S, Sur D, Manna B, Evaluation of new-generation serologic tests for the diagnosis of typhoid fever: data from a community-based surveillance in Calcutta, IndiaDiagn Microbiol Infect Dis 2006 1 56(4):359-65. [Google Scholar]
[11]. Jesudason MV, Sivakumar S, Prospective evaluation of a rapid diagnostic test Typhidot for typhoid feverIndian J. Med. Res 2006 123(4):513-16. [Google Scholar]
[12]. Kawano RL, Leano SA, Agdamag DMA, Comparison of serological test kits for diagnosis of tyhoid fever in the PhilippinesJ. Clin. Microbiol 2007 45(1):246-7. [Google Scholar]
[13]. Abdoel TH, Pastoor R, Smits HL, Laboratory evaluation of a simple and rapid latex agglutination assay for the serodiagnosis of typhoid feverTrans. R. Soc. Trop. Med. Hyg 2007 101(10):1032-38. [Google Scholar]
[14]. Prakash P, Sen MR, Mishra OP, Dot enzyme immunoassay (Typhidot) in diagnosis of typhoid fever in childrenJ. Trop. Pediatr 2007 53(3):216-17. [Google Scholar]
[15]. Rahman M, Siddique AK, Tam FC-H, Rapid detection of early typhoid fever in endemic community children by the TUBEX O9-antibody testDiagn. Microbiol. Infect. Dis 2007 58(3):275-81. [Google Scholar]
[16]. Naheed A, Ram PK, Brooks WA, Clinical value of Tubex and Typhidot rapid diagnostic tests for typhoid fever in an urban community clinic in BangladeshDiagn. Microbiol. Infect. Dis 2008 61(4):381-86. [Google Scholar]
[17]. Pastoor R, Hatta M, Abdoel TH, Simple, rapid, and affordable point-of-care test for the serodiagnosis of typhoid feverDiagn. Microbiol. Infect. Dis 2008 61(2):129-34. [Google Scholar]
[18]. Begum Z, Hossain MA, Musa AK, Comparison between DOT EIA IgM and Widal Test as early Diagnosis of Typhoid FeverMymensingh Medical Journal 2009 18(1):13-7. [Google Scholar]
[19]. Narayanappa D, Sripathi R, Jagdishkumar K, Comparative study of dot enzyme immunoassay (Typhidot-M) and Widal test in the diagnosis of typhoid feverIndian Pediatr 2010 47(4):331-33. [Google Scholar]
[20]. Beig FK, Ahmad F, Ekram M, Typhidot M and Diazo test vis-à-vis blood culture and Widal test in the early diagnosis of typhoid fever in children in a resource poor settingBraz J Infect Dis 2010 14(6):589-93. [Google Scholar]
[21]. Ley B, Thriemer K, Ame SM, Assessment and comparative analysis of a rapid diagnostic test (Tubex®) for the diagnosis of typhoid fever among hospitalized children in rural TanzaniaBMC Infect. Dis 2011 11:147 [Google Scholar]
[22]. Keddy KH, Sooka A, Letsoalo ME, Sensitivity and specificity of typhoid fever rapid antibody tests for laboratory diagnosis at two sub-Saharan African sitesBull. World Health Organ 2011 1 89(9):640-47. [Google Scholar]
[23]. Hayat AS, Shah SIA, Shaikh N, Evaluation of Typhidot (IgM) in early and rapid diagnosis of Typhoid feverProfessional Med J 2011 18(2):259-64. [Google Scholar]
[24]. Fadeel MA, House BL, Wasfy MM, Evaluation of a newly developed ELISA against Widal, TUBEX-TF and Typhidot for typhoid fever surveillanceJ Infect Dev Ctries 2011 5(3):169-75. [Google Scholar]