Association of High Sensitivity C-Reactive Protein with the Components of Metabolic Syndrome in Diabetic and Non-Diabetic Individuals
Manoj Sigdel1, Arun Kumar2, Prajwal Gyawali3, Rojeet Shrestha4, Eans Tara Tuladhar5, Bharat Jha6
1 Lecturer, Department of Biochemistry, Manipal College of Medical Sciences, Pokhara, Nepal.
2 Assistant Professor, Department of Biochemistry, College of Medicine, West Bengal University of Health Science, Kalyani, Nadia.
3 Phd fellow, Charles Sturt University, New South Wales, 2640, Australia
4 Assistant professor, Hokkaido University, Japan.
5 Assistant Professor, Department of Biochemistry, Institute of Medicine, Kathmandu, Nepal.
6 Professor and Head, Department of Biochemistry, Institute of Medicine, Kathmandu, Nepal.
NAME, ADDRESS, E-MAIL ID OF THE CORRESPONDING AUTHOR: Mr. Manoj Sigdel Department of Biochemistry, Manipal College of Medical Sciences, Fulbari 11, Pokhara, Nepal, P O Box No. 155
Phone: +9779846481107,
E-mail: clinchem.manoj@gmail.com
Background and Objectives: High sensitivity C-reactive protein (hsCRP) has been associated with metabolic syndrome (MetS) and its components. Several studies have suggested hsCRP to be used as a marker for the primary prevention of cardiovascular diseases. So, we aimed to evaluate the association between hsCRP levels and the components of MetS in diabetic and non-diabetic population.
Materials and Methods: Type II diabetic patients (T2DM) (n= 121) and healthy controls (n= 121) were enrolled for the study. Anthropometric measurements were taken along with blood pressure from the arm. Ten ml of blood was collected after overnight fasting for the measurement of lipid profile, hsCRP, C-peptide and glucose levels. Insulin resistance (HOMA2-IR) was estimated by HOMA2 calculator utilizing glucose and C-peptide values. All participants were classified into two groups on the basis of the presence or absence of MetS. Data were analysed through SPSS 14 software.
Results: hsCRP, C-peptide and HOMA2-IR were significantly higher in T2DM subjects when compared with controls. As the number of the components of MetS increased, there was a linear increase in hsCRP levels in whole study population (p trend <.001), diabetic subjects (p trend <.001), as well as in controls (p trend <.001). HOMA2-IR and hsCRP levels were found to be better than LDL cholesterol and waist circumference for predicting the presence of MetS.
Conclusion: hsCRP was found to be better than LDL cholesterol and waist circumference for the prediction of MetS. Hence, hsCRP could be used as a defining marker of MetS in the near future.
C-peptide, HOMA2 calculator, Insulin resistance
Introduction
Chronic low grade inflammation has been hypothesized to play a role in the development of type II diabetes mellitus (T2DM) and metabolic syndrome (MetS) [1,2]. Several studies have shown significant association of high sensitivity C-reactive protein (hsCRP) with the components of MetS [3,4]. American Heart Association has indicated that hsCRP measurements might provide information for a global risk assessment for coronary heart disease beyond that obtained from the established risk factors [5]. hsCRP has been suggested to be used as a marker for the primary prevention of cardiovascular diseases (CVD) [6]. The level of this marker, however, is known to vary among populations, influenced by gender, age, and obesity [7]. South east Asians are known to be at a high risk for T2DM, CVD, and MetS [8,9]. There has been a paucity of evidence from this part of world including Nepal regarding hsCRP level in health and diseases. In this context, the objective of our study is to evaluate the association between hsCRP levels and the components of MetS in diabetic and nondiabetic population.
Materials and Methods
Study participants
This is a cross sectional study conducted from March to August 2010 at Institute of Medicine, Tribhuvan University, Nepal. Noninsulin treated T2DM subjects (n= 121) and equal number of healthy controls were recruited from Kathmandu valley, the capital city of Nepal. Exclusion criteria of the participants includes: presence of acute infections, chronic inflammatory diseases, cardiovascular diseases and present smoking status. Furthermore, participants with hsCRP level >10 mg/l, white blood cell count >10,000/ml and creatinine level >1.4 mg/dl were excluded from the analysis. University Institutional Review Board approved the study, and all the subjects provided written consent prior to the recruitment. Diabetes was defined as per the guidelines of ADA, 2009 [10]. International diabetes federation guidelines were used to define MetS [11].
Anthropometric and laboratory measurements
Waist circumference of the participants was measured from the upper margin of the posterior iliac crest at the end of normal expiration directly above the skin. Hip circumference was measured at the maximum extension of the buttocks. Weight and height were recorded. Brachial blood pressure was measured with the automated machine. Ten ml of blood was collected after overnight fasting from the participants. Lipid profile and fasting blood glucose (FBG) was measured by automated clinical chemistry analyser, BT 2000 PLUS. C-peptide was measured by sandwich chemiluminescent immuno assay using semiautomated analyser, EKON-CLIA BHP9507 (HAMAMATSU), hsCRP was measured by enzyme linked immuno assay (IMTEC hsCRP, HUMAN, Germany). Insulin resistance was estimated from the values FBG and C-peptide by using HOMA2 calculator.
Statistical Analysis
Statistical analysis was performed using SPSS 14. Data was not normally distributed as assessed by Shapiro-Wilk tests (P<0.05). Mann-Whitney U-test was used to compare the medians between two groups. Jonckheere Trend test was used to analyse the trend of hsCRP levels across different groups based on the increasing number of components of MetS present. Spearman’s correlation test was used to correlate hsCRP with MetS components. Regression analysis was used to predict the association of MetS with the components other than those used for classifying MetS. All the P- values were two- tailed, and those < 0.05 (95% Confidence interval (CI)) were considered statistically significant.
Results
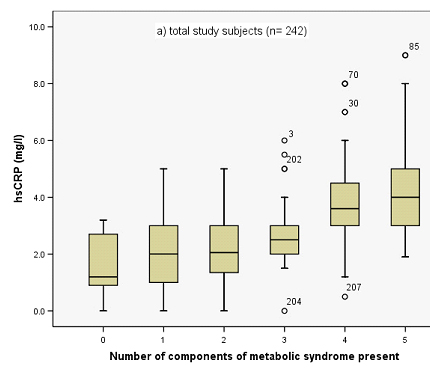
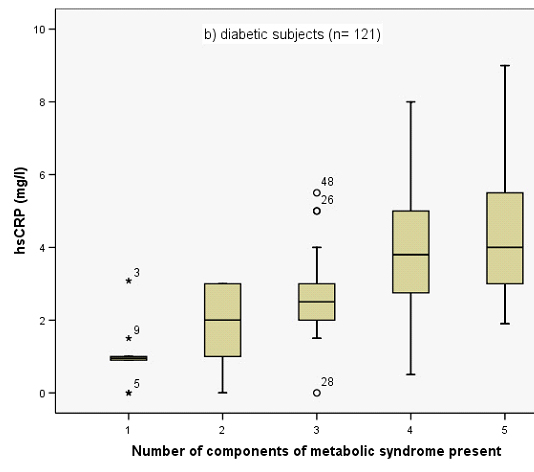
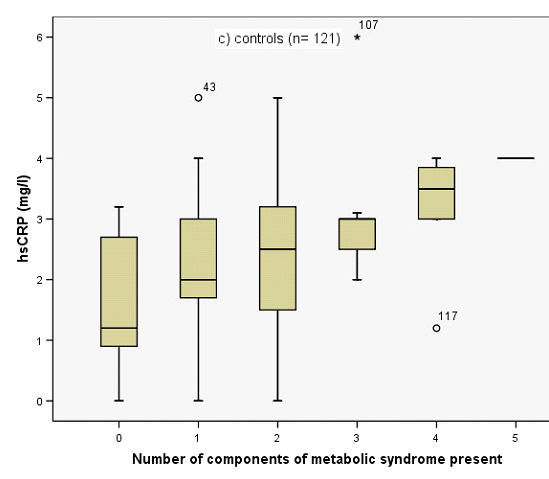
[Table/Fig-1] shows the difference between anthropometric, clinical and biochemical parameters between diabetic and nondiabetic subjects. All the biochemical and anthropometric measurements showed significant difference when the participants were divided on the basis of presence or absence of MetS [Table/Fig-2] Correlation of hsCRP with other biochemical and anthropometric parameters are given in [Table/Fig-3]. As the number of the components of MetS increased, there was a linear increase in the serum hsCRP levels in whole study population (p trend <.001), diabetic subjects (p trend <.001), as well as in controls (p trend <.001) [Table/Fig-4a,bandc]. Binomial logistic regression analysis showed that HOMA2-IR (OR: 3.08; 95%CI: 2.11 to 4.50; p-value<0.0005) and hsCRP (OR: 2.30; 95%CI: 1.79 to 2.97; p-value<0.0005) were better than low density lipoprotein cholesterol (LDL-C) (OR: 2.0; 95%CI: 1.55 to 2.59; p-value<0.0005) and waist circumference (OR: 1.19; 95%CI: 1.14 to 1.25; p-value<0.0005) for predicting the presence of MetS.
Clinical and biochemical characteristics of the study population (median, 25th-75th percentile)
| Diabetic subjects (n=121) | Controls (n=121) | p value |
|---|
| Age (years) | 54.00 (45.00-59.00) | 54.00 (38.50-62.00) | .851 |
| Duration (years) | 4.00 (1.50-8.00) | - | - |
| Men/Women | 60/61 | 60/61 | - |
| BMI (kg/m2) | 25.38 (23.34-27.07) | 23.11 (21.95-24.30) | <.001 |
| Waist/Hip | 0.915 (0.88-0.97) | 0.87 (0.82-0.92) | <.001 |
| SBP (mmHg) | 128.00 (120.00-130.00) | 125.00 (120.00-128.00) | .035 |
| DBP (mmHg) | 80.00 (76.00-80.00) | 76.00 (74.00-80.00) | <.001 |
| TC (mmol/l) | 5.00 (4.50-5.85) | 3.80 (3.15-4.50) | <.001 |
| Tg (mmol/l) | 2.00 (1.50-3.10) | 1.30 (1.10-1.70) | <.001 |
| HDLC (mmol/l) | 1.00 (0.80-1.20) | 1.30 (1.20-1.40) | <.001 |
| LDLC (mmol/l) | 3.19 (2.43-3.74) | 1.97 (1.22-2.73) | <.001 |
| FBG (mmol/l) | 7.40 (6.35-10.00) | 5.20 (4.50-6.35) | <.001 |
| C-Peptide (ng/ml) | 2.40 (2.00-3.20) | 1.50 (1.20-2.00) | <.001 |
| HOMA2-IR | 2.20 (1.65-2.80) | 1.00 (0.90-1.40) | <.001 |
| hsCRP (mg/l) | 3.00 (2.00-4.35) | 2.00 (1.25-3.00) | <.001 |
BMI: body mass index, SBP: systolic blood pressure, DBP: diastolic blood pressure, TC: total cholesterol, Tg: triglycerides, HDLC: high density lipoprotein cholesterol, LDLC: low density lipoprotein cholesterol, FBG: fasting blood glucose, HOMA2-IR: homeostasis model assessment of insulin resistance, hsCRP: high sensitivity C-reactive protein.
Clinical and biochemical characteristics of the whole study population (median, 25th-75th percentile)
| MetS (n= 89) | Non-MetS (n= 153) | p value |
|---|
| Age (years) | 54.00 (48.00-62.50) | 54.00 (40.00-60.00) | .064 |
| Men/Women | 29/60 | 91/62 | - |
| BMI (Kg/m2) | 26.69 (24.50-27.94) | 22.98 (21.73-24.19) | <.001 |
| Waist/Hip | 0.94 (0.9-0.98) | 0.86 (0.82-0.92) | <.001 |
| SBP (mmHg) | 128.00 (120.00-132.00) | 125.00 (120.00-129.00) | .011 |
| DBP (mmHg) | 80.00 (75.00-81.00) | 78.00 (75.00 -80.00) | .002 |
| TC (mmol/l) | 5.30 (4.50-6.00) | 4.10 (3.20-5.00) | <.001 |
| Tg (mmol/l) | 2.10 (1.65-3.25) | 1.40 (1.20-1.80) | <.001 |
| HDLC (mmol/l) | 0.85 (0.80-1.20) | 1.30 (1.15-1.40) | <.001 |
| LDLC (mmol/l) | 3.25 (2.43-3.75) | 2.12 (1.34-2.85) | <.001 |
| FBG (mmol/l) | 6.90 (6.00-8.50) | 6.00 (4.50-6.80) | <.001 |
| C-Peptide (ng/ml) | 2.50 (2.10-3.10) | 1.60 (1.30-2.00) | <.001 |
| HOMA2-IR | 2.10 (1.70-2.80) | 1.30 (0.90-1.60) | <.001 |
| hsCRP (mg/l) | 3.5 (2.90 - 5.00) | 2.00 (1.05-3.00) | <.001 |
BMI: body mass index, SBP: systolic blood pressure, DBP: diastolic blood pressure, TC: total cholesterol, Tg: triglycerides, HDLC: high density lipoprotein cholesterol, LDLC: low density lipoprotein cholesterol, FBG: fasting blood glucose, HOMA2-IR: homeostasis model assessment of insulin resistance, hsCRP: high sensitivity C-reactive protein.
Spearman’s correlation analysis of hsCRP with other risk variables
| Total subjects (n = 242) | Diabetic subjects (n = 121) | Controls (n =121) |
|---|
| FBG | .449 (p<.001) | .299 (p=.001) | .422 (p <.001) |
| SBP | .226 (p<.001) | .133 (p= .147) | .301 (p= .001) |
| DBP | .197 (p= .002) | .150 (p=.101) | .263 (p=.004) |
| WC | .489 (p<.001) | .508 (p<.001) | .328 (p<.001) |
| Waist/Hip | .554 (p<.001) | .585 (p<.001) | .394 (p<.001) |
| Tg | .461 (p<.001) | .522 (p<.001) | .262 (p= .004) |
| HDLC | -.405 (p<.001) | -.458 (p<.001) | -.197 (p= .030) |
| HOMA2-IR | .479 (p<.001) | .363 (p<.001) | .417 (p<.001) |
hsCRP: high sensitivity C-reactive protein, FBG: fasting blood glucose, SBP: systolic blood pressure, DBP: diastolic blood pressure, WC: waist circumference, Tg: triglycerides, HDLC: high density lipoprotein cholesterol, HOMA2-IR: homeostasis model assessment of insulin resistance.
Distribution of serum hsCRP levels in total study subjects (n=242) according to the number of components of metabolic syndrome present. The box plot demonstrates median, 25th, and 75th percentile values for hsCRP
Distribution of serum hsCRP levels in diabetic subjects (n=121) according to the number of components of metabolic syndrome present. The box plot demonstrates median, 25th, and 75th percentile values for hsCRP
Distribution of serum hsCRP levels in controls (n=121) according to the number of components of metabolic syndrome present. The box plot demonstrates median, 25th, and 75th percentile values for hsCRP
Discussion
Our study showed significant increase in hsCRP level in the diabetic subjects when compared to nondiabetic subjects. These results are in agreement with several previous studies [12–15]. Low grade systemic inflammation as evidenced by high levels of hsCRP is suggested to be one of the mechanisms by which known risk factors such as obesity, smoking and hypertension promote the development of T2DM [1,16]. Adipocytokines and inflammatory markers are high in obesity [2,17]. In our study the strongest correlation of hsCRP was observed with waist to hip ratio in diabetic subjects and with FBG in case of nondiabetic subjects. Nakamura et al., showed strongest correlation of hsCRP with waist circumference [18] in apparently healthy Japanese population. With the increasing components of MetS, there was an increase in hsCRP level in our study. Insulin resistance is generally considered as a major pathophysiologic link between obesity and T2DM [19]. Pro-oxidant and inflammatory markers generated in obesity could be one of the several underlying factors for the development of complications of T2DM and severity of MetS. Concept of pro-inflammatory state as one of the components of MetS has been further emphasized by our study. The reasons for the link between inflammation and MetS are not fully understood. One possible mechanism is that adipocytes in obese patients with MetS release high amounts of tumour necrosis factor-α and Interleukin-6 into the circulation, which stimulate the production of hsCRP by the liver and induce insulin resistance [20]. The positive correlation of hsCRP with insulin resistance and markers of obesity in our study also supports this mechanism.
Several studies have shown different hsCRP level in different population [21–24]. Analysis of data from NHANES, 1999 through 2002 showed the median hsCRP levels of 2.1 mg/l among US adults (20 years of age and older) [25]. In our study, we found the median values of non diabetic subjects as 2.0 mg/dl and that of diabetes as 3.0 mg/dl. Several factors including ethnicity could be the reasons for these discrepancies. Regression analysis showed that association of HOMA2-IR and hsCRP were stronger than the association of LDL cholesterol (LDLC) and waist circumference for correctly predicting MetS. Ridker PM et al., showed that hsCRP adds prognostic information on future cardiovascular risk at all levels of LDLC [26]. Owing to the fact that the inflammation and central obesity are the key players for developing insulin resistance, hsCRP could be used as a defining marker of MetS in the near future.
Limitations
1) The cross sectional design of our study had limitations as we assessed the blood parameters of patients only once, and the patients could not be followed up.
2) We could not evaluate the effect of drugs which might have influence on the blood parameters of the study subjects.
Conclusion
hsCRP level was found to be higher in diabetic subjects than in healthy controls and also correlated with the established components of MetS and with insulin resistance. hsCRP was better than LDLC and waist circumference for the prediction of MetS. Hence, hsCRP could be used as a defining marker of MetS in the near future.
Recommendations
hsCRP could be used as a defining marker of MetS in the near future.
BMI: body mass index, SBP: systolic blood pressure, DBP: diastolic blood pressure, TC: total cholesterol, Tg: triglycerides, HDLC: high density lipoprotein cholesterol, LDLC: low density lipoprotein cholesterol, FBG: fasting blood glucose, HOMA2-IR: homeostasis model assessment of insulin resistance, hsCRP: high sensitivity C-reactive protein.
BMI: body mass index, SBP: systolic blood pressure, DBP: diastolic blood pressure, TC: total cholesterol, Tg: triglycerides, HDLC: high density lipoprotein cholesterol, LDLC: low density lipoprotein cholesterol, FBG: fasting blood glucose, HOMA2-IR: homeostasis model assessment of insulin resistance, hsCRP: high sensitivity C-reactive protein.
hsCRP: high sensitivity C-reactive protein, FBG: fasting blood glucose, SBP: systolic blood pressure, DBP: diastolic blood pressure, WC: waist circumference, Tg: triglycerides, HDLC: high density lipoprotein cholesterol, HOMA2-IR: homeostasis model assessment of insulin resistance.
[1]. Pradhan AD, Manson JE, Rifai N, Buring JE, Ridker PM, C-reactive protein, interleukin 6, and risk of developing type 2 diabetes mellitusJAMA 2001 286(3):327-34. [Google Scholar]
[2]. Hotamisligil GS, Inflammation and metabolic disordersNature 2006 444:860-67. [Google Scholar]
[3]. Festa A, D’Agostino R Jr, Howard G, Mykkanen L, Tracy RP, Haffner SM, Chronic subclinical inflammation as part of the insulin resistance syndrome: the Insulin Resistance Atherosclerosis Study (IRAS)Circulation 2000 102(1):42-47. [Google Scholar]
[4]. Dandona P, Aljada A, Chaudhuri A, Mohanty P, Garg R, Metabolic syndrome: a comprehensive perspective based on interactions between obesity, diabetes, and inflammationCirculation 2005 111(11):1448-54. [Google Scholar]
[5]. Pearson TA, Mensah GA, Alexander RW, Anderson JL, Cannon III RO, Criqui M, AHA/CDC Scientific StatementCirculation 2003 107:499-511. [Google Scholar]
[6]. Ridker PM, Buring JE, Cook NR, Rifai N, C-reactive protein, the metabolic syndrome, and risk of incident cardiovascular events: an 8-year follow-up of 14719 initially healthy American womenCirculation 2003 107:391-7. [Google Scholar]
[7]. Khera A, McGuire DK, Murphy SA, Stanek HG, Das SR, Vongpatanasin W, Race and gender differences in C-reactive protein levelsJ Am Coll Cardiol 2005 46(3):464-69. [Google Scholar]
[8]. Ramachandran A, Mary S, Yamuna A, Murugesan N, Snehalatha C, High prevalence of diabetes and cardiovascular risk factors associated with urbanization in IndiaDiabetes Care 2008 31(5):893-98. [Google Scholar]
[9]. Anand SS, Yusuf S, Vuksan V, Devanesen S, Teo KK, Montague PA, Differences in risk factors, atherosclerosis, and cardiovascular disease between ethnic groups in Canada: the Study of Health Assessment and Risk in Ethnic groups (SHARE)Lancet 2000 356:279-84. [Google Scholar]
[10]. ADA position statementDiagnosis and classification of Diabetes mellitusDiabetes Care 2010 33(Suppl 1):562-69. [Google Scholar]
[11]. Alberti KGMM, Zimmet P, Shaw J, Metabolic syndrome- a new world-wide definition. A Consensus Statement from the International Diabetes FederationDiabet Med 2006 23(5):469-80. [Google Scholar]
[12]. Li CZ, Xue YM, Gao F, Wang M, Determination of serum hs-CRP in patients with type 2 diabetes mellitusDi Yi Jhun Yi Da Xne Xne Bao 2004 24(7):791-93. [Google Scholar]
[13]. Amanullah S, Jarari A, Govindan M, Basha MI, Khatheeja S, Association of hsCRP with Diabetic and Non-diabetic individualsJJBS 2010 3(1):7-12. [Google Scholar]
[14]. Tamakoshi K, Yatsuya H, Kondo T, Hori Y, Ishikawa M, Zhang H, The metabolic syndrome is associated with elevated circulating C-reactive protein in healthy reference range, a systemic low-grade inflammatory stateInt J Obes Relat Metab Disord 2003 27(4):443-49. [Google Scholar]
[15]. Hillman AJ, Lohsoonthorn V, Hanvivatvong O, Jiamjarasrangsi W, Lertmaharit S, Williams MA, Association of high sensitivity C-reactive protein concentrations and metabolic syndrome among Thai adultsAsian Biomed (Res Rev News) 2010 4(3):385-93. [Google Scholar]
[16]. Pfutzner A, Forst T, High-sensitivity C-reactive protein as cardiovascular risk marker in patients with diabetes mellitusDiabetes Technol Ther 2006 8(1):28-36. [Google Scholar]
[17]. Hotamisligil GS, Arner P, Caro JF, Atkinson RL, Spiegelman BM, Increased adipose tissue expression of tumor necrosis factor-α in human obesity and insulin resistanceJ Clin Invest 1995 95(5):2409-15. [Google Scholar]
[18]. Nakamura H, Ito H, Egami Y, Kaji Y, Maruyama T, Koike G, Waist circumference is the main determinant of elevated C-reactive protein in metabolic syndromeDiabetes Res Clin Pract 2008 79(2):330-36. [Google Scholar]
[19]. Xu H, Barnes GT, Yang Q, Tan G, Yang D, Chou CJ, Chronic inflammation in fat plays a crucial role in the development of obesity-related insulin resistanceJ Clin Invest 2003 112:1821-30. [Google Scholar]
[20]. Pick up JC, Maltock MB, Chusney GD, Burt D, NIDDM as a disease of the innate immune system, association of acute phase reactatnts and interleukin-6 with metabolic syndrome XDiabetologia 1997 40(11):1286-92. [Google Scholar]
[21]. Sitzer M, Markus HS, Mendall MA, Liehr R, Knorr U, Steinmetz H, C-reactive protein and carotid intimal medial thickness in a community populationJ Cardiovasc Risk 2002 9(2):97-103. [Google Scholar]
[22]. Hashimoto H, Kitagawa K, Hougaku H, Shimizu Y, Sakaguchi M, Nagai Y, C-reactive protein is an independent predictor of the rate of increase in early carotid atherosclerosisCirculation 2001 104(1):63-67. [Google Scholar]
[23]. Kang ES, Kim HJ, Ahn CW, Park CW, Cha BS, Lim SK, Relationship of serum high sensitivity C-reactive protein to metabolic syndrome and microvascular complications in type 2 diabetesDiabetes Res Clin Pract 2005 69(2):151-59. [Google Scholar]
[24]. Hutchinson WL, Koeing W, Frohlich M, Sund M, Lowe GD, Pepys MB, Immunoradiometric assay of circulating CRP: age related values in the adult general populationClin Chem 2000 46(7):934-38. [Google Scholar]
[25]. Woloshin S, Schwartz LM, Distribution of C-Reactive Protein Values in the United StatesN Engl J Med 2005 352(15):1611-13. [Google Scholar]
[26]. Ridker PM, Rifai N, Rose L, Buring JE, Cook NR, Comparison of C-reactive protein and low-density lipoprotein cholesterol levels in the prediction of first cardiovascular eventsN Engl J Med 2002 347:1557-65. [Google Scholar]