Every sensory-neural structure, when submitted to a stimulus, emits bioelectrical potentials as response. Thus, the acoustic stimulation of the human auditory receptor triggers a number of electrical responses or evoked potentials, which result in the successive activation of the eighth nerve, cochlea and the neurons which make up the auditory pathway with sequence of five major waves [1]. The acoustic stimulation delivered to one or both the ears evoke seven submicrovolt vertex positive waves in first 10 msec after each stimulus. Names are given to these waves sequentially as I to VII.
In most studies waves I, III and V are the most prominent and parameters assessed are: the very presence of the waves, replication or reproducibility, absolute latency and interpeak latencies [2]. Auditory evoked potentials (AEPs), besides enabling one to investigate the individual’s peripheral hearing, also help to assess the central auditory pathway integrity, its maintenance during the development process and dysfunctions caused by many diseases [3]. Braistem auditory evoked potentials (BAEPs) are the responses of the auditory, brainstem and higher subcortical structures to acoustic stimulation [4].
Auditory Brainstem Response is the most important tool in differential diagnosis and degree of hearing impairment (whether cochlear or conductive), functional assessment of brainstem in patients with ischemic conditions or intracranial mass lesions. For interpretation of abnormal waves of BAEP, there is necessity of baseline BAEP pattern from healthy subjects. With this aim, this study was conducted to analyse absolute latencies of wave I, II, III, IV and V, I-III, III-V and I-V interpeak latencies and wave V/I amplitude ratio in normal subjects in central India in order to analyse normal values for different latencies, interpeak latencies & wave ratio.
Methods
This study was conducted in Sevagram area of Wardha city, located in Central India during 1st January 2011 to 31st March 2011. It was a cross sectional study on 50 apparently healthy normal subjects from the community of same sex, age group and geographical setup after consideration of exclusion and inclusion criteria. Subjects were divided into age group of 21-30, 31-40 and 41-50 to know whether there are any changes in BAEP recording in different age groups.
Inclusion Criteria: Fifty apparently healthy normal male subjects of age group (21-50 yrs) from Sevagram area of the Wardha city were selected.
Exclusion criteria: Any middle ear disease such as Chronic Suppurative Otitis Media, Otitis Media with effusion and Otosclerosis, Menier’s disease. Systemic diseases such as Type 1 and Type 2 Diabetes mellitus and hypertension, chronic use of ototoxic drug intake such as amikacin, gentamicin, and previous history of head trauma.
Sampling Technique: Non probability purposive sampling technique was used to select 50 subjects from same geographical location of the Sevagram area of the Wardha city.
Before starting the study, proper ethical approval was obtained from IEC (Institutional Ethical Committee), MGIMS, Sevagram, Wardha. After obtaining proper informed written consent from participants in this study, all the subjects were informed about nature of the study and method of BAEP recording. There age, sex and other details were recorded.
The BAEP procedure itself is safe and non-invasive; recordings were performed in a quiet room at constant room temperature of 300C. Electrode application followed the International 10/20 System of Electrode Placement with one channel setting.
Recording Electrodes: Silver Chloride cup electrodes were attached on each earlobe (A1,A2), at the vertex (Cz, as the reference electrode, 10-20 international electrode placement system) and on the forehead (G as a ground electrode). The site of application was cleaned with an abrasive cleanser (spirit). A conductive paste was then applied to the electrode and placed over the prepared area. The recording was done using RMS EMG EP MARK II machine manufactured by RMS recorders and medicare system, Chandigarh.
Stimulation: Alternate (condensation and rarefaction) clicks were presented monaurally through earphones at a repetition rate of 11.1/second. The intensity of the click stimulus was 90 dB (decibels). 2000 responses were averaged for each record, each ear was tested separately and at least two trials were performed on each subject.
Peak latencies i.e., absolute latencies were measured from the leading edge of the driving pulse to the positive peaks. Peak amplitudes were measured from the prestimulus baseline. The absolute latencies of wave I, II, III, IV and V were measured. Wave V/I amplitude ratio were expressed as ratio of wave V amplitude to wave I amplitude. Amplitudes of wave I and V were measured from peak to trough and the interpeak latencies (IPLs) between wave I-III, III-V and I-V were also measured from peak to peak of two defined waveforms and hearing threshold. Wave VI and VII were not well identified in each and every subject in our machine so we have not included their measurement in our study.
Criteria for Clinically significant abnormality: For diagnosis of any abnormal pattern in BAEP, there is a requirement of normal and control data of that particular geographical area. Abnormal peak latencies that are beyond 2.5 or 3 standard deviations from the mean abnormal peak latency obtained from age-matched BAEP pattern from the normal apparently healthy population of that geographic location if available. Similaraly, we can interpret , interpeak latencies and amplitude ratios with the previous healthy control data.
Statistical Analysis
All the data related with subjects were filled in excel sheet and analysed with help of EPI 6.0 info software. We compared the latencies of waves I, II, III, IV and V, the interpeak latencies I-III, III- V, and I-V and amplitude ratio of V/I waves for control subjects with other previous studies.
Results
Shows the Mean absolute latency value and interpeak latencies (IPL) with their standard deviation (SD) in 50 subjects or 100 ears regardless of sex and age. The Mean ratio of wave V/I amplitude with their standard deviation (SD) in 50 subjects or 100 ears regardless of sex and age [Table/Fig-1,2,3,4and5].
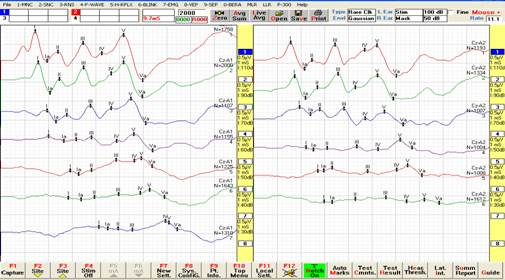
Brain auditory evoked potential (BAEP) recording in Normal subject
Mean absolute latencies of normal subjects (R-right ear, L – left ear)

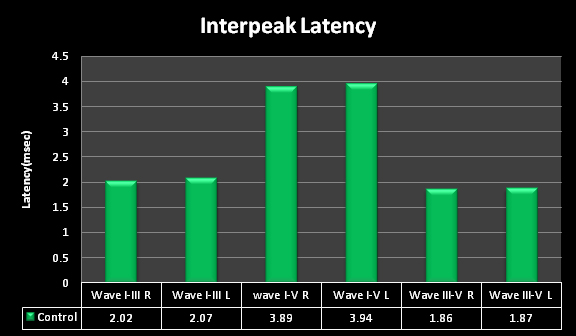
Mean interpeak latencies of healthy normal subjects
Mean absolute and inter peak latencies (IPL) of fifty normal subjects
| Wave | Mean Latency ± SD (ms) |
|---|
| Wave I | Lt Ear | 1.69 ± 0.13 |
| Rt Ear | 1.67 ± 0.14 |
| Wave II | Lt Ear | 2.71 ± 0.22 |
| Rt Ear | 2.75 ± 0.14 |
| Wave III | Lt Ear | 3.71 ± 0.13 |
| Rt Ear | 3.73 ± 0.21 |
| Wave IV | Lt Ear | 4.83 ± 0.28 |
| Rt Ear | 4.85 ± 0.32 |
| Wave V | Lt Ear | 5.58 ± 0.23 |
| Rt Ear | 5.61 ± 0.17 |
| Wave I-III IPL Lat. | Lt Ear | 2.02 ± 0.2 |
| Rt Ear | 2.07 ± 0.24 |
| Wave I-V IPL Lat. | Lt Ear | 3.89±0.29 |
| Rt Ear | 3.94 ± 0.22 |
| Wave III-V IPL | Rt Ear | 1.86 ± 0.23 |
| Lt Ear | 1.87 ± 0.26 |
Mean Ratio of Wave V/I Amplitude in healthy normal subjects
| Wave V/I Amplitude Ratio |
|---|
| Wave V/I A | Rt Ear | 2.03 ± 0.76 |
| Lt Ear | 2.15 ± 0.81 |
The Mean values with standard deviations in different studies on normal subjects were compared and shown in [Table/Fig-6].
Mean values and their respective standard deviations of absolute and interpeak latencies of BAEP from previous studies
| Previous studies | L I | L III | L V | IPL I-III | IPL I-V | IPL III-V |
|---|
| Ilka do Amaral Soares(2009) | 1.5± 0.15 | 3.57± 0.18 | 5.53± 0.21 | 2.06± 0.19 | 3.98± 0.23 | 1.79± 0.25 |
| Lima JP DE(2008) | 1.68± 0.12 | 3.75± 0.21 | 5.56± 0.26 | 2.07± 0.21 | 3.88± 0.26 | 1.81± 0.22 |
| Hall JW (2006) | 1.65± 0.14 | 3.8± 0.18 | 5.64± 0.23 | 2.15± 0.14 | 3.99± 0.2 | 1.84± 0.14 |
| Anias CR(2004) | 1.6± 0.1 | 3.73± 0.14 | 5.64± 0.14 | 2.13± 0.12 | 4.03± 0.12 | 1.9± 0.1 |
| Munhoz MSL(2000) | 1.54± 0.1 | 3.7± 0.15 | 5.6± 0.19 | 2.2± 0.16 | 4.04± 0.18 | 1.84± 0.17 |
| Misra and Kalita | 1.67± 0.17 | 3.65± 0.22 | 5.72± 0.3 | 1.99± 0.25 | 4.04± 0.25 | 2.08± 0.3 |
| Hall JW (1992) | 1.54± 0.08 | 3.73± 0.1 | 5.52± 0.15 | 2.19± 0.18 | 3.98± 0.23 | 1.79± 0.25 |
| Chiappa et al(1979) | 1.7± 0.15 | 3.9± 0.19 | 5.7± 0.25 | 2.1± 0.15 | 4± 0.23 | 1.9± 0.18 |
| L. Thakur | Rt Ear | 1.76± 0.15 | 3.91± 0.3 | 5.62± 0.33 | 2.15± 0.27 | 1.91± 0.31 | 4.06± 0.36 |
| Lt Ear | 1.75± 0.94 | 4.11± 0.24 | 5.99± 0.39 | 2.33± 0.25 | 1.88± 0.28 | 4.22± 0.39 |
| Present Study | Rt Ear | 1.69± 0.13 | 3.71± 0.13 | 5.58± 0.23 | 2.02± 0.2 | 3.89± 0.29 | 1.86± 0.23 |
| Lt Ear | 1.67± 0.14 | 3.73± 0.21 | 5.61± 0.17 | 2.07± 0.24 | 3.94± 0.22 | 1.87± 0.26 |
(L I: Wave I latency; L III: Wave III latency; L V: Wave V latency; IPL I-III: Wave I-III Interpeak latency, IPL I-V: Wave I-V Interpeak latency; IPL III-V: Wave III-V Interpeak latency)
Discussion
BAEPs have been applied widely to the examination of the integrity of brainstem nuclei and peripheral auditory pathways [5].
Subjects were divided into age group of 21-30,31-40 & 41-50 to know whether there are any changes in BAEP recording in different age groups.
In our study, we do not found any significant changes within our age groups and also within inter-aural latencies. There are various clinical studies indicating that there are changes in absolute peak latencies and interpeak latencies of the BAER pattern [6,7].
The finding in our study was comparable and consistent with the studies by Adriana Silveira Santos et al., Lima JP et al., Hall JW et al., Misra and Kalita [8–12].
1) Wave latency
Wave I latency which is a measure of electrophysiological activity of the eight nerve and in present study it were 1.69±0.13 and 1.67±0.14 in right and left ear respectively. It is comparable and consistent with previous studies on normal subjects done by Lima JP et al.,(1.68±0.12), Hall JW et al., (1.65±0.14), Misra and Kalita (1.67±0.17) and Chiappa et al., (1.7±0.15) shown in [Table/Fig-3] [10–14]. In our study values were higher than the study by Ilka do Soares et al., (1.5±0.15), Munhoz MSl et al., (1.54±0.1), Hall JW (1.54±0.08) and lower as compared with study by L Thakur et al., which were 1.76±0.15 and 1.75±0.14 in right and left ear respectively [7,11,15–17].
Wave III latency is comparable with previous studies on normal subjects done by Lima JP et al., (3.75±0.21), Misra and Kalita (3.65±0.22), and Munhoz MSl et al., (3.7±0.15) [7,10,12]. In our study values were higher than the study by Ilka do Amaral Soares et al., (3.57±0.18) and lower as compared with study by Hall JW (3.8±0.18) and Ropper and Chiappa (3.9±0.19) [16–18]. Adriana Silveira Santos et al. found significant difference in latencies of control subjects (3.52 and 3.45) in right and left side respectively [9]. Wave IV latency is a measure of electrophysiological activity in the Lateral lemniscus of hearing pathway and in our study the latencies were 4.83 ± 0.28 and 4.85 ± 0.32 in right and left ear respectively.
Wave V latency was comparable with previous studies on normal subjects done by Lima JP et al., (5.56±0.26), Hall JW et al., (5.64±0.23) Munhoz MSl et al., (5.6±0.19) and Ilka do Amaral Soares et al., (5.53±0.21) [7,10,16,17]. In the present study values were lower as compared with study by and Ropper and Chiappa (5.7±0.25) and Misra and Kalita (5.72±0.3) [8,12,18,19].
2) Interpeak latency (IPL)
The commonest Interpeak latencies (IPLs) employed in clinical practice are I-V, I-III and III-V.
Wave I-III inter peak latency (IPL): In our study, the I-III IPL were comparable with the previous studies done by Ilka do Amaral Soares (2.06±0.19), Lima JP et al., (2.07±0.21), Misra and Kalita (1.99±0.25) and Chiappa et al., (2.1±0.15) [10,12,17,18]. In our study values were lower as compared to Hall JW et al., (2.15±0.14), Munhoz MSL et al., (2.2±0.16), Hall JW (2.19±0.18) [7,11,16]. The upper limit of normal for I-III IPL is about 2.5 msec Misra and Kalita [12].
Wave I-V inter peak latency (IPL):In our study the IPL I-V were comparable with the previous studies done by Ilka do Amaral Soares et al., (3.98±0.23), Hall JW et al., (3.99±0.2), Munhoz MSL et al., (4.04±0.18), Misra and Kalita (4.04±0.25) and Chiappa et al.,(4±0.23) [7,11–13,17,18]. The typical upper limit of normal I-V IPL is 4.5 msec with right to left asymmetry not more than 0.5 msec.
Wave III-V IPL: In our study, III-V IPL were comparable with the previous studies done by Chiappa et al., (1.9±0.18), Munhoz MSL et al., (1.84±0.17) and Hall JW et al., (1.84±0.14) [7,16,18]. In our study values were higher than the studies by Ilka do Amaral Soares et al., (1.79±0.25), Hall JW et al., (1.79±0.25) and lower than Misra and Kalita (2.08±0.3) [12,14–17].
3) Peak amplitude ratio
In our study, the mean amplitude ratio between wave V and I were not consistent with the study by L Thakur et al., in which it were 3.3±5.83 and 1.87±0.95 in control group in right and left ears respectively [20].
Conclusion
This study was conducted as exploratory pilot study only on male healthy controls. Sample size is small in this study, future studies will be conducted for establishment of baseline values by using this pilot study.
Since, the study conducted in different regions, there are some differences in the latencies and interpeak latencies and amplitude ratio but they are within range, so reference range of this study can be used for future studies in this Wardha region of Central India.
(L I: Wave I latency; L III: Wave III latency; L V: Wave V latency; IPL I-III: Wave I-III Interpeak latency, IPL I-V: Wave I-V Interpeak latency; IPL III-V: Wave III-V Interpeak latency)