Protein energy malnutrition (PEM) is still an important health problem that is responsible for childhood morbidity and mortality leading to permanent impairment of physical and possibly mental growth who survive. Fourty six percent of preschool children in India suffer from moderate to severe protein energy malnutrition ICMR [1]. Nearly 80 percent of PEM cases are of mild and moderate degree malnutrition in India. It is of great concern that malnutrition is like an iceberg leading to undiagnosed retardation of bone maturity and eventually physical growth [2]. Skeletal development is a useful and reliable indicator of growth and development. No other organ is as technically amenable to measurement throughout the growth period as skeletal system [3]. Bones serve as a mirror of nutritional status of child and skeletal maturation is consistent in the age at which they occur in the individual and can be used as a guideline to measure degree of maturation [4]. Hand and wrist are good index of maturity of entire skeleton of a healthy child [5].
Previously many studies have been done on ossification centres of hand bones for estimation of skeletal maturation and to diagnose malnutrition but very few studies have been done so far to see effect of malnutrition on surface area of carpal bones. Garg K, Kulshreshtha V [6] ascertained asymmetry in capitate and hamate bones in malnourished children by evaluating their surface areas and had shown that as the grade/severity of malnutrition increases, degree of asymmetry and surface areas of capitate and hamate decrease. Hsieh [7] developed a computerized bone age estimation system based on geometric analysis of carpal bones They included shape and bony surface area in their study and concluded that bone surface area had a higher discriminating power to judge bone age.
Considering all these facts, this study was done to see the effects of Protein energy malnutrition on surface areas of carpal bones of children upto five years of age.
Materials and Methods
The present study was conducted at Department of Paediatrics and Department of Radiodiagnosis of SN Medical college, Agra comprising cases of Protein energy malnutrition (PEM) of various grades diagnosed by consultant paediatrician using IAP criteria [8] and comparable numbers of children as controls upto 5 years of age of Agra region.
The study group consisted of 68 PEM children of either sex of Out Patient Department (OPD) and Indoor Patient Department (IPD) of Paediatrics of grade 1 (26.47%), grade 2 (38.24%) and grade 3 (35.29%). Frequency distribution of various age groups was 16.17% children (0- 1 year), 17.65% children (1-2 years), 25% children (2 -3 years), 23.53% children (3 - 4 years) and 17.65% children (4 - 5 years).
children with bone diseases,congenital or physical anomalies and residents or migrants or residents and migrants of other regions were excluded to minimise all possible bias.
Sixty-eight healthy children of either sex were taken as controls having frequency distribution of 17.64% (0-1 year), 17.64% (1-2 years), 23.53%(2-3 years), 22.05% (3-4 years) and 19.12% (4-5 years) attending Well Baby Clinic, Department of Paediatrics, S.N. Medical College, Agra.
Ethics
Various ethical issues related to this study were discussed under Institutional Review Board and ethical clearance was obtained. Written informed consent was obtained from the parent of each case and control selected for this study.
Methodology
X-rays (AP view) of both wrists were taken in Department of Radiodiagnosis by adjusting X-ray tube at uniform distance of 100 cms from both wrists so that magnification of bones on both sides remain equal in our study group.
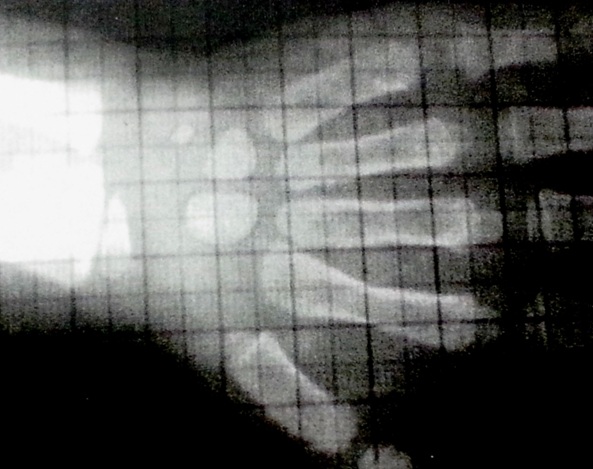
Further analysis of radiographs were done in Department of Anatomy. Radiographs were illuminated over X-ray view box [Table/Fig-1] and projected bony surface areas of carpal bone were calculated using Millimetres Graph Transparency paper placed over each carpal bone and number of squares over each carpal bone were counted by Hit method. Thus, projected surface areas were calculated in all carpal bones.
Counting of number of squares over each bone in illuminated radiograph of hand
Statistical Analysis
Data were analysed separately and compared on both sides in malnourished children and controls. Differences in surface areas of carpal bones on both sides between different groups were statistically evaluated by t-test for significance value using Graph Pad statistical software version 4.00.
Results
The study showed that the surface areas of capitate, hamate and triquetral bones on both sides were reduced in PEM children of all grades as compared to healthy controls. It was also found that the surface areas of carpal bones on both sides decreased as severity/grades of malnutrition increased [Table/Fig-2,3and4]. The surface areas of capitate, hamate on both sides were significantly reduced in grade 3 malnutrition children as compared to healthy controls and grade 1 PEM cases [Table/Fig-4,5].
Significance value of surface area (mm) of capitate boneof right and left hand of cases and controls
| Subjects | Mean | S.D. | t-value | p-value | Significance |
|---|
| Rt | Lt | Rt | Lt | | | |
| Controls | 40.40 | 40.15 | 27.89 | 27.46 | 2.86 | <0.01 | Highly Significant |
| Grade-1 PEM | 33.25 | 33.10 | 17.39 | 17.38 | 2.11 | <0.05 | Significant |
| Grade-2 PEM | 32.64 | 32.56 | 16.37 | 16.43 | 1.46 | >0.05 | Insignificant |
| Grade-3 PEM | 17.50 | 17.30 | 9.63 | 10.54 | 0.04 | >0.05 | Insignificant |
Significance value of surface area (mm2) of hamate bone of right and left hand of cases and controls
| Subjects | Mean | S.D. | t-value | p-value | Significance value |
|---|
| Rt | Lt | Rt | Lt | | | |
| Controls | 27.35 | 27.05 | 18.24 | 17.72 | 3.28 | <0.01 | Highly significant |
| Grade-1 PEM | 24.83 | 24.74 | 10.53 | 11.49 | 1.82 | >0.05 | Insignificant |
| Grade-2 PEM | 24.89 | 24.05 | 10.08 | 9.31 | 0.26 | >0.05 | Insignificant |
| Grade-3 PEM | 20.20 | 20.11 | 12.23 | 12.51 | 0.02 | >0.05 | Insignificant |
Significance value of surface area (mm2) of triquetral bone of right and left hand of cases and controls
| Subjects | Mean | S.D. | t-value | p-value | Significance value |
|---|
| Rt | Lt | Rt | Lt | | | |
| Controls | 5.05 | 4.70 | 6.72 | 6.89 | 0.16 | >0.05 | Insignificant |
| Grade-1 PEM | 4.67 | 4.61 | 1.32 | 1.37 | 0.11 | >0.05 | Insignificant |
| Grade-2 PEM | 4.52 | 4.50 | 1.37 | 1.38 | 0.04 | >0.05 | Insignificant |
| Grade-3 PEM | 3.30 | 3.70 | 1.92 | 2.58 | 0.43 | >0.05 | Insignificant |
Significance value of surface area (mm2) of capitate (RT and LT wrist) between PEM cases and controls
| Cases (PEM) | Hand | t-value | p-value | Significance | SD |
|---|
| Controls | Grade-1 | RT | 0.73 | >0.05 | Insignificant | 2.96 |
| LT | 0.71 | >0.05 | Insignificant | 2.2 |
| Grade-2 | RT | 1.03 | >0.05 | Insignificant | 2.96 |
| LT | 0.77 | >0.05 | Insignificant | 3.95 |
| Grade-3 | RT | 2.71 | <0.05 | Significant | 3.68 |
| LT | 2.70 | <0.05 | Significant | 3.68 |
The surface areas of capitate, hamate and triquetral could only be calculated in healthy controls and PEM cases because of the fact that ossification center appears first in capitate bone followed by hamate [Table/Fig-5,6,7]. Triquetral is third bone to ossify in wrist. In malnutrition cases there is further delay in appearance of ossification centers [9].
Significance value of surface area (mm2) of hamate (RT and LT hand) between PEM cases and controls
| Cases (PEM) | Hand | t-value | p-value | Significance | SD |
|---|
| Controls | Grade-1 | RT | 0.41 | >0.05 | Insignificant | 2.96 |
| LT | 0.37 | >0.05 | Insignificant | 2.2 |
| Grade-2 | RT | 0.51 | >0.05 | Insignificant | 2.96 |
| LT | 0.64 | >0.05 | Insignificant | 3.95 |
| Grade-3 | RT | 1.21 | >0.05 | Insignificant | 3.68 |
| LT | 1.18 | >0.05 | Insignificant | 3.68 |
Significance value of surface area (mm2) of triquetral (RT and LT hand) between PEM cases and controls
| Cases (PEM) | Hand | t-value | p-value | Significance | SD |
|---|
| Controls | Grade-1 | RT | 0.17 | >0.05 | Insignificant | 2.96 |
| LT | 1.31 | >0.05 | Insignificant | 2.2 |
| Grade-2 | RT | 0.32 | >0.05 | Insignificant | 2.96 |
| LT | 0.12 | >0.05 | Insignificant | 3.95 |
| Grade-3 | RT | 0.87 | >0.05 | Insignificant | 3.68 |
| LT | 0.48 | >0.05 | Insignificant | 3.68 |
Asymmetry in surface areas among carpal bones on both sides was ascertained by comparing capitate, hamate and triquetral bones of right side with left side bones and it was found that the surface areas of these bones were more on right side in healthy controls and grade 1PEM cases [Table/Fig-2,3]. The asymmetry could not be ascertained statistically in grade 2 and grade 3 malnutrition children as the surface areas of Capitate and hamate bones were much reduced due to delay in appearance of ossification centers in grade 2 and grade 3 malnutrition cases.
Other carpal bones: Calculation and comparison of surface areas of other carpal bones were not feasible because of their smaller sizes upto five years of age and further delay in appearance of ossification centers in malnutrition.
Discussion
This study shows that the surface areas of capitate, hamate and triquetral bones on both sides were decreased in PEM cases of all grades as compared to healthy controls. The surface areas of these carpal bones decrease as grade/ severity of malnutrition increases and the surface area of Capitate was significantly reduced in grade 3 PEM children on both sides as compared to healthy controls. [6] they observed significantly reduced surface area of capitate of both hands in grade 2 PEM and grade 3 PEM as compared to healthy controls. They also observed that as grade of malnutrition increases, the surface areas of capitate and hamate decrease. This is due to fact that in grade 2 and grade 3 PEM cases there are delay in appearance of ossification centers in carpal bones.
In the present study, we could calculate only the surface areas of capitate, hamate and triquetral out of eight carpal bones in healthy controls and PEM cases because of the fact that ossification center appears first in capitate bone followed by hamate. Triquetral is third bone to ossify in wrist [9]. As the grade of malnutrition increases there is further delay in appearance of ossification centers.
This study also shows that the surface area of capitate bone was more on right side as compared to left in healthy controls and malnutrition cases of grade 1 PEM. [6] studied asymmetry in the surface area of capitate in normal and malnourished children and found that in normal children (control) and grade 1 PEM cases the surface area of capitate was more on right side and this difference was statistically significant and was similar to our findings. [10,11] reported asymmetry to right side and quoted that aymmetry was most probably due to genetic factor, yet the difference of activity accentuates it on dominant side in normal and grade 1 PEM cases but lack of physical activity in grade 2 and grade 3 malnutrition children, asymmetry between both sides decreases to statistically significant level. Similar to study by Garg K [10], we also found asymmetry (more surface area on right side as compared to left side) in capitate in healthy controls and grade 1 PEM cases but we could not find statistically significant asymmetry in grade 2 and grade 3 PEM cases probably due to further delay in appearance of ossification centers and much reduced bony surface areas.
The surface area of hamate bone was significantly more on right side in healthy control but asymmetry could not be ascertained in PEM cases in our study[10] found asymmetry in surface area of hamate bone in normal children and malnourished children of grade 1PEM and quoted that in normal and grade 1 PEM cases the surface area of hamate was significantly more on right side. We could not ascertain asymmetry in PEM cases probably due to smaller size of hamate bone and lack of 3 dimensional view of carpal bones.
In grade 2 and grade 3 PEM cases due to delay in appearance of ossification centers and much reduced surface areas along with lack of chronic physical activity, asymmetry could not be ascertained in capitate and hamate bones. Unlike our study, Garg K [6] depicted minimal significant difference in carpals bones in grade 2 and grade 3 PEM cases.
The surface area of triquetral bone was also more on right side in PEM cases of all grades and controls but statistically difference was insignificant. It may be due to fact that ossification center for triquetral usually appears at age of 3-4 years and there is delay in appearance of ossification centers in malnutrition. In our study, 58 % cases belonged to age of less than three years and 42% children were of four and five years, so smaller size of triquetral bone and markedly reduced surface area in malnutrition, we could not assess asymmetry. [6] could not ascertain asymmetry in triquetral bone in grade 2 and grade 3 malnutrition but they depicted significant difference in healthy controls and grade 1 PEM.
It was difficult to assess and compare surface areas of other carpal bones as the surface areas of other carpal bones on illuminated radiograph was not possible in our study because of their smaller sizes up to five years of age and delay in appearance of ossification centres in malnutrition.
The surface areas of triquetral and other carpal bones can be observed and better analysed by three dimensional computerized geometrical analysis in malnourished children or we increase the age limit of study group. But since malnutrition is most common in preschool children (i.e. upto five years of age), raising upper age limit of study group would be of no benefit. Further we will incorporate surface areas and ossification centers of tarsal bones in malnourished children in further studies as surface areas of tarsal are much larger as compared to carpal. As far as my knowledge we could not find much literature on carpal and tarsal bones surface areas in malnutrition.
Conclusion
1. The surface areas of capitate, hamate and triquetral bones on both sides decrease as the grade / severity of malnutrition increases. The surface areas of capitate, hamate and triquetral bones were much reduced in grade 2 PEM and grade 3 PEM on both sides as compared to healthy controls and grade 1 PEM.
2. The surface areas of capitate, hamate were more on right side as compared to left side in healthy controls and grade 1 PEM children. Asymmetry ascertained to right sided carpal bones.
3. The surface areas of capitate, hamate and triquetral bones could not depict difference on both sides in grade 2 and grade 3 malnutrition probably due to delay in appearance of ossification centers in severe malnutrition and lack of 3 dimensional view of bones in our study.