Introduction
The leaves of Gongronema latifolia, Ocimum gratissimum and Vernonia amygdalina locally known as Utazi, Onugbu and Nchanwu are widely used for food and medicinal purposes in South Eastern Nigeria. G. latifolia is a climber while O. gratissimum (Lamiaceae) and V. amygdalina (Asteraceae) are shrubs. Their leaves are ethno medically believed to be effective for the treatment of diabetes, dysentery, gastrointestinal disorders and fever. They are also used for culinary purposes such that soups prepared with these leaves either in combination or individually, are believed to improve lactation. Aqueous and ethanolic extracts of G. latifolia has been reported to possess antioxidative, hypoglycemic, hypolipidemic and anti-inflammatory properties [1-3]. Eleyinmi demonstrated that G. latifolium has potential food and antibacterial uses [4]. The topical application of the essential oils of O. gratissimum is also reported by Usip et al., to reduce the biting ability of Simulium damnosum (black flies) by about 90% [5]. Some bioactive constituents like the vernolides from V. amygdalina exhibited high activity against P. notatum, A. flavus, A. niger and Mucor hiemalis, respectively, while vernodalol showed moderate inhibitions against A. flavus, P. notatum and A. niger [6].
Acetaminophen is one of the most common medications found in households. It is one of the most common sources of pharmaceutical products poisoning and account for most drug overdoses in Australia, New Zealand, the United Kingdom, and the United States [7-10]. It is primarily metabolized by glucuronidation (40 - 67 %), sulfation (20–40 %) and N-hydroxylation and followed by conjugation with glutathione [11,12]. When this detoxification pathway becomes saturated N-acetyl-p-benzoquinone imine (NAPQI) accumulates thereby causing liver injury. Eventually, this may lead to hepatic necrosis, renal tubular necrosis, hypoglycemic coma, and death. Liver disease is often reflected by biochemical abnormalities of one of the two different hepatic systems or liver function.
Materials and Methods
Plant Materials
The plant materials used in this study, leaves of G. latifolia, O. gratissimum and V. amygdalina were bought from from Oyingbo market in Lagos, Nigeria metropolis during the rainy season (May 2007). The plant material was identified and authenticated at the Department of Pharmacognosy, College of Medicine of the University of Lagos, Nigeria. Voucher specimens (PCGH 444, PCGH 443 and PCGH 432) of G. latifolia, O. gratissimum and V. amygdalina respectively were deposited in their herbarium for reference purposes.
Preparations of Polyherbal Extract (GOV)
Twelve kilograms each of fresh leaves of G. latifolia, O. gratissimum and V. amygdalina were blended with five liters (5 L) of aqueous ethanol (50 % v/v) and subsequently filtered using a muslin cloth. The filtrate was evaporated to a small volume in a rotary evaporator and subsequently to dryness in an oven set at 40 °C. The dried extract was weighed and reconstituted in distilled water to give a concentration of 100 mg/ml.
Drugs and Chemicals
LIV 52 syrup (Himalaya Drug company, India), Acetaminophen (APAP) (Emzor Pharmaceuticals, Nigeria), Gower’ Solution (Eng Scientific Inc), Turk blood diluting fluid (Ricca Chemical Company LLC), Acetic acid, Hydrochloric acid (HCl) and trichloroacetic acid (TCA), were obtained from Fisher, while Silymarin, Ethanol, 2-Thiobarbituric acid, Drabkin’s neutral diluting fluid, Wright stain solution, Ellmans reagents, phosphate buffer, glutathione, epinephrine, cDNB (1-chloro-2,4-dinitrobenzene), hydrogen peroxide, gentian violet, sodium sulfate and potassium dichromate were purchased from Sigma-Aldrich Co. LLC.
All biochemical tests - (Albumin (ALB), Alkaline phosphatase (ALP), Alanine Aminotransferase (ALT), Aspartate Aminotransferase (AST), Cholesterol (CHO), Creatinine (CREA), total protein (TP), triglycerides (TG), Lactate dehydrogenase (LDH), Gamma-glutamyl transferase (GGT) and Urea) - were assayed using Randox kits.
Animals
Forth-nine Wistar albino rats weighing between 120–160 g and 100 Swiss albino mice of 20-25 g weight of either sex were obtained from the Laboratory Animal Centre of the College of Medicine, University of Lagos, Nigeria. The animals were left for 10 days to acclimatize under controlled environmental conditions with free access to drinking water and standard diet ad libitum. This study was conducted according to the rules and regulations of The University of Lagos Ethical Committee on the use of experimental animals.
Acute Toxicity
According to the Organization of Economic Cooperation and Development (OECD) guidelines for testing of chemicals, five groups of 10 mice each were treated with different doses of the GOV (1, 2, 4, 8 and 16 g/kg body weight) orally (p.o) while another five groups were intraperitoneally (i.p.) administered with 0.5, 1, 1.5, 2 and 2.5 g/kg doses of the GOV. The control group consisting of 10 mice received 10 ml/kg distilled water. The animals were observed continuously for 24h for behavioral changes and mortality.
Acetaminophen (APAP APAP ) Induced Hepatotoxicity in Rats
Wistar Albino rats of either sex were randomly selected and assigned into seven groups of seven animals each. Each group of rats received varied treatment for 14 days.
Animals in group 1 (control) were treated with distilled water 10 ml kg body weight p.o. while the toxin control animals (group 2) received APAP 3 g/kg body weight in distilled water on the 13th day only.
The test animals in groups 3-5 were treated with 2, 4 and 8 g/kg body weight of polyherbal extract (GOV) respectively for 14 days. On the 13th day, the drugs were administered 1hour before treatment (p.o.) with APAP 3 g/kg body weight in distilled water.
Group 6 and 7 animals received LIV 52 syrup (0.3 g/kg body weight) and Silymarin (0.3 g/kg body weight in distilled water) (p.o.) respectively for 14 days. On the 13th day, the drugs were administered 1hr before treatment (p.o.) with APAP 3 g/kg body weight in distilled water.
Biochemical and Histological Studies
Forty eight hours after APAP intoxication, the animals were anesthetized mildly with ether and blood was collected from the retro-orbital plexus. They were sacrificed and more blood samples were collected by cardiac puncture for evaluating the biochemical parameters. Heart, Liver and Kidney were carefully harvested and preserved in 10 % normal saline for histological studies.
Blood samples from the experimental animals were collected in ethylene diamine tetra-acetic acid (EDTA) -coated sample bottles for analysis of haematologic indices and lithium heparin tubes for estimation of antioxidant activities, liver and kidney markers.
Haematologic indices packed cell volume (PCV) [13], Haemoglobin, (HB) [14], Red blood cell count (RBC) [15], mean corpuscular volume (MCV), mean corpuscular haemoglobin (MCH), mean corpuscular haemoglobin concentration (MCHC), white cell (Leucocyte) count, leucocyte (White Cell) differential count and platelet count were analysed.
The biochemical parameters estimated using Randox kits are cholesterol (CHO) [16] total protein (TP) [17], Albumin (ALB) [18], Creatinine (CREA) [19], Alanine Aminotransferase (ALT), Aspartate Aminotransferase (AST) [20], triglycerides (TG) [21], Alkaline phosphatase (ALP), Lactate dehydrogenase (LDH) [22,23], Gamma-glutamyl transferase (GGT) [24] and Urea [25]. The instructions on Randox kits manual were strictly adhered to.
Lipid peroxidation in terms of thiobarbituric acid reactive substances (TBARS) formation was measured using the method of Niehaus and Samuelsson [26]. Reduced glutathione (GSH) reacts with DTNB (5,5’-dithiobis-(2-nitrobenzoic acid) and gets reduced to a yellow coloured complex which has an absorption maximum at 412 nm. Reduced glutathione and Glutathione peroxidase (GPx) activities in plasma, kidney and liver were measured by the method of Ellman [27]. Glutathione-S-transferases (GST) catalyzes the conjugation reaction with glutathione in the first step of mercapturic acid synthesis. The activity of the enzyme was measured according to the method of Habig and Jakoby [28]. Catalase level was measured according to the method of Sinha [29]. The activity of SOD was measured following the method modified by Kakkar et al., [30].
The Heart, Liver and Kidney samples were fixed in 10 % formal saline. The tissues were processed and 3 μm thick paraffin sections of buffered formalin-fixed tissue samples were stained with heamatoxylin and eosin for photomicroscopic observations of the histological architecture of the control and treated rats. The histological architecture of the organs of the normal control group (group 1) was compared with those of the treated rats (groups 2-9).
Statistical Analysis
All the results were expressed as mean ± S.E.M. and analyzed using analysis of variance (ANOVA) statistical SPSS package (15.0) version (SPSS Inc, USA). For post hoc comparison, the Tukey HSD test was employed. p–values less than 0.05 (p ≤ 0.05) were considered to be statistically significant.
Results
Acute Toxicity
Oral and intraperitoneal administration of the extract up to 16,000 and 2,500 mg/kg respectively did not result in deleterious effect or mortality 24 hr after and within seven days post treatment irrespective of the extract doses tested.
Effect of GOV on Hematological Parameter Acetaminophen-Induced Hepatotoxic Rats
The polyherbal formulation (GOV) dose dependently caused a significant (p≤0.05) increase in the levels of Hb, PCV, RBC, WBC, Platelet count, MCHC, granulocytes and lymphocytes and also significantly (p≤0.05) reduced the levels of MCV and monocytes when compared to the APAP induced toxin control group [Table/Fig-1a,1b]. At 2 g/kg, GOV increased the Hb, MCHC and neutrophil level while the PCV was almost equal compared to Liv 52 and Silymarin groups. At 4 g/kg, GOV increased the platelet count compared to Liv 52 group while it was restored to normal with reference to the control group. When compared to the Liv 52 and silymarin groups, GOV at 8 g/kg increased the Hb and MCHC levels while the RBC, platelet counts and granulocytes levels were increased compared to Liv 52. Administration of GOV at 8 g/kg reduced the MCV level compared to all the groups.
Effect of GOV on Serum Hepatic Enzymes and Chemical Analytes on Acetaminophen Intoxicated Rats
[Table/Fig-2a] shows serum ALP, ALT, AST, LDH and GGT activities in rats fed GOV by intragastral gavage before administration of acetaminophen. The levels of serum marker enzymes were significantly (p ≤ 0.05) elevated in the toxin control group compared to the control group indicating induction of severe liver damage. Administration of GOV at the doses of 2, 4 and 8 g/kg significantly (p ≤ 0.05) repressed hepatotoxicity induced by APAP by reducing the levels of the serum marker enzymes in a dose dependent manner. At 4 and 8 g/kg, GOV lowered the level of LDH to normal indicating its hepatoprotective potentials.
Serum cholesterol, creatinine, triglyceride and BUN concentrations were significantly (p ≤0.05) increased in the APAP treated toxin 17control group of animals compared to the normal control group of animals while total protein concentrations were decreased significantly (p ≤ 0.05) indicating the induction of severe nephro-hepatotoxicity [Table/Fig-2b]. At 4 g/kg, GOV significantly increased albumin concentration and also decreased cholesterol, creatinine, triglyceride and BUN concentrations compared to the toxin control group. Treatment with different doses of GOV dose dependently decreased the concentrations of serum cholesterol, creatinine, triglyceride and BUN and that of albumin and total protein were increased compared to the toxin control group indicating its nephro-hepatoprotective potentials.
The Effects of APAP on Antioxidant Defence Enzymes of Albino Rats
Serum CAT, GPx, GSH, GST, MDA and SOD levels in rats fed GOV by intragastral gavage before administration of APAP are shown in [Table/Fig-3]. The CAT, GPx, GSH, GST and SOD activity in the APAP treated toxin control group were significantly (p≤0.05) decreased while the MDA levels were significantly (p≤0.05) increased when compared to the groups administered the different doses (2, 4 and 8 g/kg) of GOV. The GST level was reversed to normal by GOV at a dose of 2 g/kg compared to the normal control and toxin control groups while the GPx levels of the different doses of GOV were dose dependently reversed compared to Liv 52 and Silymarin groups. At 8 g/kg, GOV reduced the serum MDA level to normal. The GSH activity of GOV at 4 g/kg was almost the same as that of silymarin while Liv 52 was significantly higher than GOV at 2 and 8 g/kg.
The effect of GOV on CAT, GPx, GSH, GST, SOD and total protein activity were significantly (p ≤ 0.05) and dose dependently increased compared to the toxin control group, while the MDA activities were significantly (p ≤ 0.05) reduced as shown in [Table/Fig-4]. At 8 g/kg, GOV significantly (p ≤ 0.05) increased the activity of GSH compared to all the groups while at 4 g/kg, GOV increased the levels of GSH, GST and total protein compared to Liv 52 and Silymarin groups. The GPx levels of the different doses of GOV were restored to normal. The polyherbal formulation dose dependently reversed the nephro-toxic activity of APAP on rats compared to the control and toxin control groups.
The polyherbal formulation significantly (p ≤ 0.05) and dose dependently increased the activities CAT, GPx, GSH, GST, SOD and total protein compared to toxin control group as shown in [Table/Fig-5]. At 4 g/kg, GOV increased the GPx, GSH, SOD and total protein levels compared to Liv 52 and Silymarin groups, while the catalase activity was restored to normal compared to the control group. The liver of Liv 52 and silymarin treated animals also showed a significant (p ≤ 0.05) increase in antioxidant enzymes levels compared to acetaminophen treated rats. On treatment with different doses of GOV, MDA contents were significantly (p≤0.05) reduced compared to the toxin induced control group.
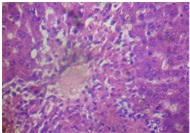
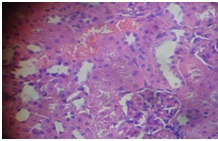
The liver of rats in the toxin group [Table/Fig-6] showed vacuolization of hepatocytes, sinusoidal dilation and centrilobullar hepatic necrosis compared to control [Table/Fig-7]. Additionally, it showed severe steatohepatitis with marked neutrophillic activity and periportal mixed necro-inflammatory cells, infiltrated with lymphocytes and Kupffer cells.
Administration of the different doses of GOV did not show diffuse microvesicular steatosis [Table/Fig-8,9and10]. However, there was minimal periportal lymphocytic infiltration with necrosis at different concentrations of the extract compared to animals in the toxin group. The morphology of liver of rats in Liv 52 and silymarin groups were almost normal.
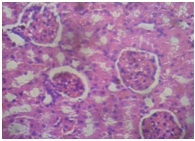
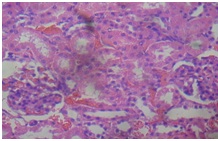
Furthermore, the Kidney [Table/Fig-11] of APAP-treated rats showed hemorrhage vacuolization, tissue oedema with few dilated blood filled vessels, tubular degeneration and necrosis while the kidney of the normal control rats [Table/Fig-12] showed normal renal glomeruli and tubules. The kidney of animals in groups 3-7 showed almost normal renal glomeruli and tubules comparable to the control [Table/Fig-13,14and15].
Discussion
In this toxicity study, treatment of rats with a toxic dose of acetaminophen caused significant (p<0.05) alterations in most of the measured hematological parameters compared to the normal control group. This result shows that APAP induced hematotoxicity can cause leukopenia, granulocytosis and neutropenia, thrombocytopenia and pancytopenia in rats. The recorded hematotoxicity could be secondary to the deleterious effect of APAP on organs of hematopoeisis in the body which include liver and kidneys. This shows that the extract could contain active biological principle(s) annulling the hematotoxic effect of APAP, with ensuing improvement of hematopoiesis. The biological principle(s) could also be arbitrating hematopoietin-like effect or augmenting the release of hematopoietin from hematopoetic organs such as the kidneys or liver.
The results reflected the hepatocellular damage in the APAP-induced hepatotoxicity animal model and is indicative of cellular leakage and loss of functional integrity of cell membrane in liver [31]. These observed elevations in APAP induced liver and kidney damage can be attributed to the release of enzymes from the cytoplasm into the blood circulation after the rupture of plasma membrane and cellular damage. Increase in serum level of ALP is due to increased synthesis, in presence of increasing biliary pressure [32]. Administration of GOV at the doses of 2, 4 and 8 g/kg significantly (p<0.05) prevented acetaminophen-induced hepatotoxicity in rats. The hepatoprotective effect of the different doses of GOV was shown by the decreases in the activities of ALT, ALP, AST, LDH and GGT. This is an indication of stabilization of plasma membrane as well as repair of hepatic tissue damage caused by acetaminophen. The reversal of increased serum enzymes in acetaminophen-induced liver damage by GOV may be due to the prevention of the leakage of intracellular enzymes by its membrane stabilizing activity. Acting as a stabilizing agent, GOV increased the stability of membrane and simultaneously attenuated the intracellular leakage of enzymes. This is in agreement with the commonly accepted view that serum levels of transaminases return to normal with the healing of hepatic parenchyma and the regeneration of hepatocytes [33]. The effects of the different doses of GOV were comparable with that of the standard drugs Liv 52 and silymarin.
The APAP induced toxicity showed a significant (p<0.05) increase in the serum cholesterol, triglyceride, urea and creatinine concentrations in the APAP induced toxin control group when compared to the normal control group. Elevation of urea and creatinine levels in the serum was taken as the index of nephrotoxicity [34]. The reduction in albumin and protein concentrations and increase in triglyceride concentration is attributed to the initial damage produced and localized in the endoplasmic reticulum which results in the loss of P450 leading to its functional failure with a decrease in protein synthesis and accumulation of triglycerides leading to fatty liver. Oral administration of GOV dose dependently and significantly (p<0.05) attenuated serum cholesterol, triglyceride, urea and creatinine concentrations and increased the albumin and total protein concentrations when compared to the toxin control group. At 4 g/kg, GOV increased the albumin concentration, lowered cholesterol and urea concentrations more than the standard drugs. The rise in protein and albumin concentrations and decrease in triglyceride concentration suggests the stabilization of endoplasmic reticulum leading to protein synthesis and the anti-hyperlipidemic effect of GOV. Silymarin, Liv 52 and the different doses of GOV decreased acetaminophen induced elevated enzyme levels in tested groups thereby, indicating the protection of structural integrity of serum, kidney and liver cell membrane or regeneration of damaged liver cells.
SOD, CAT and GPx enzymes are important scavengers of superoxide ion and hydrogen peroxide. The non-enzymic antioxidant, glutathione is one of the most abundant tripeptides present in the liver and its functions are mainly concerned with the removal of free radical species such as hydrogen peroxide, superoxide radicals and alkoxy radicals, maintenance of membrane protein thiols and as a substrate for glutathione peroxidase and GST [35]. These enzymes prevent generation of hydroxyl radical and protect the cellular constituents from oxidative damage [36]. Recent studies have demonstrated that oxidative stress is a major mechanism in the development of APAP-induced hepatotoxicity [37].
In the present study, the elevations in the levels of end products of lipid peroxidation in the serum, kidney and liver of rats treated with paracetamol were observed. The increase in malondialdehyde (MDA) levels in serum, kidney and liver of the APAP induced toxin control groups suggests enhanced lipid peroxidation leading to tissue damage and failure of antioxidant defense mechanisms to prevent formation of excessive free radicals. The result in [Table/Fig-3-5] indicates the anti-lipid peroxidation and/or adaptive nature of the systems as brought about by different doses of the polyherbal formulation against the damaging effects of free radical produced by APAP.
Administration of GOV significantly (p<0.05) increased the level of GPx and GST in a dose dependent manner. It also caused a significant (p< 0.05) increase in SOD, CAT and GSH activity and thus reduces reactive free radical induced oxidative damage, protected the tissues from highly reactive hydroxyl radicals and attenuated lipid peroxidation in the liver, kidney and blood APAP treated rat. Iroanya et al had reported the anti-oxidative effect of this formulation against ethanol induced hepatotoxicity [38]. This shows that GOV can dose dependently reduce reactive free radicals that might lessen oxidative damage to the tissues and improve the activities of the hepatic antioxidant enzyme.
The trend of the results observed from biochemical studies are corroborated by the results from histological analysis of the liver and kidney sections. The hepatoprotective property of this polyherbal mixture can be attributed to the presence of these active principles which alone or in combination may be responsible for the hepatoprotection demonstrated in this study. This indicates that GOV has hepato- and nephro-protective effects against APAP induced toxicity.
| Groups | Dose (g/kg) | PCV (%) | RBC(106/μl) | Hb (g/dl) | WBC (103/μl) | Platelet (103/μl) |
| Control (Grp 1) | | 42.86 ± 0.91(b, d) | 6.53 ± 0.17(b, d) | 12.67 ± 0.41(b) | 4.33 ± 0.27(b, d) | 36.03 ± 2.08(b) |
| Toxin Control (Grp 2) | 3 | 29.74 ±1.04(a, c, d, e) | 3.84 ± 0.146(a, c, d, e) | 7.77 ± 0.25(a, c, d, e) | 1.89 ± 0.13(a, c, d, e) | 10.63 ± 0.79(a, c, d, e) |
| GOV + APAP (Grp 3) | 2 | 40.07 ± 1.56(b) | 6.14 ± 0.08(b) | 12.51± 0.37(b) | 3.41 ± 0.25(b) | 32.19 ± 1.72(a, b) |
| (Grp 4) | 4 | 36.3 ± 1.36(a, b) | 5.27 ± 0.17(a, b, e) | 11.26 ± 0.45(b | 3.19 ± 0.32(a, b) | 35.04 ± 2.24(b) |
| (Grp 5) | 8 | 37.97 ± 0.56(b) | 6.62 ± 0.31(b, d) | 12.07 ± 0.63(b) | 3.57 ± 0.33(b) | 34.27 ± 1.73(b) |
| LIV 52+ APAP (Grp 6) | 0.3 | 40.64 ± 1.56(b) | 6.43 ± 0.28(b, d | 11.06 ± 0.32(b) | 4.26 ± 0.17(b) | 34.74 ± 2.36(b) |
| Silymarin+APAP (Grp 7) | 0.3 | 40.93(b) | 6.9 ± 1.32(b, d) | 11.59 ± 0.7(b) | 4.19 ± 0.27(b) | 38.8 ± 1.11(b) |
Values are expressed as Mean ± SEM for seven rats. The Mean difference is significant at the .05 level. (a) = p ≤ 0.05 as compared with the normal control group. (b) = p ≤0.05 as compared to APAP control group. (c) = p ≤ 0.05 as compared with the GOV + APAP (2g/kg) group. (d) = p ≤ 0.05 as compared with the GOV + APAP (4g/kg) group. (e) = p ≤ 0.05 as compared with the GOV + APAP (8g/kg) group. The significance of differences among all groups was determined by the Tukey HSD test. PCV =Packed Cell Volume, Hb = Haemoglobin, RBC = Red Cell Count, WBC = White Blood Cell
Effect of pretreatment with GOV on the hematological parameter in rats with APAP induced hepatotoxicity
| Groups | Dose (g/kg) | MCHC(%) | MCV (fl) | MCH (pg) | Granulocytes (%) | Lymphocyte (%) | Monocyte (%) |
| Control (Grp 1) | | 29.72 ± 1.22(b) | 66.01 ± 2.6(b) | 19.43 ± 0.54 | 9.16 ± 0.85(c) | 84.04 ± 1.53(b) | 6.8 ± 0.92(b) |
| Toxin Control (Grp 2) | 3 | 21.04 ± 1.35(a, c, d, e) | 78.3 ± 2.35(a, c, e) | 20.55 ± 1.43 | 6.89 ± 0.61(c, d, e) | 66.46 ± 1.47(a, c, d, e) | 26.66 ± 1.29(a, c, d, e) |
| GOV+APAP (Grp 3) | 2 | 31.2 ± 0.82(b) | 65.23 ± 3.54(b) | 20.34 ± 1.32 | 14.43 ± 0.73(a, b) | 78.17 ± 1.86(b) | 7.4 ± 1.25(b) |
| (Grp 4) | 4 | 30.96 ± 1.54(b) | 68.9 ± 2.45(e) | 21.57 ± 0.59 | 11.94 ± 0.99(b) | 80.43 ± 1.86(b) | 7.59 ± 1.08(b) |
| (Grp 5) | 8 | 33.87 ± 1.3(b) | 56.53 ± 1.14(b, d) | 18.97 ± 0.99 | 12.23 ± .76(b) | 80.04 ± 1.56(b) | 7.73 ± 1.04(b) |
| LIV 52+APAP (Grp 6) | 0.3 | 27.73 ± 1.08 | 60.25 ± 2.46(b) | 17.35 ± 0.83(d) | 11.11 ± 0.71(b) | 80.57 ± 1.42(b | 8.31 ± 0.9(b) |
| Silymarin+APAP (Grp 7) | 0.3 | 29.95 ± 3.97(b) | 59.64 ± 2.54(b) | 18.07 ± 0.59 | 12.31 ± 0.98(b) | 79.76 ± 1.46(b) | 7.93 ± 0.81(b) |
Values are expressed as Mean ± SEM for seven rats. The Mean difference is significant at the .05 level. (a) = p ≤ 0.05 as compared with the normal control group. (b) = p ≤ 0.05 as compared to APAP control group. (c) = p ≤ 0.05 as compared with the GOV + APAP (2g/kg) group. (d) = p ≤ 0.05 as compared with the GOV + APAP (4g/kg) group. (e) = p ≤ 0.05 as compared with the GOV + APAP (8g/kg) group. The significance of differences among all groups was determined by the Tukey HSD test. MCV = Mean Cell Volume, MCH = Mean Cell Haemoglobin, MCHC = Mean Cell Haemoglobin Concentration, WBC = White Blood Cell
The activities of ALT, AST, ALP, LDH and GGT in rats treated with a polyherbal formulation (GOV) and a single dose of acetaminophen (APAP)
| Group | Dose (mg/kg) | LIVER FUNCTION ENZYMES |
|---|
| ALT (U/L) | AST (U/L) | ALP (U/L) | LDH(U/L) | GGT (U/L) |
|---|
| Control (Grp 1) | | 24.2±1.2(b, c, d) | 10.3±1.0(b, c, e) | 70.0±6.5(b,c) | 14.0±1.4(b) | 1254.7±84.6(b) |
| Toxin Control (Grp 2) | 3 | 95.9±2.2(a, c, d, e) | 77.8±2.1(a, c, e) | 447.0±11.5(a, c) | 56.5±3.5(a) | 3920.0±421.1(a) |
| GOV + APAP (Grp 3) | 2 | 45.4±4.4(a, b, d, e) | 18.8±1.5(a, b) | 165.6±16.1(a,b) | 19.7±3.6(b) | 1584.0 ±57.5(b) |
| (Grp 4) | 4 | 65.1±4.7(a, b, c) | 16.8±1.0(a, b) | 116.9± 23.1(b) | 13.5± 0.6(b) | 2611.9±95.8(a,b) |
| (Grp 5) | 8 | 75.7±5.1(a, b, c) | 21.2±0.8(a,b) | 131.1±8.4(a, b) | 10.7±0.4(b) | 2518.3±81.6(a,b) |
| LIV 52 + APAP (Grp 6) | 0.3 | 47.8±3.8(a, b, d, e) | 16.55±1.67(a,b) | 93.2±7.3(b, c) | 18.36±2.6(b) | 1719.9±214.2(b) |
| Silymarin +APAP (Grp 7) | 0.3 | 28.3±3.7(b, c, d, e) | 11.1±0.4(b, c, e) | 110.1±5.3(b, c) | 10.1±1.8(b) | 1420.6±65.5(b) |
Values are expressed as Mean ± SEM for seven rats. The Mean difference is significant at the .05 level. (a) = p ≤ 0.05 as compared with the normal control group. (b) = p ≤0.05 as compared to APAP control group. (c) = p ≤ 0.05 as compared with the GOV+APAP (2 g/kg) group. (d) = p ≤ 0.05 as compared with the GOV+APAP (4 g/kg) group. (e) = p ≤ 0.05 as compared with the GOV+APAP (8 g/kg) group. The significance of differences among all groups was determined by the Tukey HSD test ALP = Alkaline Phosphatase, ALT = Alanine Aminotransferase, AST=Aspartate Aminotransferase, LDH = Lactate Dehydrogenase, GGT = L-γ-glutamyltransferase
Effect of GOV on serum ALB, CHO, CREA, TP, TG and BUN concentrations in rats treated with a polyherbal formulation (GOV) and a single dose of APAP
| Group | Dose (mg/kg) | BIOCHEMICAL PARAMEPARAMETERS |
|---|
| TP (g/L) | ALB(g/L)) | BUN (mmol/L) | CREA (mmol/L) | TG (mmol/L) | CHO (mmol/L) |
|---|
| Control (Grp 1) | | 112.8 ± 12.5(b) | 34.3±1.9 | 6.4±0.4(b) | 63.9±1.5(b) | 1.5±0.1(b) | 1.7±0.1(b) |
| Toxin Control (Grp 2) | 3 | 56.2±1.9(a) | 28.9±1.9 | 13.6±0.7(a) | 89.8±3.5(a) | 2.9±0.2(a) | 3.0±0.1(a, d) |
| GOV + APAP (Grp 3) | 2 | 71.7±6.1(a) | 35.1±0.8 | 7.5±0.3(b) | 70.0±3.1(b) | 1.9±0.2 (b) | 2.3±0.1 |
| (Grp 4) | 4 | 74.9±3.3(a) | 42.4±2.2(b) | 5.9±0.1(b) | 70.5±2.9(b) | 1.5±0.1(b) | 1.9±0.2(b) |
| (Grp 5) | 8 | 73.0±2.9(a) | 34.7±2.9 | 6.1±0.5(b) | 67.2±3.1(b) | 1.5±0.3(b) | 2.3±0.2 |
| LIV 52 + APAP (Grp 6) | 8 | 79.6±5.0(a, b) | 38.2±1.9(b) | 6.3±0.3(b) | 60.7±4.0 (b) | 2.0±0.2(b) | 2.0±0.1(b) |
| Silymarin +APAP (Grp 7) | 0.3 | 79.9±3.9(a, b) | 38.8±1.7(b) | 6.2±0.1(b) | 62.2±2.6(b) | 1.4 ± .09(b) | 2.2±0.1(b) |
Values are expressed as Mean ± SEM for seven rats. The Mean difference is significant at the .05 level. (a) = p ≤ 0.05 as compared with the normal control group. (b) = p ≤0.05 as compared to APAP control group. (c) = p ≤ 0.05 as compared with the GOV+APAP (2 g/kg) group. (d) = p ≤ 0.05 as compared with the GOV+APAP (4 g/kg) group. (e) = p ≤ 0.05 as compared with the GOV+APAP (8 g/kg) group. The significance of differences among all groups was determined by the Tukey HSD test ALB = Albumin, CREA = Creatinine, CHO = Cholesterol, TP = Total Protein, TG = Triglyceride, BUN = Blood Urea Nitrogen
The effect of APAP damage on serum antioxidant enzymes in rats pretreated with GOV
| Groups | Dose (g/kg) | CAT (μmol/min/mg protein) | GPx (μmol/ml) | GSH(μmol/ml) | GST (μmol/ml) | MDA(nmol/ml) | SOD (μmol/ml) | TP (g/l) |
| Control (Grp 1) | | 68.73 ± 2.9(b) | 5.38 ± 0.03(b) | 19.29 ± 0.53(b) | 65.01 ± 3.13(b, e) | 27.25 ± 1.68(b) | 77.43± 2.63(b, c, d, e) | 148.50 ± 12.48(b) |
| Toxin Control (Grp 2) | 3 | 26.57± 1.18(a, c, d, e) | 2.2 ± 0.002(a, c, d, e) | 4.18 ± 0.26(a, c, d, e) | 30.58 ± 1.78(a, c, d, e) | 88.81± 0.74(a, c, d, e) | 32.21± 1.51(a, c, d, e) | 57.67 ± 2.58(a) |
| GOV+APAP (Grp 3) | 2 | 57.75 ± 1.45(b) | 4.96 ± 0.26(b) | 12.91 ± 0.78(a, b) | 67.48 ± 2.21(b, d, e) | 35.08 ± 1.64(b) | 54.36 ± 0.81(a, b) | 71.67± 6.14(a) |
| (Grp 4) | 4 | 68.3 ± 1.53(b) | 5.16 ± 0.72(b) | 13.81 ± 0.47(a, b) | 53.71 ± 2.03(b, c) | 32.87 ± 1.53(b) | 59.29 ± 1.84(a, b) | 73.44 ± 3.7(a) |
| (Grp 5) | 8 | 55.97± 2.77(b) | 4.75 ±0.48(b) | 13.2 ± 0.26(a, b) | 48.12 ± 3.37(a, b, c) | 29 ± 3.1(b) | 59.83± 7.08(a, b) | 68.74± 3.35(a) |
| LIV 52+APAP (Grp 6) | 0.3 | 82.07± 5.64(b, c, e) | 4.9 ±0.003(a, c, d, e) | 15.77 ± 0.6(a, b, c, e) | 53.36 ± 2.75(b, c) | 26.16 ± 2.69(b) | 63.79 ± 3.79(b) | 63.91 ± 4.16(a) |
| Silymarin+APAP (Grp 7) | 0.3 | 84.76 ± 4.4(a, c, d, e) | 5.2 ± 0.02(a, c, d, e) | 13.88 ± 0.64(a, b) | 56.63 ± 2.98(b) | 26.3± 3.4(b) | 73.85 ± 4.45(b, c) | 71.32 ± 0.8(a) |
Values are expressed as Mean ± SEM for seven rats. The Mean difference is significant at the .05 level. (a) = p ≤ 0.05 as compared with the normal control group. (b) = p ≤0.05 as compared to APAP control group. (c) = p ≤ 0.05 as compared with the GOV+APAP (2 g/kg) group. (d) = p ≤ 0.05 as compared with the GOV+APAP (4 g/kg) group. (e) = p ≤ 0.05 as compared with the GOV+APAP (8 g/kg) group. The significance of differences among all groups was determined by the Tukey HSD test. CAT = Catalase, GPx = Glutathione Peroxidase, GSH = Reduced Glutathione, GST = Glutathione-S-Transferase, MDA = Malondialdehyde, SOD = Superoxide Dismutase, TP = Total protein
The effect of APAP damage on kidney antioxidant enzymes in rats pretreated with GOV
| Groups | Dose (g/kg) | CAT (μmol/min/mg protein) | GPx (μmol/ml) | GSH(μmol/ml) | GST (μmol/ml) | MDA(nmol/ml) | SOD (μmol/ml) | TOTAL PR OTEIN (g/l) |
| Control (Grp 1) | | 238.42 ± 18.04(b) | 0.46 ± 0.01 (b) | 0.91 ± 0.08(b, c, e) | 81.71 ± 1.79(b, c, e) | 30.48 ± .71(b, c | 49.1± 0.88 (b, d) | 17.95 ± 0.32(b, c, d, e) |
| Toxin Control (Grp 2) | 3 | 88.81 ± 3.37(a ,c, d, e) | 0.3 ± 0.01(a, c, d, e) | 0.43 ± 0.03 (a, d, e) | 43.81 ± 2.55(a, d, e) | 56.64 ± 2. 8(a, c, d, e) | 28.72 ± 1.18 (a, c, e) | 7.86 ± 0.43(a, c, d, e) |
| GOV+APAP (Grp 3) | 2 | 193.38 ± 20.49(b) | 0.49 ± 0.03(b) | 0.59 ± 0.03(a, e) | 58.57± 0.78 (a, b) | 41.4 ± 1.5(a, b, d, e) | 42.16 ± 1.88(b) | 11.69 ±0 .76 (a, b) |
| (Grp 4) | 4 | 208.92 ± 4.12(b) | 0.46± 0.02(b) | 0.83 ± 0.04(b, e) | 70.19 ± 1.62(b) | 32.33± 0.92(b, c) | 36.8 ± 2.22(a) | 12.57 ± 0.29(a, b) |
| (Grp 5) | 8 | 204.61 ± 3.17(b) | 0.47 ± 0.01(b) | 1.41 ± 0.01(a, b, c, d) | 67.87± 1.31(a, b) | 31.48±0.89(b, c) | 39.98± 1.59(b) | 12.32±0.48(a, b) |
| LIV 52+APAP (Grp 6) | 0.3 | 247.8 ± 19.03 (b) | 0.6 ± 0.02 (a, b, c, d, e) | 1.12 ± 0.1(b, c, d, e) | 56.19 ± 0.77 (a, b, d) | 29.67 ± 0.63(a, b, c, d, e) | 40.1 ± 4.12(b) | 13.71 ± 0.21(a, b, c) |
| Silymarin+APAP (Grp 7) | 0.3 | 280.05 ± 27.85 (b, c, e) | 0.62 ± 0.03(a, b, c, d, e) | 0.76 ± 0.04 (a, b) | 70.33 ± 5.91(b) | 29.87 ± 2.06(b, c) | 44.11 ± 3.39 (b) | 12.85 ± 0.47(a, b) |
Values are expressed as Mean ± SEM for seven rats. The Mean difference is significant at the .05 level. (a) = p ≤ 0.05 as compared with the normal control group. (b) = p ≤0.05 as compared to APAP control group. (c) = p ≤ 0.05 as compared with the GOV+APAP (2 g/kg) group. (d) = p ≤ 0.05 as compared with the GOV+APAP (4 g/kg) group. (e) = p ≤ 0.05 as compared with the GOV+APAP (8 g/kg) group. The significance of differences among all groups was determined by the Tukey HSD test. CAT = Catalase, GPx = Glutathione Peroxidase, GSH = Reduced Glutathione, GST = Glutathione-S-Transferase, MDA = Malondialdehyde, SOD = Superoxide Dismutase, TP = Total protein
The effect of APAP damage on kidney antioxidant enzymes in rats pretreated with GOV
| Groups | Dose (g/kg) | CAT (μmol/min/mg protein) | GPx (μmol/ml) | GSH(μmol/ml) | GST (μmol/ml) | MDA(nmol/ml) | SOD (μmol/ml) | TP(g/l) |
| Control (Grp 1) | | 54.22 ± 4.07 (b) | 0.6 ± 0.02(b, c, d, e) | 1.31 ± 0.11(b, c, d, e) | 112.57 ± 4.02(b, d, e) | 32.21 ± 0.91(b, c, d) | 62.05 ± 3.16(b, c, d, e) | 22.65 ± 0.72(b, c, d, e) |
| Toxin Control (Grp 2) | 3 | 27.64 ± 19.59(a, c, d) | 0.29 ± 0.01(a, c, d, e) | 0.6 ± 0.01(a, c, d, e) | 65.48 ± 1.29(a, c, d) | 51.42 ± 3.14(a, c, d, e) | 34.85 ± 2.72(a, c) | 9.7 ± 0.53(a, c, d, e) |
| GOV+APAP (Grp 3) | 2 | 44 ± 4.48(b) | 0.49 ± 0.01(a, b, e) | 0.89 ± 0.04(a, b) | 123.1 ± 3.13(b, d, e) | 41.95 ± 1.73(a, b) | 39.78 ± 2.69(a) | 14.65 ± 0.2(a, b) |
| (Grp 4) | 4 | 54.04 ± 1.88(b) | 0.51 ± 0.02(a, b, e) | 1.05 ± 0.02(a, b | 91.33 ± 2.11(a, b, c, e) | 39.62 ± 1.31(a, b) | 48.4 ± 3.93(a, b) | 16.29 ± 0.3(a, b) |
| (Grp 5) | 8 | 42.47 ± 4.15 | 0.4 ± 0.02(a, b, c, d) | 0.94 ± 0.01(a, b) | 76.38 ± 2.22(a, c, d) | 36.1 ± 0.6(b) | 46.82 ± 1.38(a) | 15.02 ± 0.68(a, b) |
| LIV 52+APAP (Grp 6) | 0.3 | 61.94 ± 3.9(b, c, e) | 0.45 ± 0.03(a, b) | 1.11 ± 0.08(b) | 96.88 ± 4.48(a, b, c, e) | 35.34 ± 1.16(b) | 50.29 ± 4.28(b) | 16.95 ± 0.42(a, b, c) |
| Silymarin+APAP (Grp 7) | 0.3 | 63.27 ± 3.58(b, c, e) | 0.53 ± 0.03(b, e) | 1.17 ± 0.03(b, c) | 103.33 ± 2.51(b, c, e) | 30.63 ± 0.6(b, c, d) | 51.52 ± 0.89(b) | 17.06 ± 0.5(a, b, c) |
Distilled water + APAP (liver)
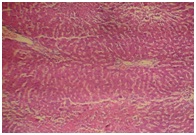
Extract 2 g/kg + APAP (liver)
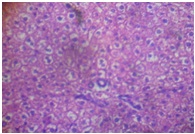
Extract 4 g/kg + APAP (liver)

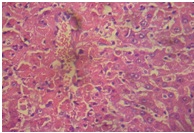
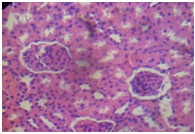
Distilled water + APAP (kidney)
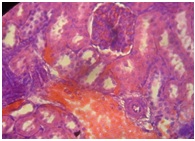
GOV (4 g/kg) + APAP (kidney)
GOV (8 g/kg) + APAP (kidney)
Conclusion
The hepato- and nephro- protective property of this polyherbal mixture can be attributed to the presence of its active principles which alone or in combination may be responsible for the hepatoprotection demonstrated in this study. This indicates that GOV has hepato and nephroprotective effects against APAP induced toxicity. It suggests the potential use of this polyherbal mixture as a hepato and nephroprotective agent. Further studies are however needed to elucidate its hepato and nephroprotective mechanisms, isolate the specific bioactive components responsible for the hepato and nephroprotective action and establish its mechanism of action.
Values are expressed as Mean ± SEM for seven rats. The Mean difference is significant at the .05 level. (a) = p ≤ 0.05 as compared with the normal control group. (b) = p ≤0.05 as compared to APAP control group. (c) = p ≤ 0.05 as compared with the GOV + APAP (2g/kg) group. (d) = p ≤ 0.05 as compared with the GOV + APAP (4g/kg) group. (e) = p ≤ 0.05 as compared with the GOV + APAP (8g/kg) group. The significance of differences among all groups was determined by the Tukey HSD test. PCV =Packed Cell Volume, Hb = Haemoglobin, RBC = Red Cell Count, WBC = White Blood Cell
Values are expressed as Mean ± SEM for seven rats. The Mean difference is significant at the .05 level. (a) = p ≤ 0.05 as compared with the normal control group. (b) = p ≤ 0.05 as compared to APAP control group. (c) = p ≤ 0.05 as compared with the GOV + APAP (2g/kg) group. (d) = p ≤ 0.05 as compared with the GOV + APAP (4g/kg) group. (e) = p ≤ 0.05 as compared with the GOV + APAP (8g/kg) group. The significance of differences among all groups was determined by the Tukey HSD test. MCV = Mean Cell Volume, MCH = Mean Cell Haemoglobin, MCHC = Mean Cell Haemoglobin Concentration, WBC = White Blood Cell
Values are expressed as Mean ± SEM for seven rats. The Mean difference is significant at the .05 level. (a) = p ≤ 0.05 as compared with the normal control group. (b) = p ≤0.05 as compared to APAP control group. (c) = p ≤ 0.05 as compared with the GOV+APAP (2 g/kg) group. (d) = p ≤ 0.05 as compared with the GOV+APAP (4 g/kg) group. (e) = p ≤ 0.05 as compared with the GOV+APAP (8 g/kg) group. The significance of differences among all groups was determined by the Tukey HSD test ALP = Alkaline Phosphatase, ALT = Alanine Aminotransferase, AST=Aspartate Aminotransferase, LDH = Lactate Dehydrogenase, GGT = L-γ-glutamyltransferase
Values are expressed as Mean ± SEM for seven rats. The Mean difference is significant at the .05 level. (a) = p ≤ 0.05 as compared with the normal control group. (b) = p ≤0.05 as compared to APAP control group. (c) = p ≤ 0.05 as compared with the GOV+APAP (2 g/kg) group. (d) = p ≤ 0.05 as compared with the GOV+APAP (4 g/kg) group. (e) = p ≤ 0.05 as compared with the GOV+APAP (8 g/kg) group. The significance of differences among all groups was determined by the Tukey HSD test ALB = Albumin, CREA = Creatinine, CHO = Cholesterol, TP = Total Protein, TG = Triglyceride, BUN = Blood Urea Nitrogen
Values are expressed as Mean ± SEM for seven rats. The Mean difference is significant at the .05 level. (a) = p ≤ 0.05 as compared with the normal control group. (b) = p ≤0.05 as compared to APAP control group. (c) = p ≤ 0.05 as compared with the GOV+APAP (2 g/kg) group. (d) = p ≤ 0.05 as compared with the GOV+APAP (4 g/kg) group. (e) = p ≤ 0.05 as compared with the GOV+APAP (8 g/kg) group. The significance of differences among all groups was determined by the Tukey HSD test. CAT = Catalase, GPx = Glutathione Peroxidase, GSH = Reduced Glutathione, GST = Glutathione-S-Transferase, MDA = Malondialdehyde, SOD = Superoxide Dismutase, TP = Total protein
Values are expressed as Mean ± SEM for seven rats. The Mean difference is significant at the .05 level. (a) = p ≤ 0.05 as compared with the normal control group. (b) = p ≤0.05 as compared to APAP control group. (c) = p ≤ 0.05 as compared with the GOV+APAP (2 g/kg) group. (d) = p ≤ 0.05 as compared with the GOV+APAP (4 g/kg) group. (e) = p ≤ 0.05 as compared with the GOV+APAP (8 g/kg) group. The significance of differences among all groups was determined by the Tukey HSD test. CAT = Catalase, GPx = Glutathione Peroxidase, GSH = Reduced Glutathione, GST = Glutathione-S-Transferase, MDA = Malondialdehyde, SOD = Superoxide Dismutase, TP = Total protein
[1]. O Morebise, MA Fafunso, JM Makinde, O Olajide, EO Awe, Antiinflamatory property of the leaves of Gongronema latifolium. Phytotherapy Research 2002 1516(s1) Edition:S75-S77.doi: 10.1002/ptr.784. [Google Scholar]
[2]. OO Ogundipe, JO Moody, TO Akinyemi, A Raman, Hypoglycemic potentials of methanolic extracts of selected plant foods in alloxanized mice. Plant Foods Hum Nutr. 2003 58(3):1-7.doi: 10.1023/B:QUAL.0000040321.56831.c4. [Google Scholar]
[3]. NH Ugochukwu, NE Babady, M Cobourne, SR Gasset, The effect of Gongronema latifolium leaf extract on serum lipid profile and oxidative stress of hepatocytes of diabetic rats.J Biosci. 2003 28:1-5. [Google Scholar]
[4]. AF Eleyinmi, Chemical composition and antibacterial activity of Gongronema latifolium.J Zhejiang Univ Sci B. 2007 11(5):352-358.doi: 10.1631/jzus.2007.B0352. PMCID: PMC1859873 [Google Scholar]
[5]. LP Usip, KN Opara, ES Ibanga, IA Atting, Longitudinal evaluation of repellent activity of Ocimum gratissimum (Labiatae) volatile oil against Simulium damnosum. Mem Inst Oswaldo Cruz. 2006 101(2):201-05. [Google Scholar]
[6]. P Erasto, DS Grierson, AJ Afolayan, Bioactive sesquiterpene lactones from the leaves of Vernonia amygdalina.J Ethnopharmacol. 2006 106(1):117-20. [Google Scholar]
[7]. AM Larson, J Polson, RJ Fontana, TJ Davern, E Lalani, LS Hynan, Acute Liver Study Group. Acetaminophen-induced acute liver failure: Results of a United States multicenter, prospective study.Hepatology. 2005 42:1364-72. [Google Scholar]
[8]. LC Hawkins, JN Edwards, PI Dargan, Impact of restricting paracetamol pack sizes on paracetamol poisoning in the United Kingdom: a review of the literature.Drug Safety. 2007 30:465-79. [Google Scholar]
[9]. M Khashab, AJ Tector, PY Kwo, Epidemiology of acute liver failure.Curr Gastroenterol Rep. 2007 9:60-73.doi:10.1007/s11894-008-0023-x. PMID 17335680. [Google Scholar]
[10]. FF Daly, JS Fountain, L Murray, A Graudins, NA Buckley, Guidelines for the management of paracetamol poisoning in Australia and New Zealand— explanation and elaboration. A consensus statement from clinical toxicologists consulting to the Australasian poisons information Centres.Medical Journal of Australia. 2008 188:296-301. [Google Scholar]
[11]. RF Borne, MA Fafunso, JM Makinde, O Olajide, EO Awe, Nonsteroidal Anti-inflammatory Drugs in Principles of Medicinal Chemistry, 1995 Fourth EditionEdition. Eds. Foye, William O.; Lemke, Thomas L.; Williams, David A. Published by Williams & Wilkins.:544-45. [Google Scholar]
[12]. RG Hendrickson, RE Bizovi, Acetaminophen, in Nelson, Lewis H; Flomenbaum, Neal; Goldfrank, Lewis R, et al. Goldfrank’s Toxicologic Emergencies. Plant Foods Hum Nutr. 2006 New YorkMcGraw Hill:525-7.doi: 10.1023/B:QUAL.0000040321.56831.c4. [Google Scholar]
[13]. FJ Baker, Introduction to Medical Laboratory Technology. 1976 London WC Butterworth and Co. (Publishers) Ltd. 88. Kindsway:23-6AB. [Google Scholar]
[14]. B Bain, I Bates, Basic haematological techniques. Dacie and Lewis practical haematolog.Church, Livingstone. 2001 London:20-22. [Google Scholar]
[15]. RA McPherson, Pincus MR. Henry’s Clinical Diagnosis and Management by Laboratory Methods.Pa. WB Saunders 2007 21st EditionPhiladelphia:461-2. [Google Scholar]
[16]. P Roeschlau, E Bernt, W Gruber, Enzymatic determination of total cholesterol in serum.Zeitschrift Klinikal Chemistry and Klinikal Biochemistry. 1974 12:226 [Google Scholar]
[17]. TE Weichselbaum, Estimation of serum total protein by Biruet method.American Journal of Clinical Pathology. 1946 16:40-48. [Google Scholar]
[18]. BT Doumas, WA Watson, HG Biggs, Albumin standards and measurement of serum albumin with bromcresol green.Clinica Chimica Acta. 1971 31:87-96. [Google Scholar]
[19]. H Bartels, M Bohmer, C Heierli, Serum creatinine determination without protein precipitation. Clinica Chimica Acta. 1972 37:193-97. [Google Scholar]
[20]. S Reitman, S Frankel, A colorimetric method for the determination of serum glutamic oxalacetic and glutamic pyruvic transaminases.American Journal of Clinical Patholology. 1957 28:56-63. [Google Scholar]
[21]. P Trinder, MA Fafunso, JM Makinde, O Olajide, EO Awe, Determination of glucose in blood using glucoseoxidase with an alternative oxygen acceptor.Ann Clin Biochem. 1969 6:24- Á27. [Google Scholar]
[22]. Rec G.S.C.C. Determination of α-hydroxybutyrate dehydrogenase α-HBDH) activity in serum. DGKC method. Journal of Clinical Chemistry and Clinical Biochemistry. 1970 8:658 [Google Scholar]
[23]. Rec GSCC (DGKC) Optimised standard colorimetric methods.Journal of Clinical Chemistry and Clinical Biochemistry. 1972 10:182 [Google Scholar]
[24]. G Szasz, A kinetic photometric method for serum gamma-glutamyl transpeptidase. Clinical Chemistry. 1969 22:124-36. [Google Scholar]
[25]. JP Kassirer, Clinical evaluation of kidney function - glomerular function.New England Journal of Medicine. 1971 285:385-89. [Google Scholar]
[26]. WG Niehaus, B Samuelsson, Formation of malondialdehyde from phospholipid arachidonate during microsomal lipid peroxidation.European Journal of Biochemistry. 1968 6:126-130. [Google Scholar]
[27]. GL Ellman, Tissue sulphydryl groups.Archives of Biochemistry and Biophysics. 1959 82:70-77. [Google Scholar]
[28]. WH Hagib, MJ Pabst, WB Jakoby, Glutathione-S-Transferase, the first enzymatic step in mercapturic acid formation.Journal of Biological Chemistry. 1974 249:7130-39. [Google Scholar]
[29]. KA Sinha, Epidemiology of acute liver failure.Analytical Biochemistry. 1972 47:389-94. [Google Scholar]
[30]. P Kakkar, B Das, PN Viswanathan, A modified spectrophotometric assay of superoxide dismutase (SOD).Indian Journal of Biochemistry and Biophysics. 1984 21:130-32. [Google Scholar]
[31]. B Saroswat, PK Visen, GK Patnalik, BN Dhawan, Anticholestic effect of picroliv, active hepatoprotective principle of Picrorhizza kurrooa, against carbon tetrachloride induced cholestasis.Ind J Exp Biol. 1993 31:316-18. [Google Scholar]
[32]. P Muriel, T Garcipiana, Silymarin protects against paracetamol-induced lipid peroxidation and liver damage. J. Appl. Toxicol. 1992 12:439-42. [Google Scholar]
[33]. M Thabrew, PA Joice, Comparative study of the efficacy of Pavetta indica and Osbeckia octanda in the treatment of liver dysfunction.Planta. Med. 1987 53:239-41. [Google Scholar]
[34]. B Patwardhan, D Warude, P Pushpangadan, N Bhatt, Ayurveda and Traditional Chinese medicine: a comparative overview.Evid Based. Compl Altern Med. 2005 2(4):465-73. [Google Scholar]
[35]. J Prakash, SK Gupta, V Kochupillai, N Singh, YK Gupta, S Joshi, Chemopreventive activity of Withania somnifera in experimentally induced fibrosarcoma tumo-urs in swiss albino mice.Phytother Res. 2001 15:240-44. [Google Scholar]
[36]. MD Scott, BH Lubin, L Zuo, FA Kuypers, Erythrocyte defense against hydrogen peroxide: preeminent importance of catalase. J Lab Clin Med. 1991 118:7-16. [Google Scholar]
[37]. B Rajkapoor, Y Venugopal, J Anbu, N Harikrishnan, M Gobinath, V Ravichandran, Protective effect of Phyllanthus polyphyllus on acetaminophen induced hepatotoxicity in rats.Journal of Pharmaceutical Sciences. 2008 21(1):57-62. [Google Scholar]
[38]. O Iroanya, J Okpuzor, S Akindele, Anti-Oxidative Effect of a Triherbal Formulation against Ethanol Induced Hepatotoxicity.Res. J. Pharm. Biol. Chem. Sci. 2011 2:1153-67. [Google Scholar]