Validation is associated with ensuring and checking that the product complies with set requirements and satisfies certain defined criteria. The laboratory must demonstrate that their tests/methods are fit for the intended use before application to patient samples [1]. The introduction of a new method or new instrument in addition to the existing instruments is a common occurrence in clinical biochemistry laboratory. The performance of the new method or new instrument should be evaluated thoroughly before its routine use in the laboratory [2,3]. The semi-automated analysers are replaced by completely automated analysers to minimize analytical errors and to improve the turnaround time. The new analyser should have acceptable accuracy, precision, measuring range and should be free from interferents. Blood gas measurements and electrolytes are often performed in Point-Of-Care (POC) settings as well as larger clinical laboratories. Even a slight error in reporting ABG and electrolytes can have serious adverse effects on patient management especially critically ill patients. When a new POC analyser is obtained, the performance of the analyser should be validated. The new analyser was cobas b121 from roche diagnostics and rapid lab ABG analyser from Siemens was the existing ABG analyser in our laboratory which was a validated one. Both the ABG analysers (Cobas b121 and rapid lab – Siemens) were based on the principle of ion selective electrode method. Cobas b121 is a ABG analyser which can measure parameters which are critical for decision making. It calibrates by means of fluid system. The sample volume required is 60 micro liters and the results are available within 50 seconds. The operator intervention is least and most of the analyser operations are automated. The aim of our study was to validate the method performance of pH, PCO2, PO2, Na+, K+ of cobas b121 ABG (Arterial blood gas) analyser in our laboratory with the reference ABG analyser – Rapid Lab (siemens) which was well validated and calibrated.
Materials and Methods
The study period was during April and May 2013 at Pondicherry Institute of Medical Sciences (PIMS). The study was a comparative study.
Inclusion criteria
Only the ABG samples that were sent to laboratory in heparinized syringes and ice packs were included in the study. Only those samples which were received by the laboratory within 10 mins of sample collection were included in the study.
Exclusion criteria
Any ABG sample which did not fulfill the inclusion criteria were excluded from the study. Under aseptic precautions, 2 ml of ABG sample were collected in heparinized syringes from radial artery.
Validation of analyser was done by measuring its accuracy, precision and correlation coefficient. The accuracy was assessed by calculating the bias. Bias is the systematic difference between the expected results obtained by the laboratory’s test method and the results that would be obtained from an accepted reference method. The reference method is the validated method & in our study it was Rapid lab values. 50 patient samples were run on cobas b121 and rapid lab (siemens) ABG analysers simultaneously. The bias was calculated for individual samples run on both the ABG analysers and the mean bias obtained was compared with the Total allowable error as per CLIA (Clinical laboratory improvement amendments) guidelines. Bias was calculated by the following formula:
All control samples were measured on both ABG analysers daily. Every control sample result was plotted on the Levey-Jennings chart and checked for acceptability according to Westgard rules (target value ± 2 standard deviations). If control sample value was within acceptable limits, ABG samples were run and bias was calculated. If results were not within acceptable range, control samples were re-run with fresh control samples. If the control values were still found outside control limits, calibration was performed and control samples were rerun and when found within acceptable limits, only then ABG samples were run and bias was calculated.
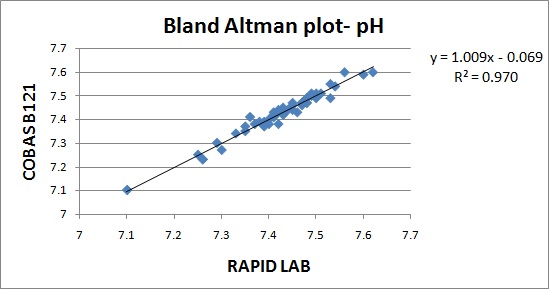
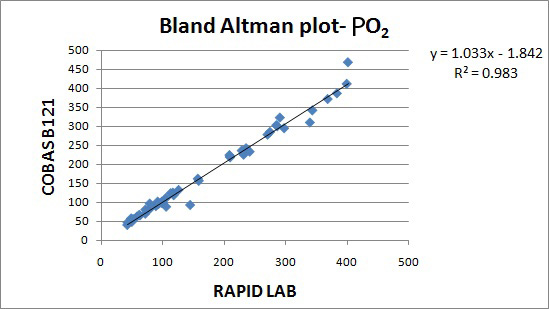
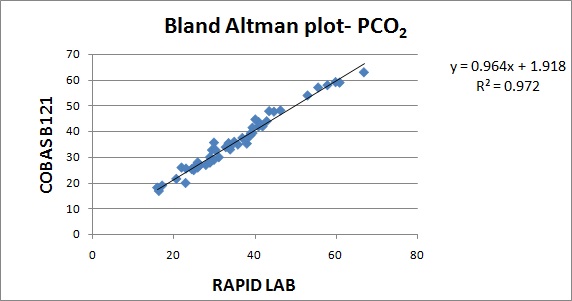
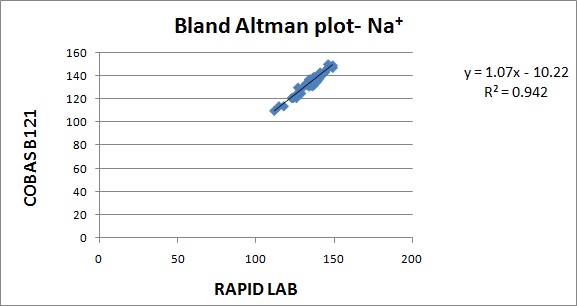
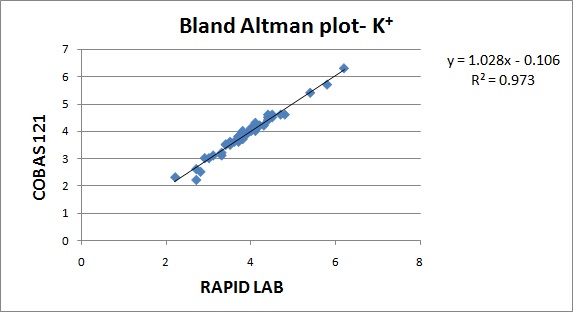
Precision was assessed by calculating the Coefficient of variance (CV). CV% is the analytical coefficient of variation of the test method. Coefficient of variance (CV) were calculated from Biorad internal QC (lot number – 22221) for the parameters. Correlation between the analysers were done by regression analysis. Correlation coefficient was calculated from the patient samples run on both the analysers. The values obtained in Cobas b121 and Rapid lab was represented by Bland Altman plot. The parameters validated were pH, PO2, PCO2, Na+ & K+.
Results
The results are represented in Bland Altman plot. The intercept, slope, correlation coefficient for all the parameters are given in [Table/Fig-1]. The correlation coefficient for all the parameters were close to 1 indicating good correlation. The average bias and allowable bias for the parameters are given in [Table/Fig-2]. The observed bias for all the parameters were within the allowable bias as per CLIA guidelines. The Bland Altman plot for pH, PO2, PCO2, Na+& K+ are illustrated in [Table/Fig-3,4,5,6 and 7]. The CV values for the parameters are mentioned in [Table/Fig-8]. The CV values for all the parameters were within 5% indicating good precision.
Intercept, slope & correlation coefficient of parameters studied
| Parameter | Intercept | Slope | Correlation Coefficient (r) |
|---|
| pH | -0.06 | 1.00 | 0.984 |
| PO2 | -1.8 | 1.03 | 0.989 |
| PCO2 | +1.9 | 0.96 | 0.984 |
| Na+ | -10.2 | 1.07 | 0.969 |
| K+ | -0.10 | 1.02 | 0.984 |
Average bias and allowable bias of parameters studied
| Parameter | Average bias | Allowable bias |
|---|
| pH | 0.006 % | 0.04 % |
| PO2 | -7.5% | +3SD |
| PCO2 | 0.4 % | 5 % |
| Na+ | 0.85 % | 4.0 % |
| K+ | 0.16 % | 0.50 % |
CV% of parameters studied
| Parameter | CV% |
|---|
| pH | 0.1 |
| PO2 | 2.7 |
| PCO2 | 2.4 |
| Na+ | 1.0 |
| K+ | 1.0 |
Discussion
Documentation of laboratory methods, particularly method selection, method performance and validation has assumed a new significance with the introduction of ISO/IEC 17025. Accreditation bodies, like College of American Pathologists (CAP) and National Accreditation Board for Testing and Calibration Laboratories, India (NABL) require that laboratories validate the performance of tests regularly [4]. Method validation is one of the essential components in achieving Total Quality Management in a new clinical laboratory. Validation ensures that accurate and precise results are reported in a clinically relevant turnaround time [4]. The values of bias and precision obtained from the validation studies can be used to plan the Quality control (QC) protocol for the analyser. According to FDA, validation is “Establishing documented evidence which provides a high degree of assurance that a specific process will consistently produce a product meeting its predetermined specifications and quality attributes” [5]. Each laboratory is responsible for validating the test methods being done in their laboratory. Majority of the manufacturers often support the laboratory in validating the newly installed analyser [4].
In our study, the CVs for all the parameters were less than 5 %. In a validation study done by V.S.Smolcic et al., the parameters that did not meet the required precision were total protein, albumin, calcium, sodium, chloride, Immunoglobulins and HDL cholesterol. In our study, the observed bias for all the parameters were within the acceptable limits suggested by CLIA guidelines. In a validation study done by V.S.Smolcic et al., all the parameters fulfilled the required degree of accuracy except total protein, calcium, sodium and chloride [2]. In our study, the r2 obtained for the parameters pH,PO2, PCO2, Na+, K+ were 0.970, 0.983, 0.972, 0.942, 0.973.The symbol for correlation of determination is by r2. It is the square of coefficient of correlation. The degree of linear correlation of variables is determined by coefficient of determination. In a validation study done by Barnali Das on ALP, r2 observed was 0.99 indicating high degree of linear correlation [4].
Jasna Jurice k et al., did a study on validation of olympus AU2700 plus analyser and observed that precision and accuracy for majority of analytes were within acceptable limits except for sodium and chloride. Instrument was fully comparable with Olympus AU2700 analytical analyser for all analytes expect few analytes like ALT, RF, sodium, CK, total bilirubin and triglycerides showed minor deviations [6]. According to ISO 15189 standard, assigned turn-around time (TAT) is 1 hour for emergency tests. This TAT can certainly be achieved by having two analysers with comparable results. If laboratory results are not comparable from different analytical systems, possibility for incorrect diagnosis and poor quality of patient care is increased [7]. Laboratory errors may be preanalytical, analytical or postanalytical. It has been proved in many studies that preanalytical errors are more common than analytical errors [8]. Analytical errors due to analyser malfunction can be completely avoided by having two comparable functional analysers [7].
Conclusion
Based on the values obtained for correlation coefficient, bias and CV for all the parameters, it can be concluded that the new ABG analyser, Cobas b121 correlated well with the reference ABG analyser (Rapid Lab) and could be used to run patient samples.