Red Cell Distribution Width and Serum BNP Level Correlation in Diabetic Patients with Cardiac Failure: A Cross – Sectional Study
Subhashree A.R.1
1 Professor, Department of Pathology, Sree Balaji Medical College, Bharath University, Chrompet, Chennai, India.
NAME, ADDRESS, E-MAIL ID OF THE CORRESPONDING AUTHOR: Dr. Subhashree A.R. Professor, Department of Pathology, Sree Balaji Medical College, Chrompet, Chennai.
Phone: 9003021029,
E-mail: Subhashree_sai@yahoo.in
Introduction: Red cell distribution width (RDW) is a red cell measurement given by fully automated hematology analyzers. It is a measure of heterogeneity in the size of circulating erythrocytes. Studies have shown that it is a prognostic marker in non - anemic diabetic patients with symptomatic cardiovascular disease but its correlation with cardiac failure in diabetics has not been studied so far. Moreover, studies have also shown that a higher RDW may reflect an underlying inflammatory state. Since Diabetes is a pro inflammatory state there is a possibility that it might have an influence on the RDW values even when there is no cardiac failure, but research data on this aspect is lacking.
B-type natriuretic peptide (BNP) is a proven marker for cardiac failure whose values are comparable with echo cardio graphic findings in assessing the left ventricular dysfunction.
Aim and Objectives: This study aimed to find out the correlation between RDW% and serum BNP levels in Diabetics with heart failure (cases) when compared to those without failure (controls). Further, we compared the RDW % values of the cases with controls.
Settings and Design : The study was approved by institutional ethical and research committee. A cross-sectional study was conducted with patients attending the Diabetes clinic of a tertiary care hospital in Chennai, India, during the period of October to December 2013.
Hundred known cases of type II Diabetes mellitus attending Diabetes centre of the Hospital, with clinical and Echo cardio graphic features of cardiac failure were included as cases. Hundred age and gender matched diabetics with negative history of cardiovascular disease and with normal Echo cardio graphic features were included as controls. Informed consent was obtained from all the cases and controls.
Demographic data and clinical history were gathered from all the cases and controls by using a standardized self – administered questionnaire.
Biochemical and hematological parameters which included Fasting and Postprandial blood sugar, Glycosylated hemoglobin, Complete Blood count including RDW and serum BNP were performed for all the cases and controls.
Statistical Analysis: Results were tabulated and analysed using SPSS 20.0 version
Results: A statistically significant correlation (p<.001) was found between Red cell Distribution Width % and Serum B type Natriuretic Peptide values in the cases. Further, RDW% showed a statistically significant difference between cases and controls.
Conclusion: RDW% can be used as a screening parameter to identify cardiac failure in Diabetic patients similar to non-diabetic cardiac failure. RDW% values are significantly higher in cases of Diabetes with failure in comparison to uncomplicated Diabetes.
BNP (B type Natriuretic Peptide), Cardiac failure, Diabetes mellitus, RDW (Red cell Distribution Width)
Introduction
Red cell distribution width (RDW) is a measurement that quantitates heterogeneity of red cell volume. Though it was originally used as an index to classify anemias [1], studies have now shown its usefulness as a prognostic marker of Cardio vascular disease [2] and in particular of heart failure [3]. But not many studies have assessed its association with other failure markers especially in diabetic cases. Studies have also indicated that a higher RDW may reflect an underlying inflammatory state [4,5].
B-type natriuretic peptide (BNP) is a marker for left ventricular dysfunction (cardiac failure) whose diagnostic potential has been proven by many studies [6].
Aims and Objectives
This study aimed to find out the correlation between RDW% and serum BNP levels in Diabetics with heart failure (cases) when compared to those without failure (controls).
Settings and Design
A cross-sectional study was conducted with patients attending the Diabetes OPD of the institution. Informed consent was obtained from all the cases and controls. Demographic data and clinical history were gathered from all the patients by using a standard self – administered questionnaire.
Materials and Methods
Hundred known cases of type II Diabetes mellitus attending Diabetes centre of the Hospital, with clinical and Echo cardio graphic features of cardiac failure were included as cases (Group A) based on the inclusion and exclusion criteria given below:
Inclusion Criteria
Consenting patients
H/o Diabetes mellitus
Age group – 20-60 yrs
Fulfilling Framingham Heart Failure Diagnostic Criteria [7]
Exclusion criteria
Cardiac failure without a history of Diabetes mellitus
Patients with Hemoglobin <11g/dl for females and <12 for males [8–10].
Hundred age and gender matched diabetics with negative history of cardiovascular disease and with normal Echo cardio graphic features were included as controls. Fasting whole blood, Fluoride and EDTA samples were collected from all the cases and controls for performing complete hemogram, fasting blood sugar and HbA1c. Post prandial blood sugar was also conducted for all the cases and controls.
Biochemical parameters which included Fasting and Postprandial blood sugar were performed using fully automated biochemistry analyser, and Glycosylated hemoglobin using immuno turbidimetric method. Complete Blood count including RDW was done using fully automated hematology analyser KX-21. Serum BNP analysis was done using ELISA for all the cases and controls.
Results
Ninety percent of cases and controls were males. [Table/Fig-1] shows the baseline characteristics of cases and controls. The mean duration of diabetes was higher in cases (mean=10.39 years) when compared to controls (6.56 years).
Baseline characteristics of controls and cases
| Age | Year of Diabetes | RDW% | Hemoglobin g/dl | BNP pg/ml |
|---|
| Control | Case | Control | Case | Control | Case | Control | Case | Control | Case |
|---|
| N | 100 | 100 | 100 | 100 | 100 | 100 | 100 | 100 | 100 | 100 |
| Minimum | 24 | 25 | 0 | 0 | 11.2 | 12.3 | 11.3 | 11.3 | 16 | 266 |
| Maximum | 59 | 60 | 25 | 29 | 15.6 | 18.2 | 18 | 18.2 | 98 | 966 |
| Mean | 49.03 | 47.95 | 6.56 | 10.39 | 12.957 | 15.452 | 14.165 | 13.969 | 65.88 | 554.5 |
| SD | 7.083 | 6.492 | 5.757 | 6.388 | 0.9871 | 1.3098 | 1.4471 | 1.6605 | 19.78 | 150.07 |
[Table/Fig-2] shows the results of unpaired t-test between control and cases for RDW% and Hb. A statistically significant difference was observed between cases and controls with RDW while Hemoglobin values did not show any such difference in both the groups.
Unpaired t-test between control and case for the RDW% and Hbg/dl
| Group | n | Mean | SD | Mean Difference | 95% Confidence Interval of the Difference | Unpaired t -test | P-Value |
|---|
| Lower | Upper |
|---|
| RDW | Control | 100 | 12.957 | 0.9871 | - 2.4950 | - 2.8184 | -2.1716 | -15.212 | 0.000 *** |
| Case | 100 | 15.452 | 1.3098 |
| Hb | Control | 100 | 14.165 | 1.4471 | 0.1960 | - 0.2383 | 0.6303 | 0.890 | 0.375 NS |
| Case | 100 | 13.969 | 1.6605 |
*** - There is a Statistical significance difference between Control and Case for RDW at 99.9% (P < 0.001)
NS - No Statistical significance difference between Control and Case for Hb at 95% (P >0.05)
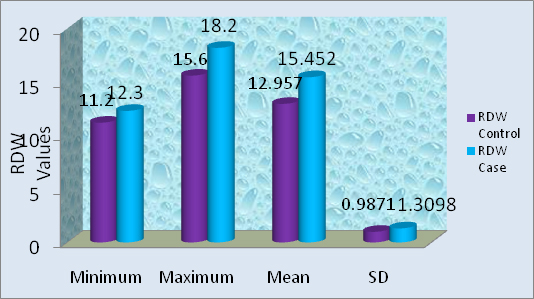
[Table/Fig-3] demonstrates the increase in RDW values (%) in cases in comparison with controls. The minimum and the maximum values show an increase of 1% and 2.6% respectively in cases than in controls.
Comparison of values of RDW% between controls and cases
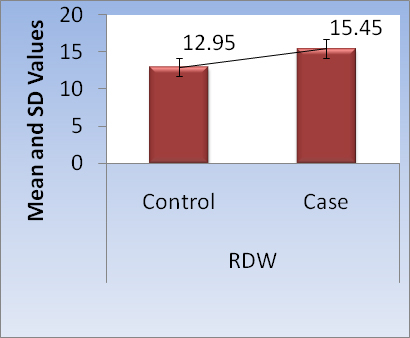
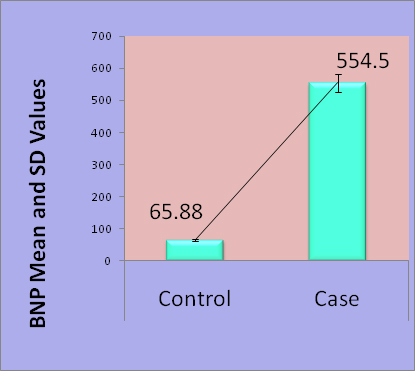
[Table/Fig-4a,b] illustrates the increasing trend of both RDW and BNP values from controls to cases which is highlighted by the trend line.
Comparison of Mean and SD of RDW%
Comparison of Mean of SD of BNP values
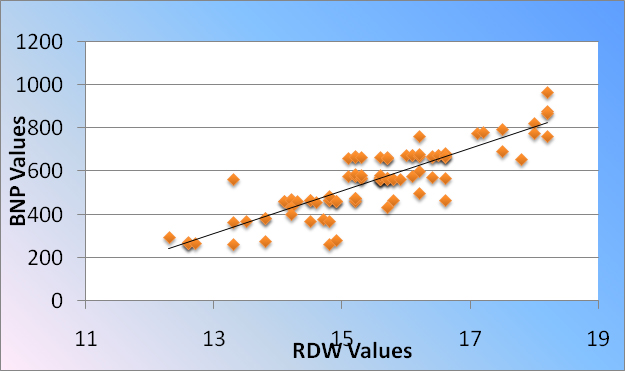
Pearson’s correlation was calculated for RDW, BNP and Hemoglobin values in both controls as well as in cases [Table/Fig-5]. RDW showed statistically significant positive correlation with BNP values in cases with an ‘r’ value of +0.866 and p-value of <0.001. This was further highlighted in the scatter gram [Table/Fig-6] which shows increasing RDW values with increasing BNP values.
Paired sample correlations between RDW%, BNP and Hb values
| PARAMETERS | N | CORRELATION (r)) | Sig. |
|---|
| CONTROLS | RDW & BNP | 100 | -0.121 | 0.232 |
| RDW & Hb | 100 | -0.078 | 0.438 |
| CASES | RDW & BNP | 100 | +0.866 | <0.001*** |
| RDW & Hb | 100 | +0.162 | 0.108 |
*** Statistical significance at P<0.001
Statistical correlation between RDW% and BNP in cases
Discussion
The present study examined the relationship between RDW values and BNP levels in Diabetic patients with cardiac failure. Studies have shown that an increase in RDW could reflect underlying chronic inflammatory pathology [4,5,11] Diabetes is a pro inflammatory state [12–14] and so, per se, could have had an impact on the RDW values. Hence we designed a case control study with diabetics without cardiac failure as controls. We found that RDW values were within normal limits among diabetics without cardiac failure (controls).
Studies previously conducted in healthy adults in our region have clearly indicated that the lower limit of Hemoglobin is found to be low in our population when compared to western standards [8–10] and hence a hemoglobin level of <11g/dl for males and <12 g/dl for females was set as the exclusion criteria in our study. Moreover, based on the above studies [8], we set an RDW of more than 15% to be abnormal.
Our study noted an increase in mean values of RDW% in cases from 12.95% in controls as compared to 15.45% in cases which is shown in [Table/Fig-1-3]. The mean Hemoglobin levels of both the cases as well as controls were comparable [Table/Fig-1,2]. Moreover, statistically significant difference was noted between controls and cases for RDW% with unpaired t-test while Hemoglobin did not show similar difference as shown in [Table/Fig-2]. The mean duration of Diabetes was more with cases than controls which could be due to the fact that there is a direct relationship between the risk of complications of diabetes and glycaemia over time [15].
Paired sample correlations showed a strong positive correlation of RDW % with BNP levels among cases (r=+0.866) which was statistically significant [Table/Fig-5]. Moreover, it did not show a significant correlation with BNP values among controls. This proves that RDW can be used an additional screening parameter for identification of cardiac failure among diabetics.
The scatter gram [Table/Fig-6] highlights positive correlation of RDW with serum BNP levels in cases.
Conclusion
Our study confirmed that there is a statistically significant correlation between RDW % and Serum BNP levels in Diabetics with heart failure. RDW is a parameter that is reported as a part of Complete blood counts. So, understanding its significance would be useful in early identification of cardiac failure among diabetics during their routine follow-up.
*** - There is a Statistical significance difference between Control and Case for RDW at 99.9% (P < 0.001)
NS - No Statistical significance difference between Control and Case for Hb at 95% (P >0.05)
*** Statistical significance at P<0.001
[1]. Bessman J, Gilmer PR Jr, Gardner FH, The improved classification of anemias on the basis of the MCV and the RDWAm J Clin Pathol 1983 80(3):322-26. [Google Scholar]
[2]. Tziakas D, Chalikias G, Grapsa A, Gioka T, Tentes I, Red blood cell distribution width: a strong prognostic marker in cardiovascular disease: is associated with cholesterol content of erythrocyte membraneClin Hemorheol Microcirc 2012 51:243-54. [Google Scholar]
[3]. Felker GM, Allen LA, Pocock SJ, CHARM Investigators. Red cell distribution width as a novel prognostic marker in heart failure: data from the CHARM Program and the Duke DatabankJ Am Coll Cardiol 2007 50:40-47. [Google Scholar]
[4]. Ku NS, Kim HW, Oh HJ, Kim YC, Kim MH, Song JE, Red blood cell distribution width is an independent predictor of mortality in patients with gram-negative bacteremiaShock 2012 38:123-27. [Google Scholar]
[5]. Subhashree AR, Shanthi B, Parameaswari PJ, The red cell distribution width as a sensitive biomarker for assessing the pulmonary function in automobile welders- a Cross-Sectional studyJ Clin Diagn Res 2013 7(1):89-92. [Google Scholar]
[6]. Maisel A, B-type natriuretic peptide levels: diagnostic and therapeutic potentialCardiovasc Toxicol 2001 1(2):159-64. [Google Scholar]
[7]. McKee PA, Castelli WP, McNamara PM, Kannel WB, The natural history of congestive heart failure: the Framingham studyN Engl J Med 1971 285(26):1441-6. [Google Scholar]
[8]. Subhashree AR, Parameaswari PJ, Shanthi B, Revathy C, Parijatham BO, The reference intervals for the haematological parameters in healthy adult population of chennai, southern IndiaJ Clin Diagn Res 2012 6(10):1675-80. [Google Scholar]
[9]. Balasubramaniam U, Pandeya P, Sairam S, Suhasini Sehkar L, Hematological and biochemical values in the Indian populationdefining the reference intervalsAHERF Educational and Research Foundation. [internet] [cited 2014 Jan 20]. Available from: www.aherf.org [Google Scholar]
[10]. Sundaram M, Mohanakrishnan J, Murugavel KG, Shankar EM, Solomon S, Srinivas CN, Ethnic variations in certain hematological and biochemical reference intervals in a south Indian healthy adult populationEur J Intern Med 2008 19(1):46-50. [Google Scholar]
[11]. Lippi G, Targher G, Montagnana M, Salvagno G. L, Zoppini G, Guidi G. C, Relation between red blood cell distribution width and inflammatory biomarkers in a large cohort of unselected outpatientsArch Pathol Lab Med 2009 133(4):628-32. [Google Scholar]
[12]. Pradhan AD, Manson JE, Rifai N, Burin JE, Ridker PM, C-reactive protein, interleukin 6, and risk of developing `type 2 diabetes mellitusJAMA 2001 286(3):327-34. [Google Scholar]
[13]. Tonelli M, Sacks F, Arnold M, Moye L, Davis B, Pfeffer M, For the Cholesterol and Recurrent Events (CARE) Trial Investigators. Relation between red blood cell distribution width and cardiovascular event rate in people with coronary diseaseCirculation 2008 117:163-68. [Google Scholar]
[14]. Schmidt MI, Duncan BB, Sharrett AR, Markers of inflammation and prediction of diabetes mellitus in adults (Atherosclerosis Risk in Communities study): a cohort studyLancet 1999 353:1649-52. [Google Scholar]
[15]. Stratton Irene M, Adler Amanda I, Andrew H, Neil W, Matthews David R, Manley Susan E, Cull Carole A, Association of glycaemia with macrovascular and microvascular complications of type 2 diabetes (UKPDS 35): prospective observational studyBMJ 2000 321(7258):405-12. [Google Scholar]