Depressive disorders rank fourth as causes of disability worldwide and may rank second by the year 2020.
In India, about 10 million people suffer from depressive disorders. The prevalence rate recorded was 31.2 for every 1000 individuals in the year 2001[1].
Although saliva provides an easily available, non-invasive diagnostic medium for a rapidly widening range of diseases, saliva sampling unfortunately, has not yet become a routine laboratory procedure. All psychotropic drugs, even those of the latest generation, present side effects. The present scenario has prompted this study to estimate the changes in the salivary composition in patients on antidepressants and on psychiatric counselling in order to develop cost-effective and simple diagnostic methods.
Sialochemistry thus provides qualitative information on certain important parameters of saliva which are used for diagnostic and research purposes [2–5].
The objective of this study is to compare the qualitative differences of unstimulated saliva between healthy individuals and depressed patients. The latter was further subdivided as those under medication and those who were on psychiatric counselling only.
Materials and Methods
The present study has been conducted in Bhopal, the capital city of Madhya Pradesh, India. The survey period extended from May 2009 to July 2010.
The entire study protocol had been approved by The Ethical Committee of People’s College of Dental Sciences and Research Centre and affiliated to Barkatullah University of Bhopal.
Criteria for Patient Selection
After a detailed explanation about the nature of research, its objectives, methods and the inconvenience this methodology could cause, the research participants signed a free and informed consent form authorizing their voluntary participation in the research.
A total of 150 subjects were chosen for this study which comprised of subjects with clinically diagnosed depressive disorders; i.e. those who were not on medication, those who were on antidepressant drugs {i.e Tricyclic antidepressants (TCAs), Selective serotonin reuptake antidepressants (SSRIs) and Tetracyclic antidepressants (TeCAs)} and Control Group. Each group comprised of 50 normal volunteers, of either gender, above 15 years and below 45 years of age.
The three different study groups selected were as follows:
Study group I
Study group II
Study group III
Subjects who were physically healthy, had no depressive symptoms disorders and were not on any medication for any systemic diseases were selected as Study Group I. While patients with complaints of depressive symptoms, and were either under psychiatric counselling or had been on antidepressant drugs for a minimum of 1 month, comprised Groups II and III respectively. The exclusion criteria included deleterious habits, systemic disorders related to salivary gland physiology, menopause, hysterectomy and radio/chemotherapy in the head and neck region in the last three months.
Clinical Assessment
Self- administered questionnaire was developed to identify the patient data. It included age, sex, diagnosed diseases and presence of any acute illness, regularly prescribed medication or over-the- counter medication.
Assessment of Depression: The patients coming to the outpatient department were first shown to the psychiatrist. The type of depression was assessed by using the DSM-IV (Diagnostic and Statistical Manual of Mental Disorders) SCALE for depression. For patients who were using psychotropic drugs, data about the medication, including duration and dosage were recorded.
Data Collection of Saliva Samples
Equipments and Materials Used: Borosil vials with lid were autoclaved and pretagged with an identification number. The closed vials were used to collect and transport the samples from the hospitals to the laboratories for analysis. Cold sterilized disposable funnels were given to each patient along with the vials to aid in collection. A polystyrene box half- filled with dry ice cubes was used to transport the clinical samples to the biochemistry laboratory for analysis. A deep freezer with provision of maintaining the temperature at -20oc was used to store the samples.
Standardization & Method for collecting clinical data: All samples were taken between the hours of 9:00-11:30 am. Samples were collected from patients by direct draining method. Those candidates who fulfilled the criteria of any of the three groups were selected for this study. The individuals were asked to refrain from eating, drinking (except water), tooth brushing, practice physical exercises or be under great physical stress for at least 1 hour prior to sample collection [6]. The subjects were instructed to wash their mouths, sit in a relaxed position and allow saliva to accumulate in the mouth and then to expectorate through a funnel into a sterile vial usually once every 60 seconds over a period of 10 minutes [1,7]. Samples containing visible blood were discarded. The samples were assembled in the ice box and taken to the biochemistry laboratory where they were processed on the same day or stored at -20oc and analysed within 24 hours after collection.
Biochemical Analyses
Salivary α- amylase activity and calcium was determined with the help of colorimetric method and specific autopak kits (CNP- G3 method; SIEMENS medical solutions diagnostics ltd.). Sodium and potassium concentration in saliva was determined with a photochromometer at 540 nm within ten minutes. Total protein concentration was estimated using the end - point method. Urea in the saliva was determined with autopak kit (UV method or the enzymatic method).
The data so obtained was compiled systematically using the unpaired student’s t- test
Results
The present study was conducted in Bhopal, Madhya Pradesh, India with a view to assess and bring about a comparison of sialochemical alterations in selected important parameters in unstimulated whole saliva.
The following observations were tabulated along with statistical analysis.
Estimation of α-Amylase
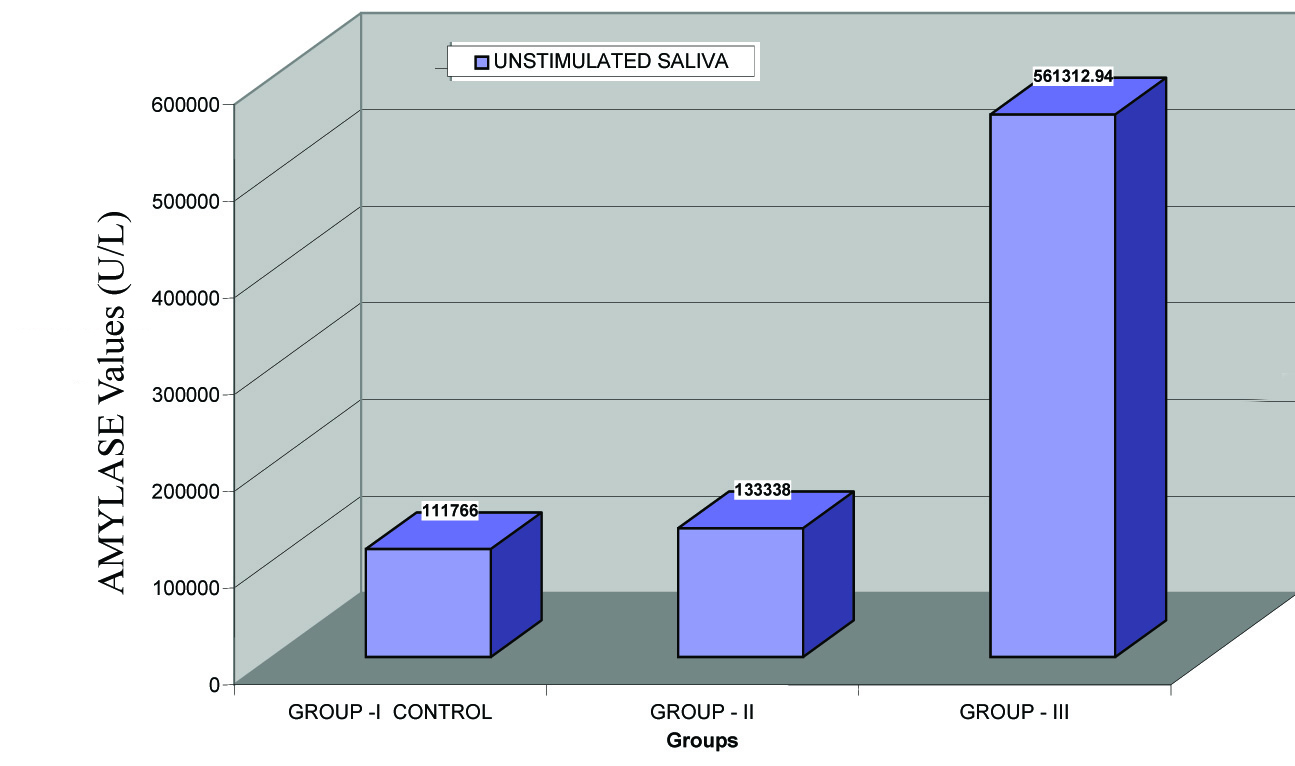
[Table/Fig-1] shows the mean unstimulated salivary amylase levels in Group I (111766 ± 78183.94), Group II (133338 ± 194706.78) and Group III (561312.94 ± 414583.36) patients.
Comparision of unstimulated salivary amylase between group i, group ii and group III
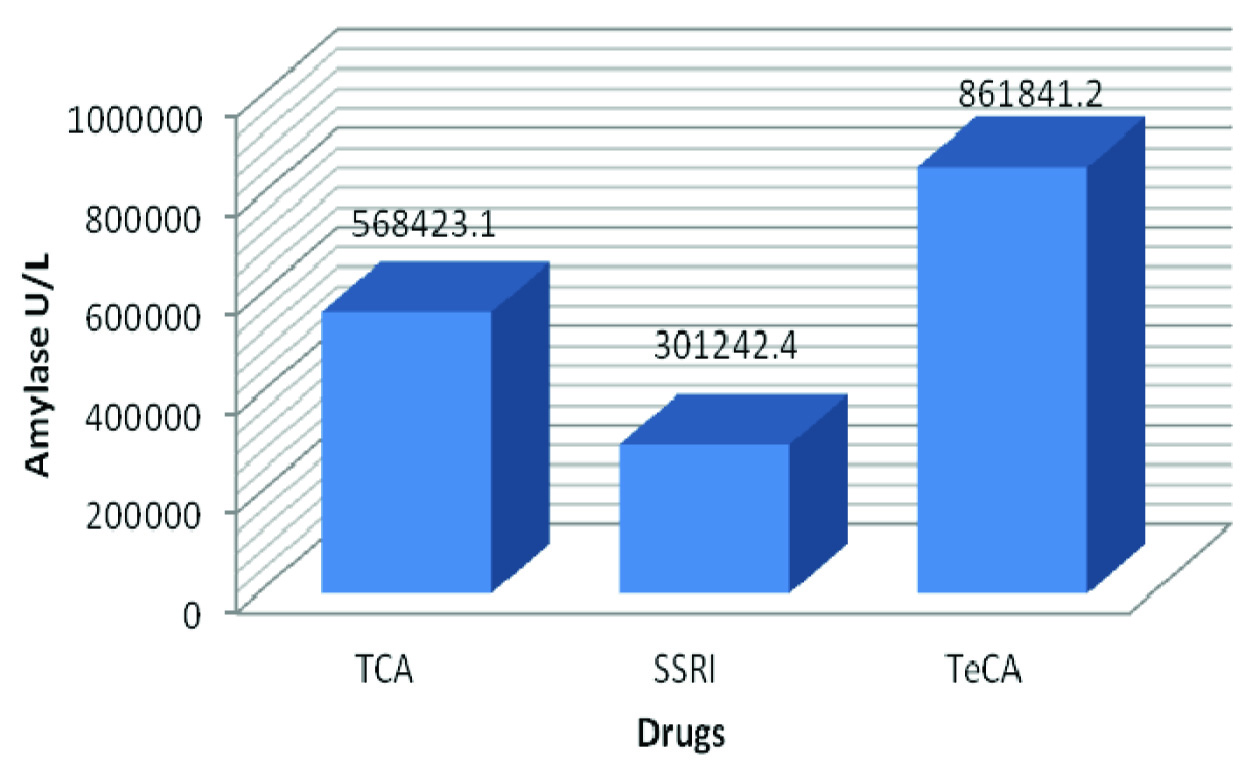
Estimation of α-Amylase between 3 different antidepressant drugs: [Table/Fig-2] shows the variations in unstimulated α-amylase levels among Group III patients. Patients on TeCAs had 861841.2 ± 286353.9 increased when compared to those taking TCAs 568423.1 ± 390621.8 and SSRIs 301242.4 ± 354690.6. The unstimulated results for α- amylase was statistically significant only between patients on SSRIs and TeCAs and between those in TCAs and TeCAs (p< 0.0001, p= 0.0245 respectively). Results between TCAs and SSRIs were not statistically significant (p= 0.0508).
Comparison of unstimulated whole salivary a-amylase levels between three types of antidepressant drugs
Estimation of Calcium
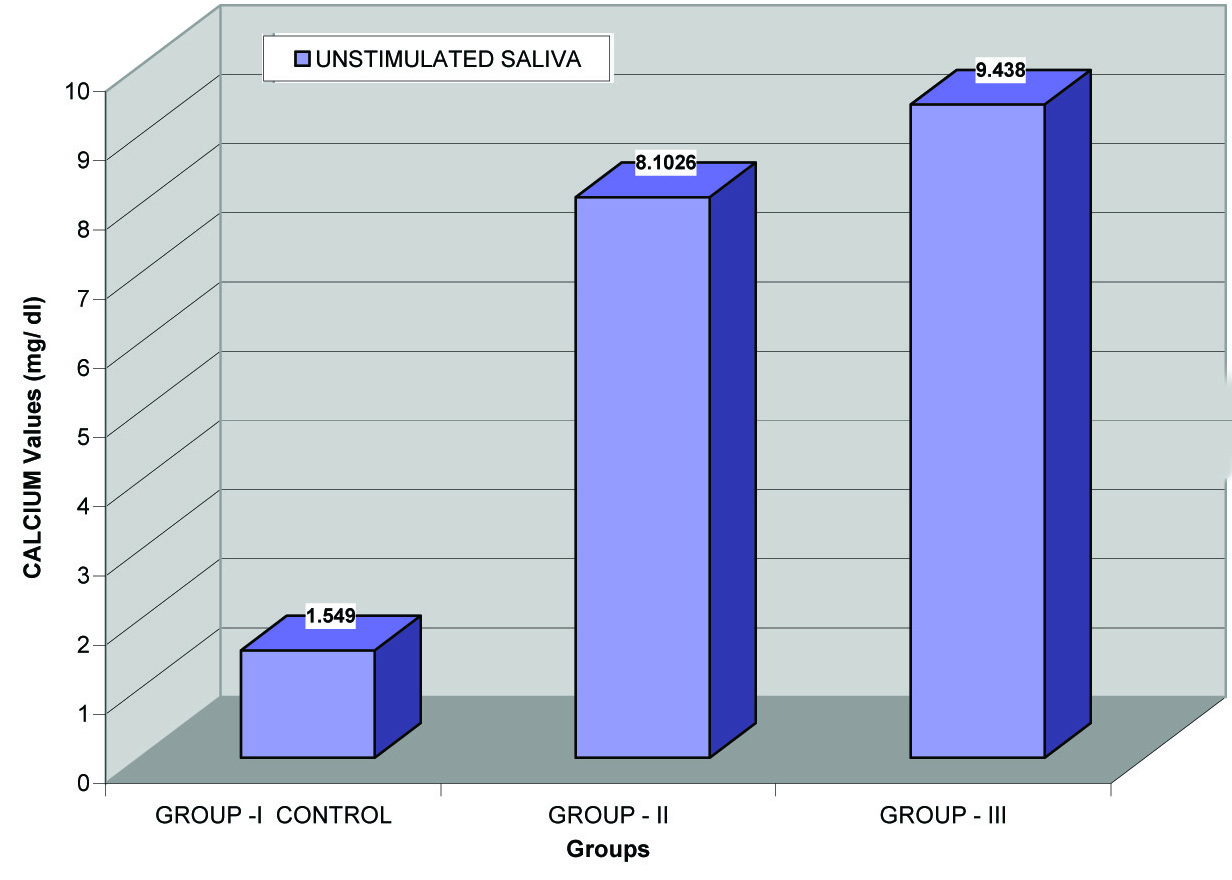
[Table/Fig-3] shows the unstimulated calcium values among all the three groups The unstimulated mean values for salivary calcium in Group III (9.44±2.54) were increased when compared to Group I (1.549± 1.07) and Group II (8.1026± 3.75).
Comparision of unstimulated salivary calcium between group i, group ii and group III
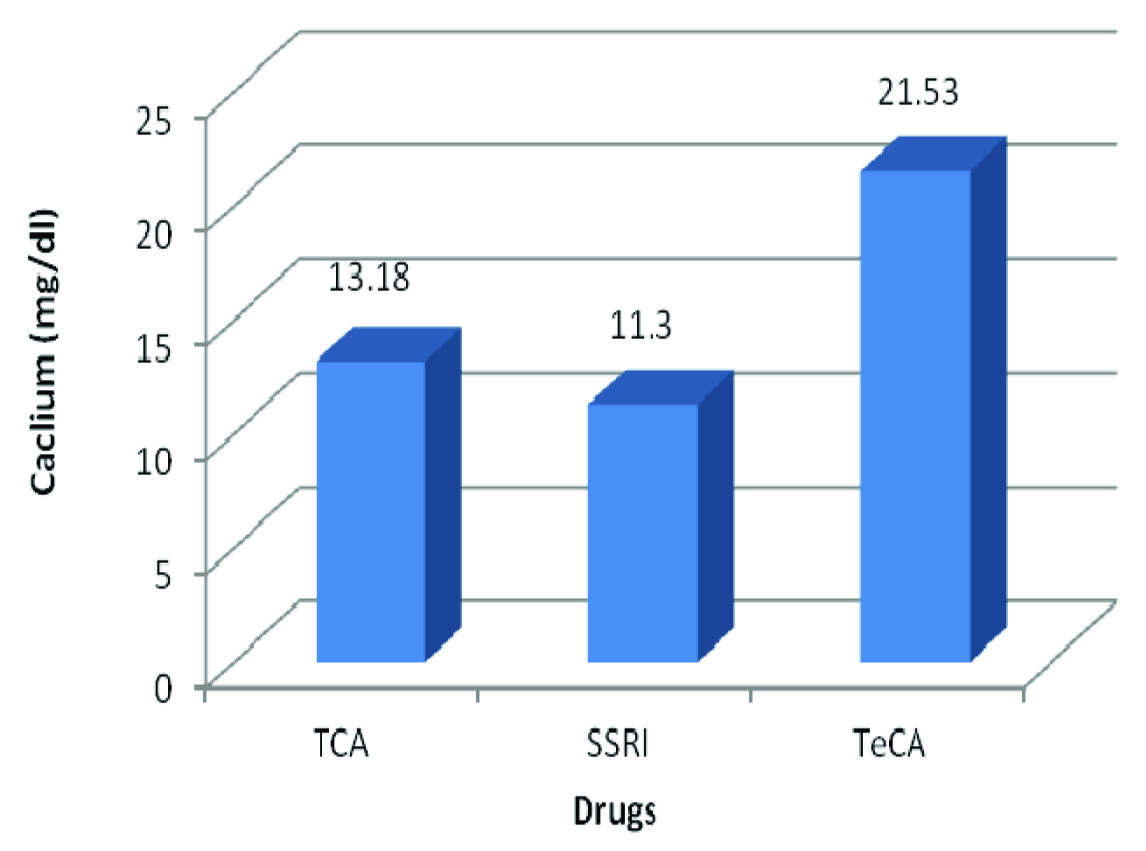
Estimation of Calcium between 3 different antidepressant drugs: [Table/Fig-4] compares the calcium levels in unstimulated saliva.
Comparison of unstimulated whole salivary calcium levels between three types of antidepressant drugs
Estimation of Sodium
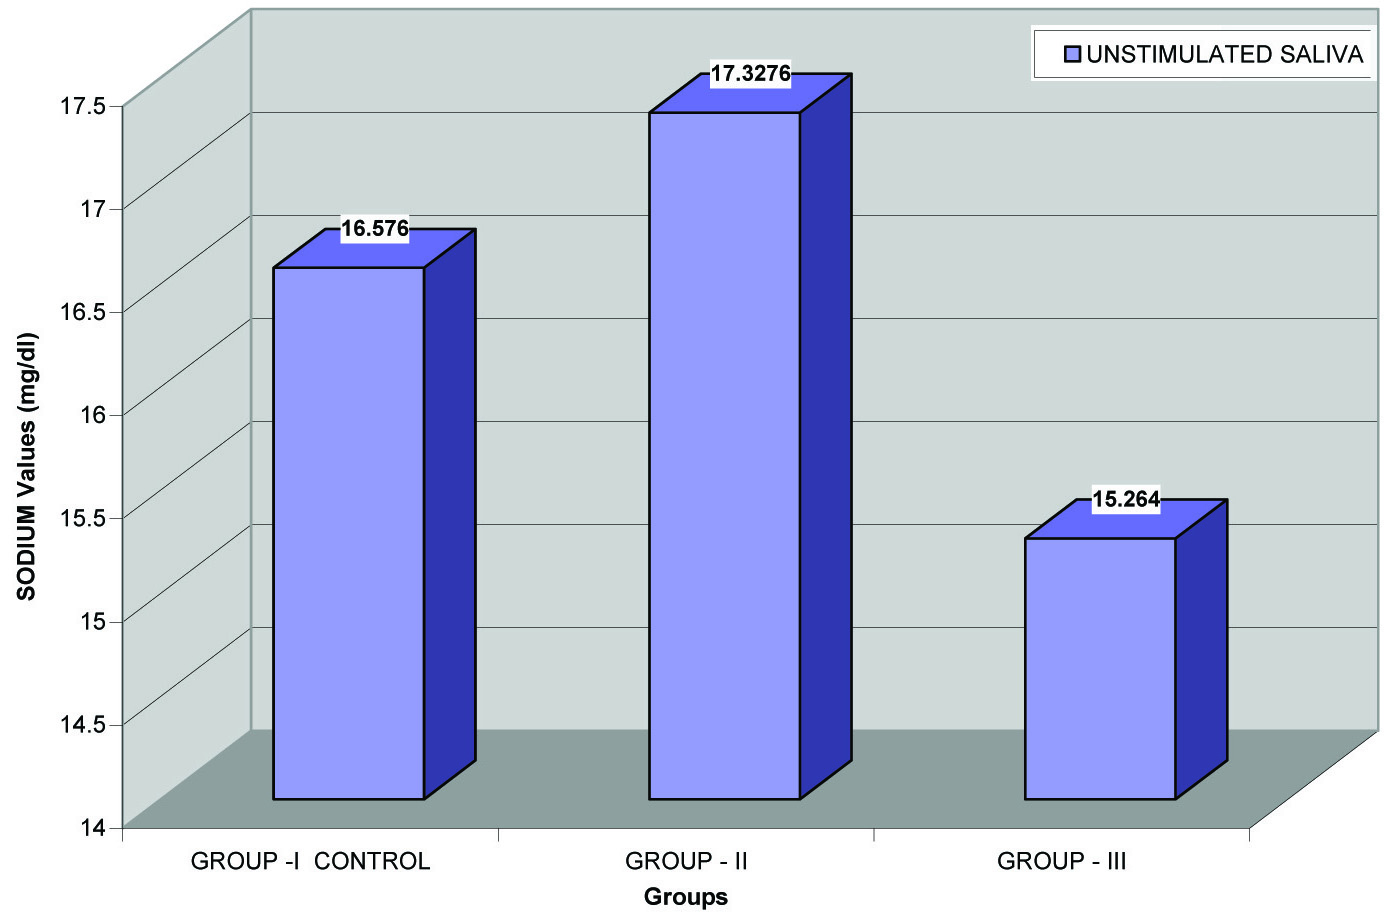
[Table/Fig-5] did not show any statistically significant difference when the unstimulated salivary sodium levels in Group I, Group II and Group III when compared to each other (p= 0.664, p= 0.302 and p= 0.416 respectively).
Comparision of unstimulated sodium between group i, group ii and group III
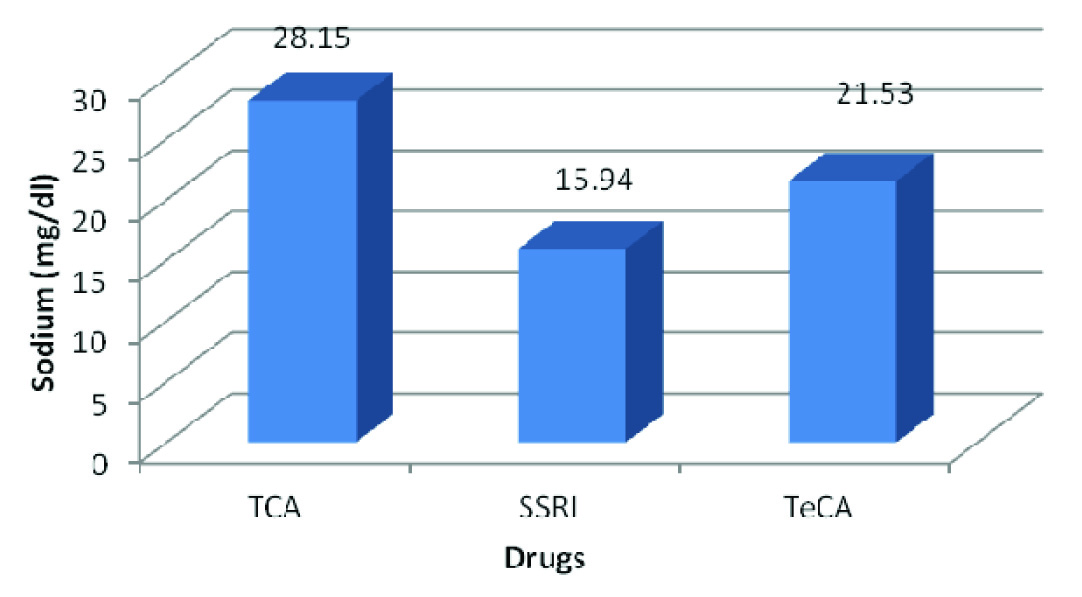
Estimation of Sodium between 3 different antidepressant drugs [Table/Fig-6] shows statistically significant differences in the unstimulated salivary sodium levels between SSRIs and TeCAs and between TCAs and TeCAs (p<0.0001, p= 0.0252 respectively). Conversely, the results between TCAs and SSRIs were not statistically significant (p= 0.613).
Comparison of unstimulated whole salivary sodium levels between three types of antidepressant drugs
Estimation of Potassium
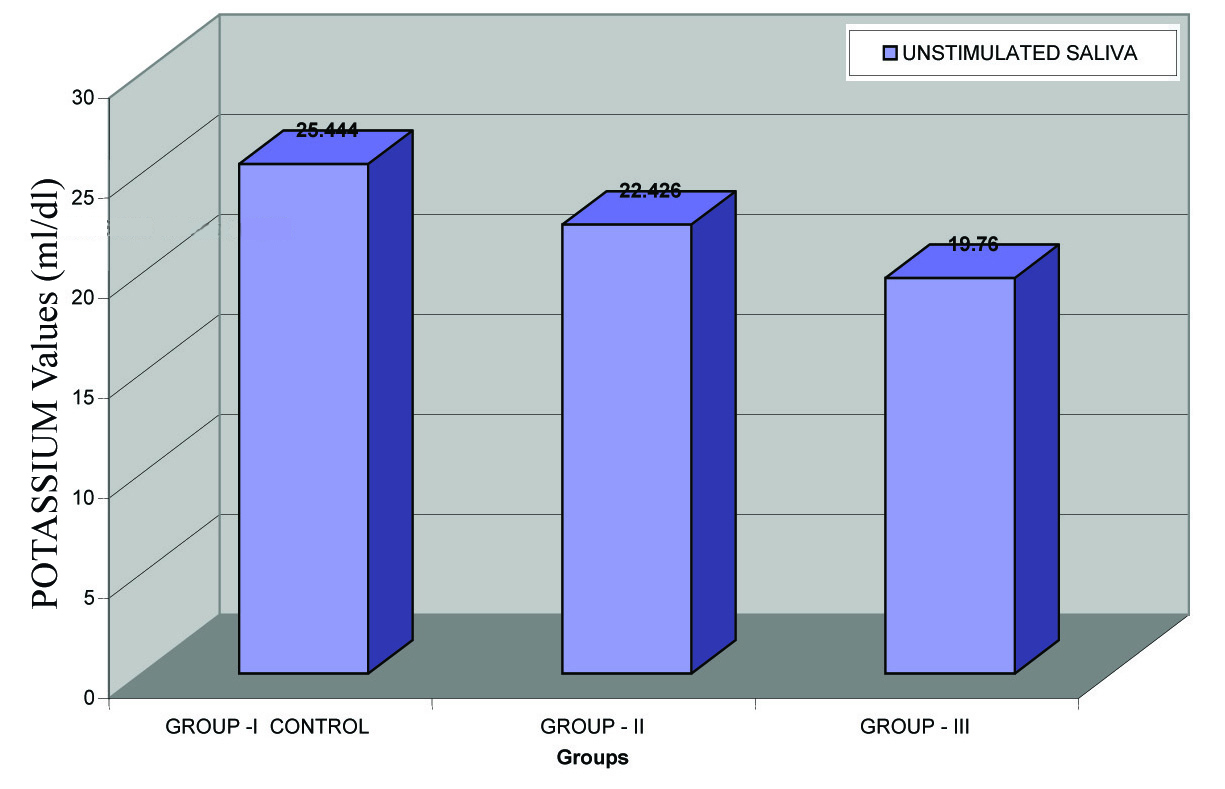
[Table/Fig-7] reveals no statistical significant differences in the unstimulated salivary potassium levels between Group I, Group II and Group III (p= 0.848, p= 0.250 and p= 0.087 respectively).
Comparision of unstimulated salivary potassium between group i, group ii and group III
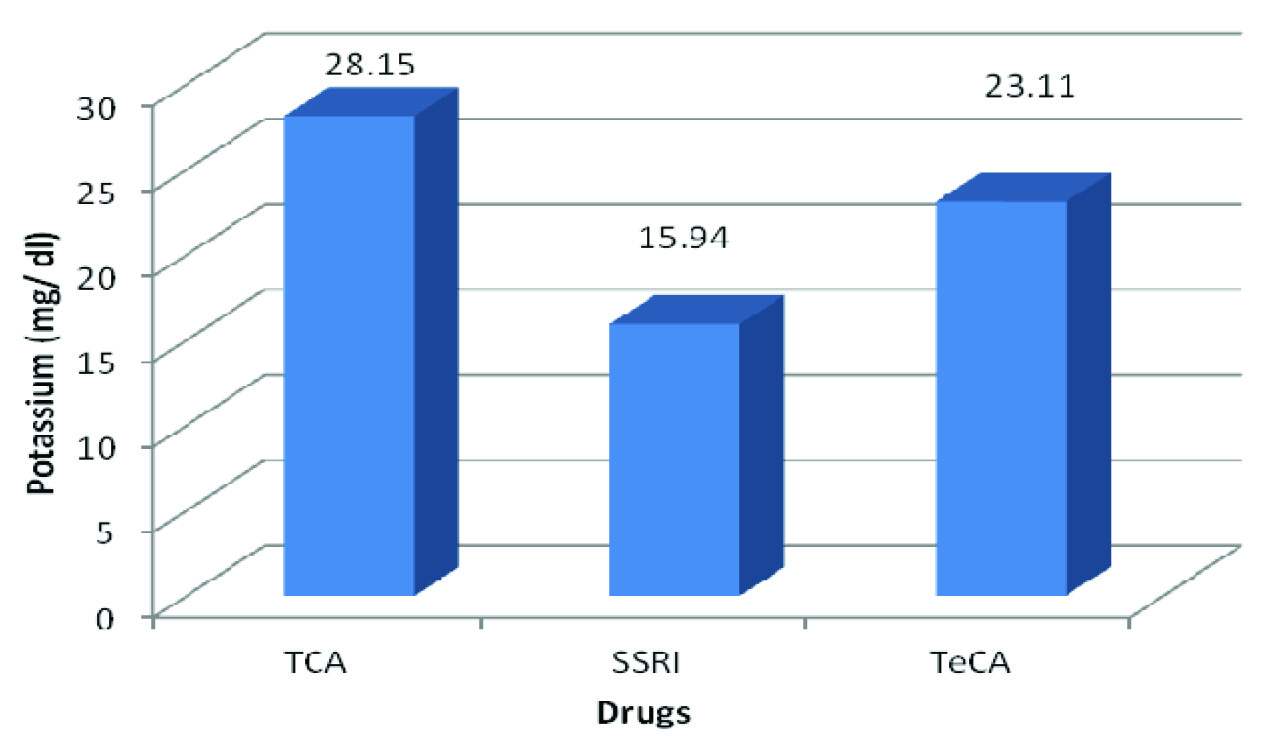
Estimation of Potassium between 3 different antidepressant drugs: [Table/Fig-8] shows statistically significant difference between the unstimulated potassium values of TCAs and SSRIs (p= 0.02) and between SSRIs and TeCAs (p< 0.0001). However, there was no significant change between TCAs and TeCAs (p= 0.376).
Comparison of unstimulated whole salivary pottasium levels between three types of antidepressant drugs
Estimation of Total Proteins
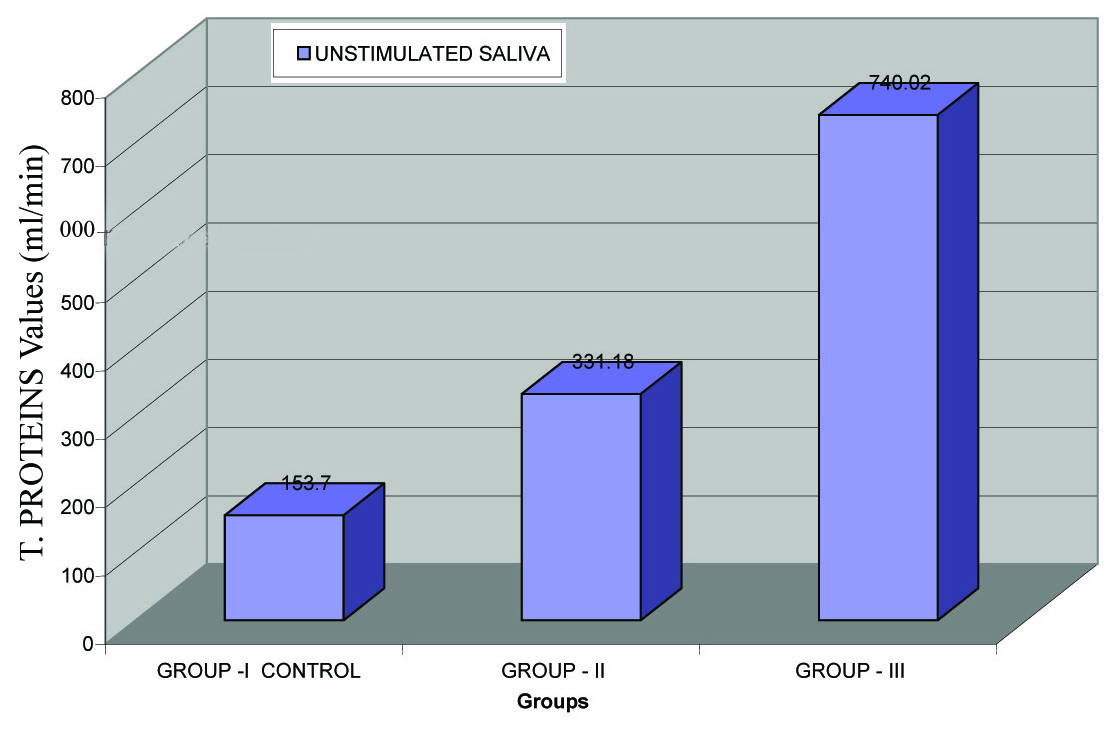
In [Table/Fig-9] the mean values for unstimulated salivary total proteins shows a statistically increase in Group III patients (740.02± 571.5) as compared to Group I (mean= 153.7± 33.5) and Group II (mean= 331.18± 197.8). All the three groups were statistically significant when compared to each other (p< 0.0001).
Comparision of unstimulated salivary total proteins between group i, group ii and group III
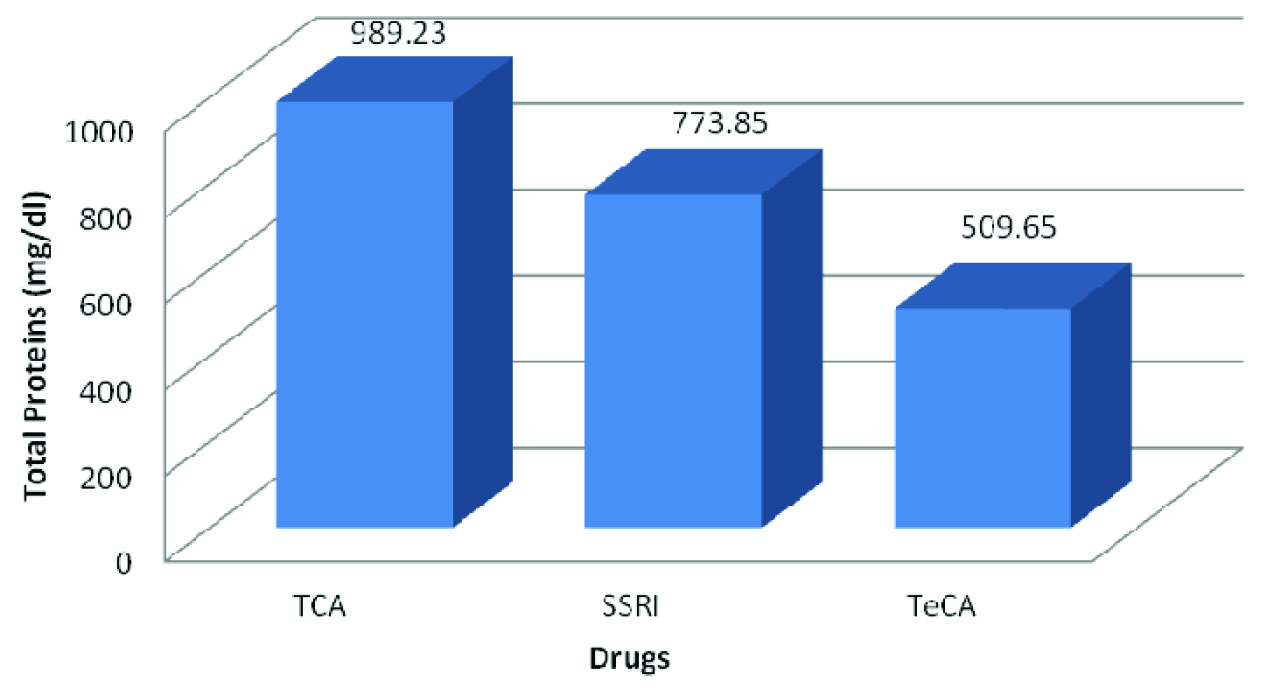
Estimation of Total Proteins between 3 different antidepressant drugs: [Table/Fig-10] shows only the values of unstimulated total protein between TCAs and TeCAs to be statistically significant (p= 0.0207). There was no significant variation between TCAs and SSRIs and between SSRIs and TeCAs (p= 0.362 and p=0.0908) respectively. The mean values for TCAs, SSRIs and TeCAs were 989.23 ±755.42, 773.85± 579.71 and 509.65± 254.87 respectively.
Comparison of unstimulated whole salivary total proteins levels between three types of antidepressant drugs
Estimation of Urea
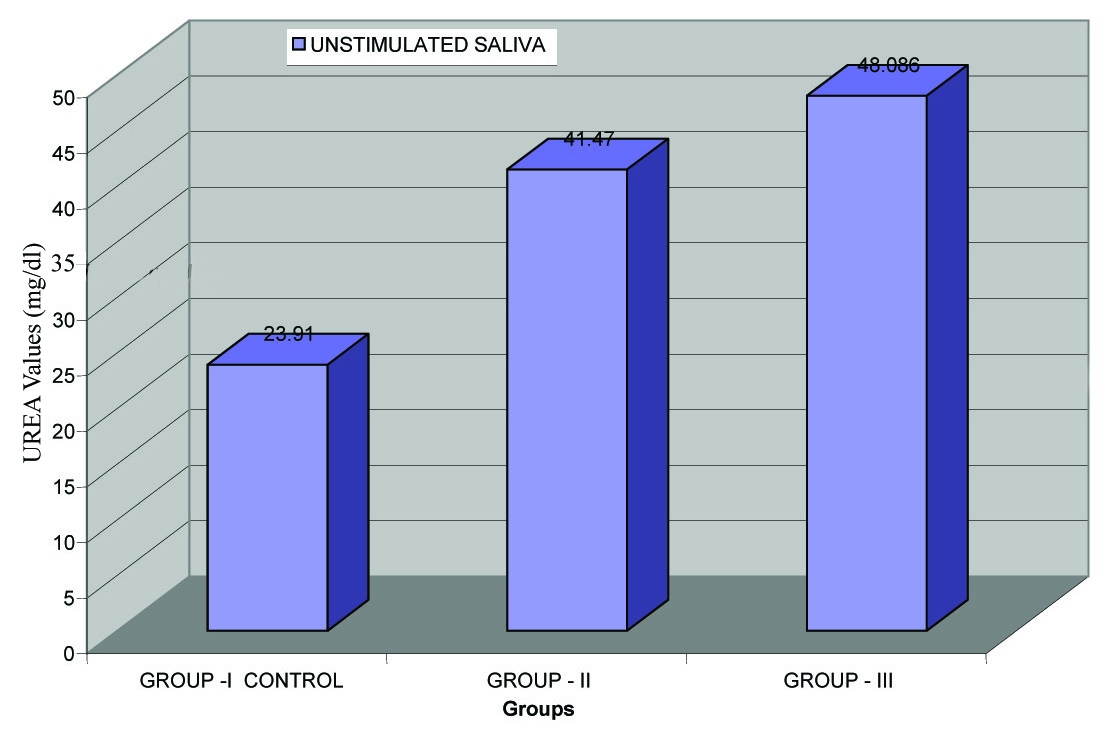
In [Table/Fig-11] the mean values for unstimulated salivary urea are 23.91± 10.48 in Group I, 41.47± 25.72 in Group II and 48.086± 17.43 in Group III. The t- test results between Group I and Group II and between Group I and Group III were found to be statistically significant (p< 0.0001).There was no statistical difference between Group II and Group III (p= 0.1353).
Comparision of unstimulated salivary urea between group i, group ii and group III
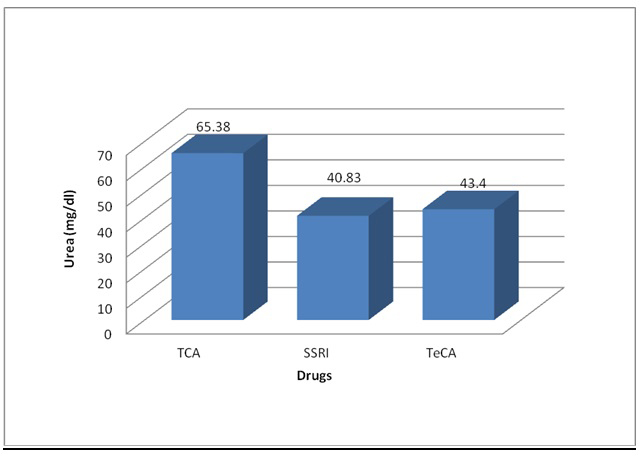
Estimation of Urea between 3 different antidepressant drugs: [Table/Fig-12] estimates the mean unstimulated salivary urea among Group III patients to be 65.38± 25.83 in TCAs, 40.83± 7.59 in SSRIs and 43.4± 5.42 in TeCAs. Between TCAs and SSRIs (p= 0.0003) and between TCAs and TeCAs (p= 0.0019), the differences were statistically significant but there was no statistical alteration between SSRIs and TeCAs (p= 0.2517).
Comparison of unstimulated whole salivary urea levels between three types of antidepressant drugs
Discussion
Sialochemical Analysis
1. α- AMYLASE
Unstimulated salivary α- amylase levels in Group III patients was significantly increased when compared to Group I and Group II.
Among Group III patients, the unstimulated results for α- amylase was significantly increased in patients on TeCAs. However, analysis showed that there was not much change between those taking SSRIs and TCAs.
Comparison of Salivary α-Amylase Among Three Antidepressant Drugs: The above results showed that salivary α- amylase was significantly increased in Group III patients of which tricyclic and tetracyclic groups of antidepressant drugs showed a greater rise in the amylase as compared to those taking selective serotonin reuptake inhibitors.
The present study is analogous with Mörnstad H, von knorring L and Holmgren FS [8,9] who studied the effects of antidepressants on unstimulated saliva. Those on short- term administration of the drugs had no significant change in the amylase levels in both amitriptyline (TCA) and zimelidine (SSRI), while significant increase in the amylase levels were observed in long- term users of maprotiline (TeCA) as compared to zimelidine (SSRI) (p< 0.05).
von Knorring L and Mörnstad H [10] also found that maprotiline (TeCA) (p< 0.01) gave a strong increase in the activity of unstimulated values of salivary amylase as compared to amitriptyline (TCAs) (p< 0.05) and zimelidine (SSRI) (p< 0.001) in the saliva composition.
Chiappelli F [11] stated that α-adrenergic agonists stimulate salivary α–amylase levels without increasing salivary flow. Lawrence HP [12] stated that salivary α-Amylase act as receptor for the adhesion of several species of oral streptococci onto the hydroxyapatite crystals of the tooth and contributes to the formation of dental plaque.
2. CALCIUM
Group III patients had increased calcium levels as compared to Group I and Group II. Amidst Group III patients, the values between SSRIs (mean= 9.8± 3.09) and TeCAs (mean= 10.7± 1.49) was not found to be statistically significant to each other. Patients who were on TCAs (mean=7.2± 0.56) had the lowest calcium levels and those taking TeCAs had the maximum levels.
Comparison of Salivary Calcium Levels Among The Three Antidepressant Drugs In Group III: Results of the present study showed statistically increased unstimulated levels of calcium in Group III patients. The calcium values of patients on TeCAs (in unstimulated saliva) were increased when compared to that of SSRIs.
Unstimulated salivary calcium levels in Group III patients of the present study were concurrent with von Knorring L et al., [13] where there was no significant change in patients on TeCAs (imipramine) (mean= 0.34± 0.03) and SSRIs (zimelidine) (mean= 0.36± 0.03).
Almeida PDV et al., [14] stated that although TCAs modify the salivary component of calcium, no significant changes were observed in patients taking different types of SSRIs (p> 0.05).
Increased calcium levels have been recorded with the use of anticholinergics like antihistaminics and tricyclic antidepressants. Calcium and phosphate neutralize acids that would otherwise compromise tooth mineral integrity.
3. SODIUM
In the present study, there was barely any statistically difference between the mean values of the groups, though a slight decrease in Group III patients was observed when compared to Group I and Group II.
In Group III patients, the mean unstimulated sodium in SSRI was significantly decreased when compared to TeCAs and TCAs.
Comparison of Salivary Sodium Levels Among the Three Antidepressant Drugs: Sodium levels in unstimulated saliva of Group III had the lowest values. Patients taking SSRIs had the lowest levels when compared to TeCAs and TCAs.
von Knorring L et al., [13] found no significant change in the unstimulated salivary sodium levels in patients on TeCAs (imipramine) (mean= 23.6 ± 5.0) and SSRIs (zimelidine) (mean= 32.3 ± 7.3).
However, Mörnstad H et al., [9] found significant increase in the concentration of unstimulated sodium in SSRI (zimelidine) when compared to TeCA (maprotiline) (p< 0.05).
Salivary sodium levels are one of the main contributors to the osmolarity of saliva, which is approximately half that of plasma. As the flow rate of both whole and ductal saliva increases, the concentrations of proteins, sodium, chloride and bicarbonate rises while the levels of phosphate and magnesium falls. Variable sodium concentrations at different flow rates depend on changes during duct passage. Thus there was no significant change in the normal concentration of sodium in unstimulated saliva.
4. POTASSIUM
The unstimulated values of potassium in the present study had no statistically significant change when compared to each other. Group III patients (mean= 17.31± 10.35) showed the least mean salivary potassium levels when compared to Group I (mean= 28.26± 9.09) and Group II (mean= 25.86± 18.96).
Comparison of Unstimulated Salivary Potassium Levels Among The Three Antidepressant Drugs In Group III:
Although Group III showed the least potassium levels, the present study showed statistical difference between the unstimulated potassium values of TCAs (mean= 28.15± 22.42) and SSRIs (mean= 15.94± 1.11) (p= 0.02) and between SSRIs (mean= 15.94± 1.11) and TeCAs (mean= 23.11± 5.29) (p< 0.0001).
However, von Knorring L et al., [13] found no significant change in the unstimulated salivary potassium levels in patients on TeCAs (imipramine) (mean= 23.8 ± 0.9) and SSRIs (zimelidine) (mean= 23.9 ± 0.8).
The major ions (cations sodium, potassium, calcium, chloride and bicarbonate) are the main contributors to the osmolarity of saliva, which is approximately half that of plasma.
5. TOTAL PROTEINS
In the present study unstimulated total protein levels were statistically significant when compared to each other (p< 0.0001). Group III patients (mean= 740.02 ± 571.5) had amplified levels when compared to Group I (mean= 153.7 ± 33.5) and Group II patients (mean= 331.18 ± 197.8).
Amongst the medicated group, patients on TCAs (mean= 989.23± 755.42) had relatively elevated unstimulated salivary total protein levels and the least was found in TeCAs (mean= 509.65± 54.87).
Comparison of Salivary Total Protein Levels Among The Three Antidepressant Drugs In Group III:The present study showed statistically significant increase in the total protein levels of unstimulated saliva of Group III patients. Patients taking TCAs had increased unstimulated total protein levels.
The present study was consistent with the findings of von Knorring L et al., [10,13].
The reason for increased total protein levels was because, of the interference to the buffering capacity leading to precipitation of total proteins in the saliva. TCAs and TeCAs both are inhibitors of noradrenaline reuptake. It is believed that both the drugs stimulate the alpha- and beta- receptors in the salivary glands and subsequently cause an increase in the concentration of proteins [8].
6. UREA
Unstimulated salivary urea in this study had statistically significant changes between Group I and II and between Groups I and III (p< 0.0001). Salivary urea levels were elevated for Group III patients (mean= 48.09± 17.43) when compared to Group I (mean= 23.91± 10.49) and Group II (mean= 41.47±25.72). The levels of urea in patients with depressive disorders (Group II and Group III) were almost double that of control.
Among Group III patients, the unstimulated salivary urea level was significantly increased between patients on TCAs and SSRIs (p= 0.0019) and between patients on TCAs and TeCAs (p= 0.0003). Patients on TCAs (mean= 65.38± 25.83) had increased urea levels followed by TeCAs (mean= 43.4 ± 5.42) and the least in SSRIs (mean= 40.83 ± 7.59).
Comparison of The Unstimulated Salivary Urea Levels among the Three Antidepressant Drugs In Group III: Weighing the results of unstimulated whole saliva, patients with depressive disorders who were either on medication or on counselling, held a higher concentration of urea with values inclining more towards those in Group III. Tricyclic antidepressants produced augmented whole salivary urea levels in unstimulated cases.
Almeida PDV et al., [14] stated that although TCAs modify the salivary component of urea, no significant changes were observed in patients taking different types of SSRIs (p> 0.05).
Literature have stated that plaque cariogenicity may be inversely related to salivary urea concentrations [15].
Dawes C [16] stated that urea is a substrate for base formation by dental plaque. The level of urea in saliva is directly proportional to the level in blood. A slight increase in salivary urea concentration might reduce the development of caries.
Although salivary urea is an important biochemical parameter for the control of caries, limited literature is available with regard to this component.
Conclusion
The present study was an attempt to assess and bring about a comparison of sialochemical alterations in unstimulated saliva between normal (Group I) and subjects with depressive disorders i.e. Group II and Group III. The effect of three antidepressive drugs {namely Tricyclic antidepressants (TCAs), Selective serotonin reuptake inhibitors (SSRIs) and Tetracyclic antidepressants (TeCAs)}, which were commonly prescribed by the psychiatrists, were considered for the study.
Salivary qualitative alterations in their levels were assessed among the three groups. The results were compared and correlated. The present study depicted the following outcome:
A significant increase in the level salivary amylase, calcium, total protein and urea were observed in Group III patients- especially in those administering Tricyclic (TCAs) and Tetracyclic (TeCAs) antidepressants.
Salivary electrolytes like sodium and potassium did not show much change.
To conclude, antidepressant drugs do affect the salivary composition. These discrepancies could be due to pharmacokinetic and pharmacodynamic implication, the study group selected and the bioavailability of drugs. From the present study, it was observed that cyclic antidepressants produced significant alteration in the sialochemical constituents of saliva. The action of SSRIs was selective and did not cause as much variation in the saliva composition as compared to TCAs and TeCAs.
A follow up study might be suggested to throw light on the fate of saliva after the patient has been relieved from treatment and also if the affect of these drugs, on saliva, transient or has it caused irreversible damage.