Carcinoma is the most common malignancy seen in breast and a woman who lives upto age of 90 has a one in eight chance of developing breast carcinoma [1]. In breast carcinoma, assessment of response to neoadjuvant chemotherapy correlates with survival. Also, a complete pathologic response is reported to significantly improve disease free survival [2–6]. The clinical response is categorized as complete response, partial response, no response and progressive disease, based on change in tumour size. A complete response significantly improves disease free and overall survival. The smaller the primary tumour size, the more likely it is to achieve a complete pathologic response. In case of a partial response and no response, the prognosis is found to be variable [7–11]. Further, the refinement of response assessment would be informative for this group of patients.Tumour cellularity changes which occur after therapy and change in tumour cellularity which is seen after therapy can be significant prognostic factors, as studies have shown in some other malignancies such as osteogenic sarcomas [12]. It has been proven that percentage necrosis with corresponding decreased cellularity, was a significant prognostic factor in osteogenic sarcomas. Hence, the present study was carried out to study change in tumour cellularity in breast carcinoma after giving neoadjuvant chemotherapy and its variation in extent of change in different clinical response groups. This study has included the impact of tumour cellularity assessment on the change in tumour size after giving neoadjuvant chemotherapy.
Materials and Methods
The clinical and pathological parameters from 37 patients with locally advanced breast carcinomas, who were seen in the Surgery Department of our institute, during the period from December 2008 to May 2009, were evaluated retrospectively after taking proper consents from the patients and after the institutional ethical committee’s clearance was obtained. The inclusion criterion was defined as patients with locally advanced breast adenocarcinoma, who were diagnosed by doing core needle biopsies and who had been on neoadjuvant chemotherapy, followed by mastectomy. Patients with breast adenocarcinomas, who had not undergone mastectomies, were excluded from the study. We collected the demographic details of all patients, along with clinical stages of all the locally advanced breast carcinomas. Tumour size was assessed by computerized tomography imaging before and after neo-adjuvant chemotherapy. Core needle biopsies were assessed for tumour cellularity. The histopathology mastectomy specimens of the same patients were studied for cellularity after they took neo-adjuvant chemotherapy.
Patient Population
The patient population comprised of 37 patients with invasive breast carcinoma. Twenty-four of the treated patients had received neoadjuvant chemotherapy which consisted of 3 cycles of Cyclophosphamide (500 mg/m2), Adriamycin (50 mg/m2) and 5-Fluorouracil (500 mg/m2) and 13 of the treated patients had received 3 cycles of Paclitaxel (175 mg/m2) and Adriamycin (50 mg/m2).
Procedure of Study
Demographic data of 37 patients with locally advanced breast carcinoma were collected from case records. Clinical staging and tumour size, as were seen on clinical examination and radiological measurements were also gathered from the case records. The tumour cellularity was assessed in core needle biopsy specimens before giving neoadjuvant chemotherapy, by observing H & E stained sections of paraffin embedded tissues and percentage cellularity was recorded in 37 patients. The cellularity of tumour sections of mastectomy specimens, which was seen after giving neoadjuvant chemotherapy, was assessed by percentage cellularity calculation, which has been outlined below. The change in size and cellularity were correlated with different treatment response groups. The tumour size was then correlated with tumour cellularity.
Calculation of Cellularity
Cellularity was measured by the following method: Haematoxylin and Eosin stained histological sections from both core needle biopsies and subsequent resection specimens, were studied. Percentage of area which was occupied by invasive tumour cells was calculated per sq.mm area in a 40X high power field, in core needle biopsy specimens. In resection specimens, section of the tumour cross sectional area was calculated in mm by checking the calibrations on the light microscope which was used to study the specimens (Nikon Y-THR 0132083). Percentage of area which was occupied by invasive tumour cells per sq. mm was calculated by two independent observers and their findings were correlated. The calculation was done after 100% correlation by training. Cellularity was recorded in increments of 10%, from 10% to 100%, with additional values of 1% and 5% for minimal cellularity. The proportion of invasive carcinoma was then calculated.
Clinical Response Categories
The assessment of the clinical response was based on the change in tumour size, which was obtained from pretreatment clinical and radiological measurements. The clinical measurement was the product of the two greatest palpable perpendicular dimensions of the tumour.
Clinical response was categorized into four groups:
a complete response (CR) was defined as complete resolution of all tumour, as was determined by physical examination and imaging studies;
a partial response (PR) was defined as an incomplete reduction of >50% in tumour size;
a no response (NR) was defined as a reduction in tumour size of <50% and
progressive disease (PD) was defined as an increase in tumour size
Ethics
Informed consents were obtained from all the participants of the study. Written consent forms were given to the patients who were being followed up at the tumour clinic of our hospital. Also, the study was undertaken in accordance with the Declaration of Helsinki and it was approved by the institutional ethics committee. The methods which were employed were found to be satisfactory.
Statistical Analysis
Statistical analysis was performed on individual parameters from pre and post – therapy specimens by using SPSS software (version 13.0).Tumour size, tumour cellularity and the product of size and cellularity were compared between the two sets of specimens by using the paired t-test. The relative change in tumour cellularity was computed as: relative change in tumour cellularity = (percentage tumour cellularity at resection - percentage tumour cellularity in the core needle biopsy) / percentage tumour cellularity in core needle biopsy. Negative values indicated a lower cellularity at resection as compared to that in the core needle biopsy specimens. Distribution of cellularity percentages among the treatment groups was summarized graphically by using box plots.
Results
Out of the total 70 cases which were studied, due to insufficient clinical data and non-representative biopsies, only 37 cases were considered for analysis.
Demographic details of the 37 patients who were included in the study have been summarized in [Table/Fig-1]. The median age of the treatment group was 52.5 years, with a lowest age of 33 years and a highest age of 72 years.The number of patients in different treatment response groups showed response ranges such as: complete response n=7, partial response n=16, no response n=6 and progressive disease n=8. The tumour stage in the group included T3 and T4 of the AJCC-TNM staging system.
Demographic data of 37 patients in the treatment group of locally advanced breast cancer
| Characteristics | Caf Regimen (n = 20) | PA Regimen (n = 17) | Overall (n = 37) |
|---|
| Median Age (Years) | 55 | 50 | 52.5 |
| Tumour Stage | No. of patients (%) |
| T3N0 | 1(5%) | 2(11.7%) | 3(8.1%) |
| T3N1 | 12(60%) | 11(64.7%) | 23(62.1%) |
| T4N1 | 6(30%) | 5(29%) | 11(29.7%0 |
| T4N2 | 0 | 1(5.8%) | 1(2.7%) |
| Pathology |
| Invasive Ductal | 20(100%) | 15(88.2%) | 35(94.5%) |
| Invasive Lobular | 0 | 1(5.8%) | 1(2.7%) |
| Others | 0 | 1(5.8%) | 1(2.7%) |
| Sbr Grade |
| I | 6(30%) | 4(23.5%) | 10(27%) |
| 2 | 13(65%) | 9(52.9%) | 22(29.4%) |
| 3 | 1(5%) | 1(5.8%) | 2(5.4%) |
| Clinical Response |
| Complete (CR) | 3(15%) | 4(23.5%) | 7(18.9%) |
| Partial (PR) | 11(55%) | 5(29.4%) | 16(43.2%) |
| No Response (NR) | 2(10%) | 4(23.5%) | 6(16.2%) |
| Progressive Disease (PD) | 4(20%) | 4(23.5%) | 8(21.6%) |
SBR:-Scarff-Bloom Richardson grade CAF:- Cyclophosphamide, Adriamycin, 5-fluoro uracil regimen PA:-Paclitaxel, Adriamycin regimen
In [Table/Fig-2], the range of tumour cellularity seen in core needle biopsies has been compared with that seen in resected specimens. This table also shows the range of tumour size in the treatment groups with locally advanced breast carcinoma.
Statistics of tumour cellularity (%) and tumour size in histopathologic specimens of the patient group
| Treatment Group (CAF and PA Group) | Cellularity (%) | Change In Tumour Size (CMS) |
|---|
| Resected Specimens | Core Biopsy |
|---|
| (n = 37 patients) | 33.8 | 40 | 0.80 |
| MEDIAN | 72.9 | 84.4 | 12(-2 – 10) |
| RANGE (MINIMUM, MAXIMUM) | (1 – 72.9) | (1 – 85.5) | 1.9± 2.5 |
| MEAN ± SD | 34.7 ± 17.4 | 38.2 + 19.9 | |
SD:-Standard deviation
[Table/Fig-3] lists the categorization of (1) change in tumour cellularity and (2) the product of tumour size and tumour cellularity in clinical response groups and residual tumour stage. The number of patients in the clinical response categories and tumour stage have also been included in this table. Pathological CRs were excluded from the study due to unavailability of tumour sections from resections which followed mastectomies. Number of patients in the T3 stage was 20 and the number of patients in the T4 stage was 17.
Categorization of the change in tumour cellularity, tumour size (cm), and tumour size multiplied by cellularity according to clinical response and residual tumour stage
| No. | Change in tumour cellularity | Tumour Size (cm) | Tumour size x cellularity |
|---|
| Median | Range | Mean ± SD | Median | Mean ± SD | Median | Range | Mean ± SD |
|---|
| CR | 7 | -.25 | 6.24 (-.58,5.66) | .66 ± 2.22 | 4.9 | 5.5 ± 2.1 | 1.09 | 39.7(-34,5.7) | -3.7 ± 13.5 |
| PR | 16 | .12 | 6.47(-.92,5.56) | .41 ± 1.49 | 1.3 | 1.88 ± 1.7 | -0.08 | 15.2(-11.1,4) | -.74 ± 3.2 |
| NR | 6 | .39 | 2(-.92,1.12) | .26 ± .8 | -.05 | -.03 ± .18 | 0 | .39(-.3,.09) | -.03 ± .14 |
| PD | 8 | .15 | 2.8(-.6,2.28) | .41 ± .95 | -.55 | -.7 ± .83 | 0.12 | 3.3(-.79,2.5) | .12 ± .97 |
| Tumour Stage* |
| T3 | 20 | .33 | 6.6(-.92,5.6) | .68 ± 1.7 | -.65 | -.96 ± 1.84 | 0 | 36.4(-33.9,2.5) | -1.9 ± 7.2 |
| T4 | 17 | -.11 | 2(-.92,1.12) | .01 ± .49 | -1.3 | -2.4 ± 2.63 | 0.01 | 7.2(-3.2,4) | .34 ± 1.7 |
In the T3 group, the change in cellularity was found to be on the positive side after giving neoadjuvant chemotherapy and in the T4 group, the change in cellularity was found to be on the negative side after giving neoadjuvant chemotherapy. But the change in tumour size was on the negative side in both groups. The product of tumour size and cellularity was on the positive side, which reflected that the treatment response was better in T3 than in T4.
All the CR group patients had reductions in cellularity on the negative side. PR, NR, PD groups showed changes in cellularity on the positive side. Change in tumour size was greater in CR as compared to that in PR, while in NR and PD, change in tumour size was on the negative side. The product of tumour size and cellularity was greater in CR group as compared to those seen in PR, NR and PD.Relative changes in cellularity were highly variable in all four clinical response groups, particularly for patients who had achieved a PR and an NR. In the complete response group (n=7), the change in cellularity was on the negative side. In all other groups, this was on the positive side. In the partial response group (n=16), 3 cases showed an increased change in cellularity, with a reduction in tumour size. However, the product of tumour size and change in cellularity was on the positive side, which suggested that these patients who were in PR could be reclassified under NR. Cellularity is a better measure of assessment than tumour size alone, which is reflected better by the product of tumour size and change in cellularity. In the same group (PR), one case showed 10% cellularity on core needle biopsy v/s 60% cellularity after resection. This discrepancy was caused by inadequate malignant cells which were obtained from core needle biopsies, which was a sampling problem which underestimated the percentage cellularity calculation. The size remained the same due to areas of hyalinization, rather than cellularity. Hence, the actual decrease in cellularity was a better parameter for assessment than tumour size. In the no response group (n=6), two cases showed no differences in tumour sizes. However, cellularity was markedly decreased, which represented possibility of a better response to neo-adjuvant chemotherapy, which was not represented by a mere change in size.
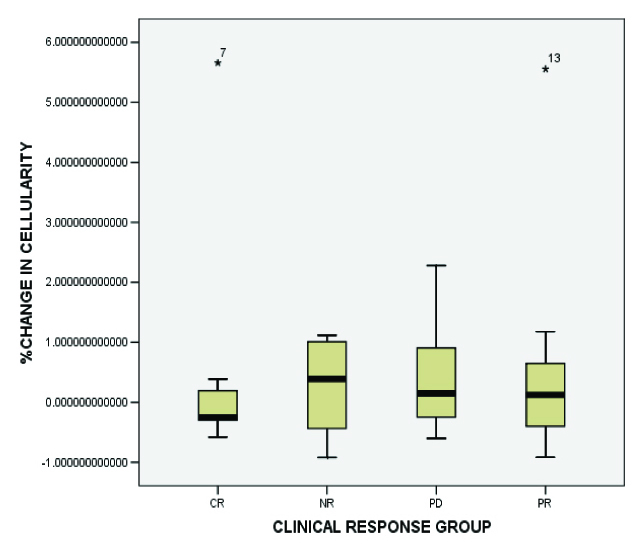
As has been depicted in [Table/Fig-4], which is a box plot, a variable, the change in cellularity is more variable in PR, NR and PD groups as compared to CR. This indicates that core needle biopsy specimens could underestimate the overall cellularity seen in resections.
The relative change in tumour cellularity for each clinical response category: complete response (CR), partial response (PR), no response (NR), progressive disease (PD). Relative change in tumour cellularity was calculated as follows: (percentage tumour cellularity at resection- percentage tumour cellularity in core needle biopsy)/percentage tumour cellularity in core needle biopsy. The colored rectangle indicates the 25th and 75th percentiles of the distribution; the median is indicated by the white horizontal line within the rectangle From the box plot, a variable, the change in cellularity is more variable in PR, NR and PD groups as compared to CR. This indicates that core needle biopsy specimens may underestimate the overall cellularity in the resection
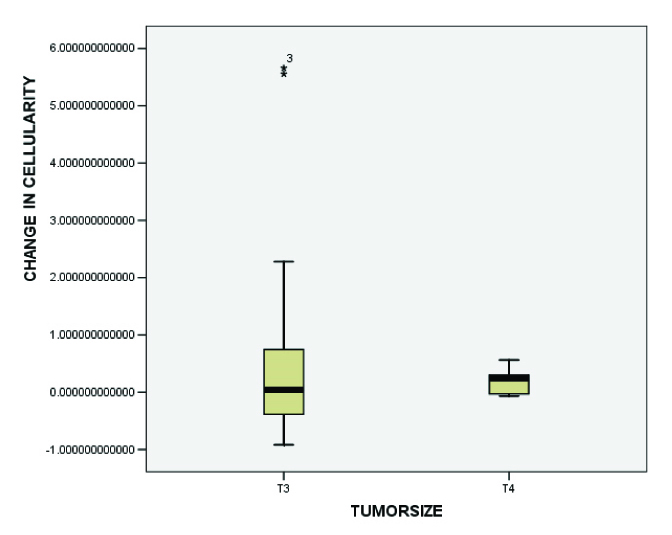
In [Table/Fig-5], it can be observed that change in cellularity was more variable in the T3 group as compared to that in T4, which indicated that core needle biopsy specimens could underestimate the overall cellularity seen in the resections.
Relative changes in cellularity categorized by tumour stage show that T3 residual tumours demonstrate the greatest change in cellularity. However, changes in cellularity were found to be highly variable in T3 residual tumours. Tumour size was categorized using the revised American Joint Committee on Cancer TNM staging system.[13] This box plot format is the same as that used in [Table-Fig-1] From the figure a variable change in cellularity which is more variable in the T3 group as compared to T4 indicate that core needle biopsy specimens may underestimate the overall cellularity in the resection
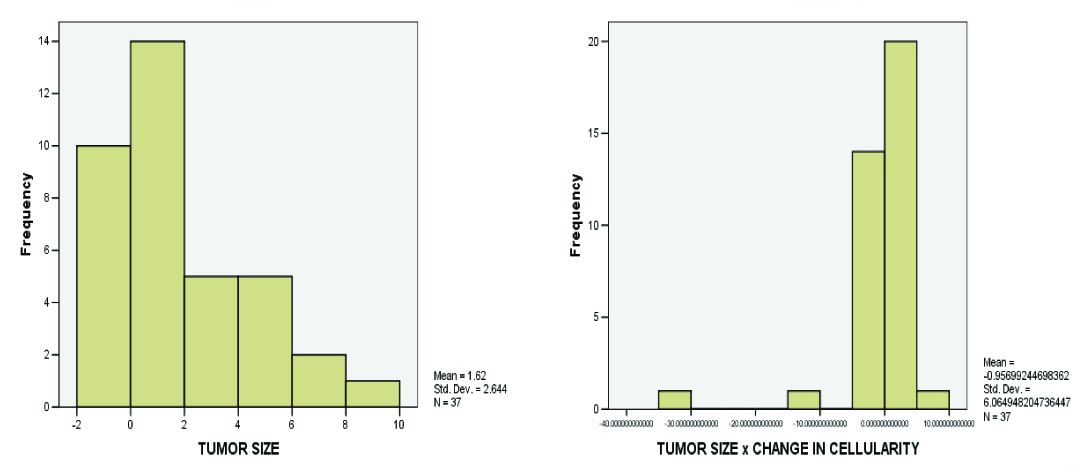
In [Table/Fig-6], it can be observed that the shape of the distribution showed an inverse sloping curve, when the product of tumour size and cellularity was considered.
Histograms of tumour size and product of tumour size and change in cellularity showing a change in the shape of distribution in the clinical response groups. The shape of the distribution shows an inverse sloping curve when the product of tumour size and cellularity is considered
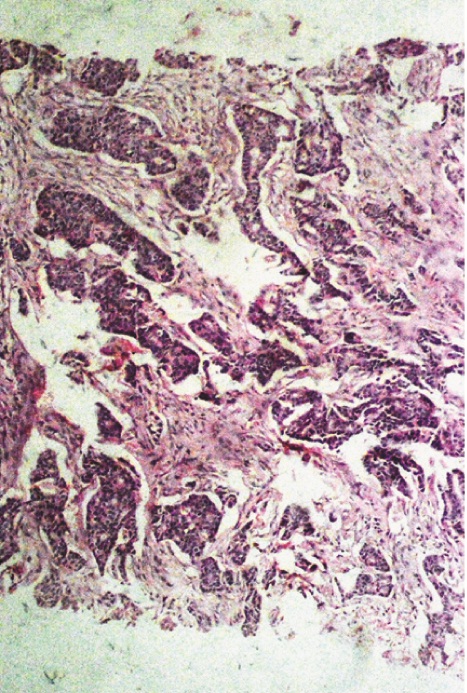
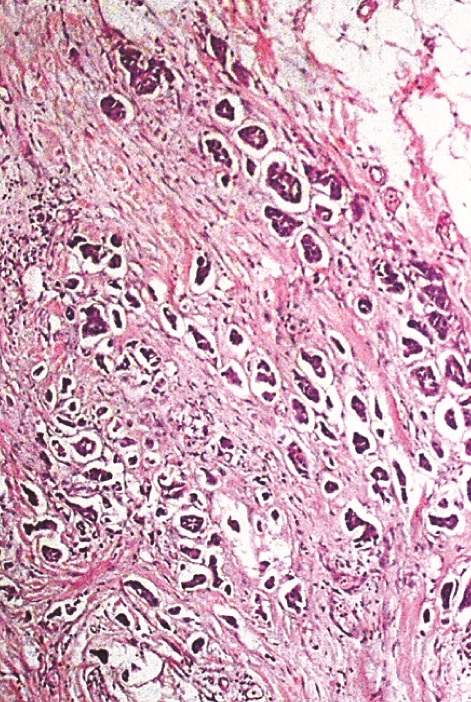
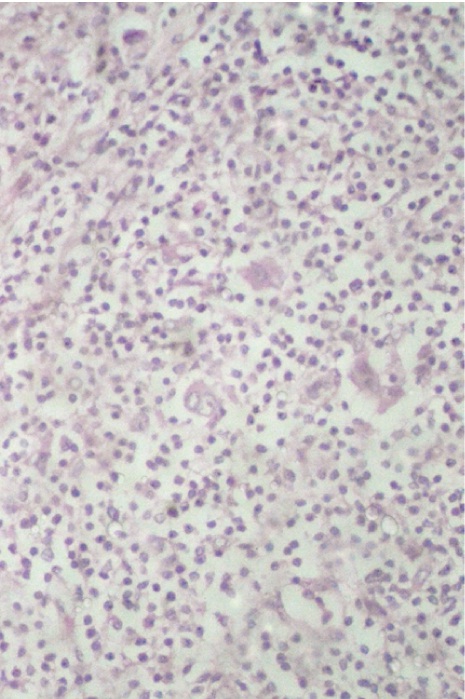
In [Table/Fig-7a, b] two core needle biopsy sections each show > 80% cellularity and > 75 % cellularity under high power magnification (X200). In [Table/Fig-8a], section from the mastectomy specimen post neoadjuvant chemotherapy shows < 10% cellularity depicting a marked reduction in tumor cellularity while [Table/Fig-8a] shows a higher magnification (X200) of the same section as in [Table/Fig-8b]. [Table/Fig-9a] depicts a section from the mastectomy specimen post neoadjuvant chemotherapy with <1% cellularity and a dense lymphocytic infiltration while [Table/Fig-9b] shows a higher magnification (X200) of the same.
Section from core needle biopsy show > 80% cellularity comprised of infiltrating duct cell carcinoma infiltrating the underlying fibrotic stroma. X200, Hematoxylin and Eosin stain;
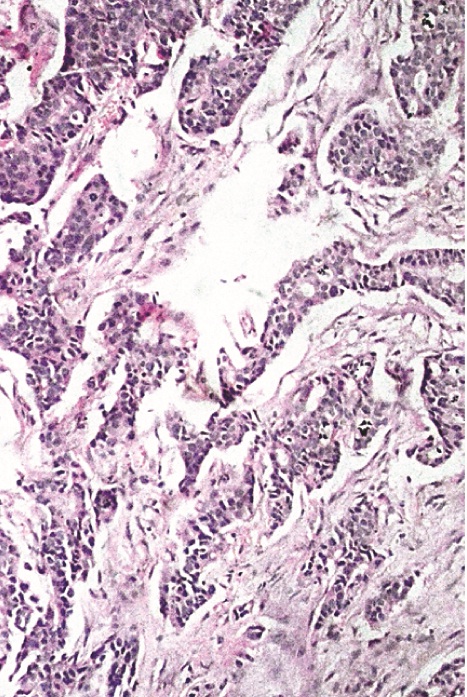
Section from core needle biopsy show > 75% cellularity comprised of infiltrating duct cell carcinoma infiltrating the underlying fibrotic stroma. X200, Hematoxylin and Eosin stain
Section from mastectomy specimen, post neoadjuvant chemotherapy showing <10% cellularity with significant reduction in tumour size, x40, Hematoxylin and Eosin stain;
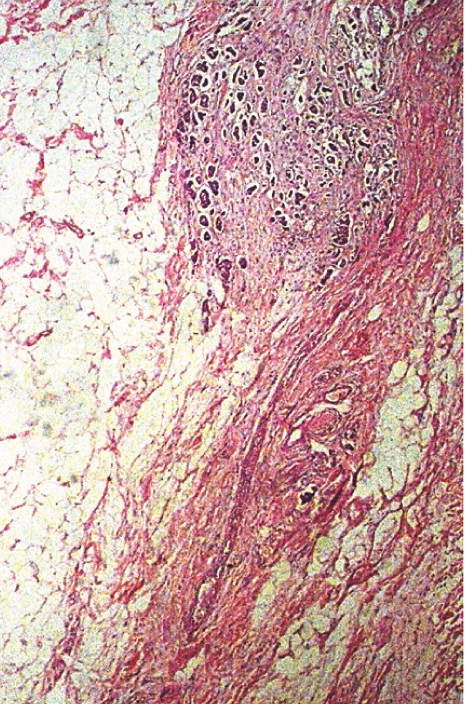
Section shows higher magnification of fig 8a, highlighting reduced cellularity with significant fibrosis in the background, X200, Hematoxylin and Eosin stain
Section from mastectomy specimen, post neoadjuvant chemotherapy showing <1% cellularity with dense lymphocytic infiltration, x40, Hematoxylin and Eosin stain;
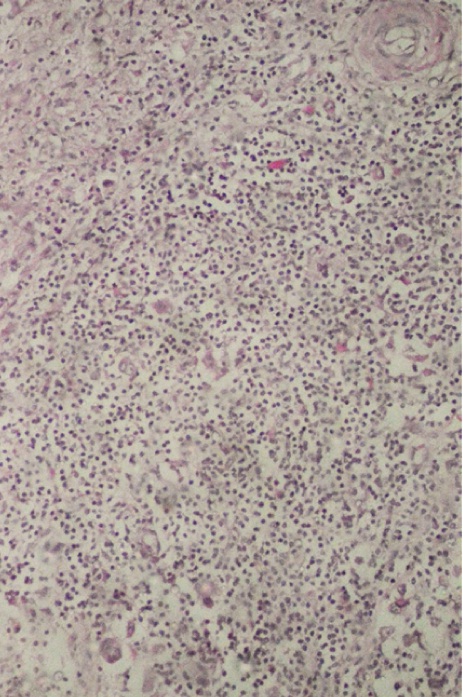
Section shows higher magnification of [Table/Fig-9a], highlighting very occasional tumour cells (Arrows), X200, Hematoxylin and Eosin stain
Discussion
Clinical trials consistently indicate that the extent of response of primary breast carcinomas to neoadjuvant chemotherapy correlates with disease-free and overall survival [2–10]. The currently used categories of clinical response (namely CR, PR, NR and PD) are defined by the changes in the tumour size, which are obtained from pretreatment clinical and radiological, and pathological measurements. However, residual tumour size is influenced by variable pathological changes that occur within the tumour bed, especially the chemotherapy induced stromal involution can result in clinical and macroscopic investigations [14]. In the current study, the microscopic evaluation of tumour cellularity was assessed for the evaluation of tumour response. The role that macroscopic assessment of tumour cellularity could have in the pathological evaluation of tumour response, was evaluated in the current study in 37 cases of locally advanced breast carcinoma, which were on neoadjuvant chemotherapy.
It was observed that in breast carcinomas, the cellularity of the tumour mass was reduced significantly by neoadjuvant chemotherapy (p<0.05, paired samples t-test). The change in cellularity is widely variable between individual patients and in different categories of clinical response and residual tumour sizes. Relative changes in cellularity which are seen, vary widely in tumours which belong to partial response and no response categories of residual tumour category classifications. Change in tumour size alone does not represent the response entirely. Core needle biopsies underestimated overall cellularity at resection. Preferentially sampling the tumour by doing core needle biopsies of the fibrotic centre in that subset of the tumour, may lower the median survival. The artifactual tissue which comes crushing from the biopsy needle may compress the cells and stroma, with apparent increased cellularity. The mucinous areas in colloid carcinomas may have very low cellularity and they may not represent the prognosis.
One of the first studies done on the role of tumour cellularity in breast cancer was that done by Rajan et al., [15]. In that study, the investigators assessed tumour cellularity in the pathological evaluation of response to chemotherapy and found that the cellularity was significantly reduced in the residual tumour beds and that the change was variable in the response groups. The observations of our study were in concordance with those of the study done by Rajan R et al., Also, the product of tumour cellularity and size, when it was plotted as a histogram, showed a dramatic shift of the curve towards a complete response, suggesting that the product could be a more clinically relevant parameter which could be used for assessing response to neoadjuvant chemotherapy.
A retrospective study done on 176 patients by Ogston et al., showed a reduction in tumour cellularity and it demonstrated a significant correlation with the overall and disease free survival at 5 years [16]. In that study, the authors found histopathological response to be an independent variable. That study added support to our findings that the change in cellularity within the tumour was an independent variable which had to be included in the pathological assessment and which had to be combined with changes in tumour sizes.
Recent studies have also looked at parameters that could assess the response to chemotherapy, by using highly specific radiologic techniques such as MRI and MR spectroscopy [17,18]. However, the assessment of residual tumour disease by using these techniques could be influenced by factors such as subtype of breast cancer, chemotherapy regimen, marker artifact, which could lead to over or underestimation of the residual disease.
Conclusion
Very few studies had considered tumour size and cellularity before neoadjuvant chemotherapy was given, to compare them with the residual pathologic findings seen after treatment. From the current study, we conclude that tumour size and cellularity, together, form an important parameter which can be used for assessing the response to neoadjuvant chemotherapy, which reinforces the findings of the study done by Rajan et al. Further studies are warranted, to measure the product of residual tumour size and change in cellularity before giving treatment, to compare with residual pathological findings seen after treatment.
SBR:-Scarff-Bloom Richardson grade CAF:- Cyclophosphamide, Adriamycin, 5-fluoro uracil regimen PA:-Paclitaxel, Adriamycin regimen
SD:-Standard deviation