Root Cause Analysis (RCA) of Prolonged Laboratory Turnaround Time in a Tertiary Care Set up
Kalyan Khan1
1 Assistant Professor, Department of Pathology, North Bengal Medical College, India.
NAME, ADDRESS, E-MAIL ID OF THE CORRESPONDING AUTHOR: Dr. Kalyan Khan, Assistant Professor, Flat no. 11, Bela Apartment, Netaji Subhas Road, Subhaspally, Siliguri -734001, India.
Phone: 9733347243,
E-mail: kkhan2001@gmail.com
Introduction: Among the multitude of daily administrative problems which are faced by the modern hospitals today, prolonged Turnaround Time (TAT) of laboratory investigations is a crucial one, which affects patient care as well as patient satisfaction adversely.
Aims and Objectives: The specific objectives were to observe the TAT of common laboratory investigations, to identify cause of increased turnaround time and to formulate action plans to rectify increased TAT.
Methodology: An observational, RCA study was performed on 100 randomly selected patients. A separate group of 50 patients were assisted to get their investigations done and to reduce the time intervals without actively interfering with the steps. The results which were obtained were accepted as standards. Root cause analysis of the delays which were detected in TAT was done. Time intervals of TAT in the two groups were compared by 2 tailed t-tests done for equality of means.
Result and Analysis: All time intervals were high in the study group and they were found to be statistically significant (p<0.05) within a 95% confidence interval of the difference. The maximum time which was needed in the control group was within the interval between the prescription of the investigation by the doctor and writing of the requisition by the Out-patient Department (OPD) staff. For the study population, it was the interval between the writing of the requisition by the OPD staff and the reaching of the patient at the central Laboratory. The standard deviation (27.665) and range (102) were also exceptionally high for this interval in the study group.
Conclusion: This study revealed that easy to implement administrative steps would help in reducing the TAT significantly and in improving the quality of services of the central laboratory. These include the setting up of sample collection counters at the outpatient department (OPD) and inpatient department (IPD), employment of minor methods like printing the directions for reaching the laboratory on the OPD ticket, the start of a single prick policy, declaring central laboratory as a separate department and integration of the administrative control under one authority.
Laboratory Turnaround Time, Root Cause Analysis, Pathology Investigations
Introduction
Among the multitude of daily administrative problems which are faced by the modern hospitals today, prolonged Turnaround Time (TAT) of laboratory investigations is a crucial one, which affects patient care as well as patient satisfaction adversely and substantially. Health care processes are difficult to define, because of their complexity [1]. Assessing time definitions in clinical processes can help in analyzing workflows in hospital information systems (HIS) and in identifying weak points [2]. Due to increasing costs of health care, it is important to improve the efficiency of clinical workflows.
When process times are analyzed, it is important to be aware of the different definitions which are used for time intervals. One of the most common measures of laboratory or pathological services is the turnaround time (TAT), which has been frequently used since 1980, to quantify the time taken for doing laboratory tests in an objective manner [3]. The first reference dates back to 1971 and it has described TAT as the time interval between electrocardiogram printing and placement of the printout in the patient chart [4]. In the laboratory workflow, TAT is an important indicator of performance [5] and it is even seen as a “necessary condition for trust between patient and physician” [6]. Turnaround time in Pathology comprises of a fixed component, which is assay dependent (that is, the time which is required for analyzing a specimen), and a variable component (the time which is taken to receive the specimen and order, and to post the result) [7].
Root cause analysis (RCA) is a method of problem solving, that tries to identify the root causes of faults or problems that cause operating events. Root cause analysis is a valuable management tool that can be readily learned by managers as well as frontline personnel. It can be conducted at several levels of depth and complexity [8, 9].
Root Cause Analysis (RCA) is defined as “an objective, thorough and detailed methodology which is employed to determine the most probable underlying causes of problems, complaints and undesired events which occur within an organization, with the aim of formulating and agreeing with corrective actions, to at least mitigate, if not eliminate those causes and to so produce a significant, long term performance improvement” [10].
The objectives of the present study were to observe the TAT of common laboratory investigations at the central Laboratory of a tertiary care, state government medical college and hospital, to identify the cause of increased TAT, and to formulate action plans to rectify the increased TAT, if any was detected.
Methodology
The present study was a descriptive, cross-sectional study which was conducted on patients who attended the Medicine and Surgery OPD and on those who were admitted to the Medicine and Surgery In-patient Department (IPD), of a tertiary care, state government medical college and hospital. One hundred patients (25 each from the Medicine and Surgery OPD and IPD) were selected by using a simple random sampling technique. Only those patients were included, who were advised Complete Blood Count (CBC) and/or Urine Routine examinations, who were unrelated to any staff member of the hospital, whose test order was not marked as ‘urgent’ or ‘emergency’ and whose tests were performed free of cost i.e. there was no need to go to the cash counter for paying charges for the test. The TAT of Pathology investigations in the selected patients was observed and the RCA of the delays which were detected in TAT was done. Salient recommendations were formulated on the basis of the findings.
A flow chart was created to identify key steps in the laboratory process [Table/Fig-1]. This allowed the measurement of seven events (i.e., six time intervals, D1 to D6 [Table/Fig-1] and overall TAT.
Key steps in the laboratory process

The existing process and time which was required for final delivery of the report to the ward in case of indoor/admitted patients and also, receipt of the report by the OPD patients were also studied.
Ten groups of five patients from different departments and wards were accompanied by volunteers who helped the patients to get their investigations done. The volunteers tried to reduce the time intervals as far as possible, without actively interfering with the steps. The results which were obtained were accepted as standards or controls [Table/Fig-2].
Descriptive statistics of the 100 cases
| Time Interval | Minimum Time (Minutes) | Maximum Time (Minutes) | Range | Mean (Minutes) | Standard Error of Mean | Standard Deviation of Mean | |
|---|
| D1a | 12 | 65 | 53 | 38.28 | 1.580 | 15.799 | n=100 95% Confidence Interval and Confidence Limit |
| D1b | 20 | 91 | 71 | 51.32 | 2.021 | 20.206 |
| D2a | 5 | 29 | 24 | 13.74 | 0.636 | 6.364 |
| D2b | 45 | 147 | 102 | 91.16 | 2.766 | 27.665 |
| D3a | 21 | 55 | 34 | 35.55 | 0.993 | 9.925 |
| D3b | 11 | 26 | 15 | 18.71 | 0.393 | 3.927 |
| D4a | 16 | 23 | 7 | 19.57 | 0.201 | 2.011 |
| D4b | 16 | 23 | 7 | 18.95 | 0.189 | 1.893 |
| D5 | 10 | 58 | 48 | 29.53 | 1.333 | 13.325 |
| D6 | 15 | 45 | 30 | 27.32 | 1.065 | 10.652 |
The 100 cases which were studied and their samples were traced passively by using a time motion study. The patients, their accompanying persons and concerned administrative key persons were interviewed directly for obtaining necessary information. The results which were obtained for these 100 cases were compared with the standard or control time intervals [Table/Fig-3 and 4].
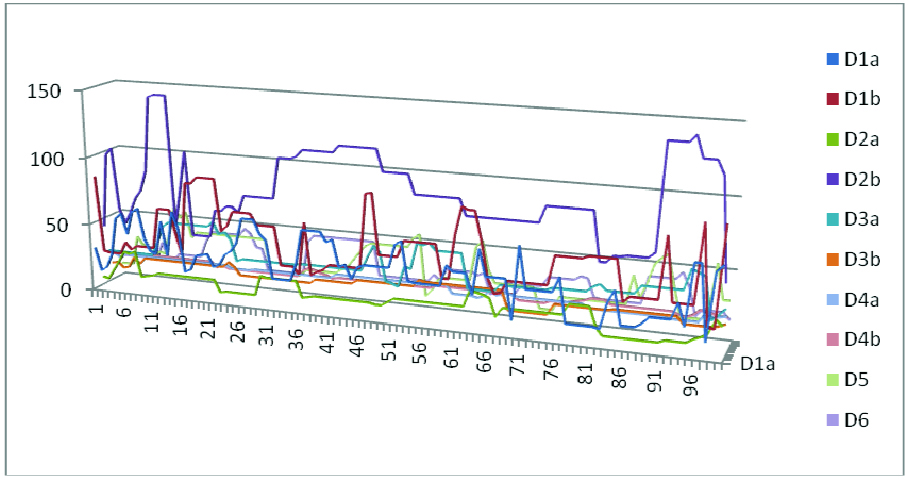
The time intervals studied in the 100 cases
Comparison of the six time intervals between the case and control groups
| Time Interval | t-test for Equality of Means | 95% Confidence Interval of the Difference |
|---|
| t- value | Degree of Freedom | Significance (2-tailed) | Mean Difference | Standard Error Of Difference | Lower | Upper |
|---|
| D1a | 17.755 | 102.209 | 0.003 | 28.280 | 1.593 | 25.121 | 31.439 |
| D1b | 12.835 | 104.837 | 0.002 | 26.320 | 2.051 | 22.254 | 30.386 |
| D2a | 13.518 | 105.268 | 0.012 | 8.740 | 0.647 | 7.458 | 10.022 |
| D2b | 27.456 | 100.053 | 0.001 | 76.160 | 2.774 | 70.657 | 81.663 |
| D3a | 20.289 | 107.002 | 0.002 | 20.550 | 1.013 | 18.542 | 22.558 |
| D3b | 19.723 | 138.711 | 0.010 | 8.710 | 0.442 | 7.837 | 9.583 |
| D4a | 26.554 | 130.713 | 0.011 | 7.570 | 0.285 | 7.006 | 8.134 |
| D4b | 32.327 | 125.085 | 0.009 | 8.950 | 0.277 | 8.402 | 9.498 |
| D5 | 14.491 | 103.493 | 0.002 | 19.530 | 1.348 | 16.857 | 22.203 |
| D6 | 11.363 | 105.973 | 0.008 | 12.320 | 1.084 | 10.170 | 14.470 |
The data was collected in an MS Excel sheet and it was analyzed by frequency distribution and descriptive statistics, along with other parametric and non-parametric tests accordingly, by using Epi-info 7 and SPSS, version 14.Chikago.inc.
Results and Analysis
The age of the study population ranged from 19 to 85 years, with a mean of 41.7 years. Male and female patients accounted for 52% and 48% of the study population respectively. Complete Blood Count (CBC) and Urine Routine examinations, the two most commonly advised pathological tests, were studied for their turnaround times (TATs).
CBC was advised in 89% of the study population and 46% were advised Urine Routine Examination. Eighty eight percent of the patients were also advised some other investigations which were mostly biochemical tests. [Table/Fig-2] shows the descriptive statistics of the 100 cases. Maximum time which was needed in almost all of the cases was between the preparation of test requisition and the reaching of the patient at the central laboratory.
[Table/Fig-2] shows the time intervals studied in the 100 cases. [Table/Fig-5] shows the descriptive statistics of the 50 control or intervention cases.
Descriptive statistics of the 50 controls
| Time Interval | Minimum Time (Minutes) | Maximum Time (Minutes) | Range | Mean (Minutes) | Standard Error of Mean | Standard Deviation of Mean | |
|---|
| D1a | 8 | 12 | 4 | 10.00 | 0.202 | 1.429 | n=50 95% Confidence Interval and Confidence Limit |
| D1b | 21 | 29 | 8 | 25.00 | 0.350 | 2.474 |
| D2a | 4 | 6 | 2 | 5.00 | 0.114 | 0.808 |
| D2b | 13 | 17 | 4 | 15.00 | 0.202 | 1.429 |
| D3a | 13 | 17 | 4 | 15.00 | 0.202 | 1.429 |
| D3b | 8 | 12 | 4 | 10.00 | 0.203 | 1.429 |
| D4a | 10 | 14 | 4 | 12.00 | 0.201 | 1.429 |
| D4b | 8 | 12 | 4 | 10.00 | 0.202 | 1.429 |
| D5 | 8 | 12 | 4 | 10.00 | 0.201 | 1.429 |
| D6 | 13 | 17 | 4 | 15.00 | 0.202 | 1.429 |
[Table/Fig-6] shows the parameters studied and their values along with the control values for each. Please refer to [Table/Fig-1] for further clarifications about the parameters.
Parameters studied and their values along with the control values for each
| Time Intervals | Time interval between | Range (in minutes) | Mean (Minutes) | Control (Minutes) |
|---|
| Minimum | Maximum |
|---|
| D1a | T2a and T1a | 12 | 65 | 38.2 | 10 |
| D1b | T2b and T1b | 27 | 91 | 51.3 | 25 |
| D2a | T3a and T2a | 05 | 29 | 13.7 | 05 |
| D2b | T3b and T2b | 40 | 147 | 91.6 | 15 |
| D3a | T4a and T3a | 21 | 55 | 35.5 | 15 |
| D3b | T4b and T3b | 11 | 26 | 18.7 | 10 |
| D4a | T5 and T4a | 16 | 23 | 19.5 | 12 |
| D4b | T5 and T4b | 14 | 20 | 18.9 | 10 |
| D5 | T6 and T5 | 10 | 58 | 29.5 | 10 |
| D6 | T7 and T6 | 15 | 45 | 27.3 | 15 |
| Total | 171 | 559 | 344.2 | 127 |
The maximum time which was needed in the control group was in D1b i.e. the interval between prescription of the investigation by the doctor and the writing of the requisition by the OPD staff for the said investigation. But for the study population, the maximum time which was needed was in D2b i.e. the interval between writing of the requisition by the OPD staff and the reaching of the patient at the central Laboratory. The standard deviation (27.665) and range (102) were also exceptionally high for this interval in the cases group.
[Table/Fig-4] shows the comparison of the six time intervals between the case and control groups of 100 and 50 patients respectively.
The above [Table/Fig-5] shows that all the time intervals, both in case of the OPD and IPD cases, were high in the study group in comparison to the control group and they were found to be statistically highly significant (p<0.05) within a 95% confidence interval of the difference.
The time motion study and direct interviews revealed the following: The manning and control of Pathology subunit was undertaken by the office of the Medical Superintendant cum Vice Principal (MSVP); whereas those of the Microbiology and Biochemistry subunits were undertaken by the respective departments of the Medical College.
In the same complex of central Laboratory, in three separate rooms, a single patient was pricked thrice if he/she needed tests for haematology (say, blood RE), microbiology (say, malaria antigen) and biochemistry (say, blood sugar, urea or creatinine).
These three reports were to be collected by the patients from three different tables and may be at variable time intervals [Table/Fig-7 and 8].
Mean differences in time intervals of TAT between the study group and the control group and the causes, along with their suggested solutions
| Time Interval | Mean Difference | Standard Deviation of Mean of study cases | Major Causes of delay | Suggested Solutions |
|---|
| D1a | 28.280 | 15.799 | No separate/designated staff for test order entry. Paper-work involved.
| Separate team of lab staffs may be posted at OPD and IPD for sample collection at a counter in a prominent position. Clear instruction regarding requisition making at the point of advising tests. Training of staff regarding importance of pre-analytical phase of tests. Electronic test order entry software with bar-coding of samples may be started in the future.
|
| D1b | 26.320 | 20.206 | Lack of clear instruction to patient about where requisition would be made. Paper-work involved. (dedicated staff present)
|
| D2a | 8.740 | 6.364 | No separate / designated staff for phlebotomy or sample collection. Usually treated as low priority job in comparison to therapeutic management of patients in the wards.
|
| D2b | 76.160 | 27.665 | Lack of proper direction to reach the Central Laboratory which is far away from the OPD. Those who are conversant reach early; hence the Standard Deviation is more. Difficulty in identifying the Central Laboratory entrance. No sign-boards in vernacular languages [Table/Fig-8].
| Sample collection counter at OPD. Direction to the Central Laboratory may be printed on the OPD tickets. Lab entrance should be made visible and more identifiable. Sign-boards especially in vernacular languages should be installed. Existing social workers, volunteers and ‘May I help you’ desks should be utilized more efficiently.
|
| D3a | 20.550 | 9.925 | Individual wards have separate staffs to transport the samples to the Laboratory. Hence availability of staff is less.
| Single messenger can transport samples from a few closely located wards thus increasing the availability of staff.
|
| D3b | 8.710 | 3.927 | No designated staff for phlebotomy or sample collection. Senior technicians usually treat phlebotomy or sample collection as low priority job in comparison to actual testing.
| Sample collection counter at OPD. Training of staff regarding importance of pre-analytical phase of tests.
|
| D4a | 7.570 | 2.011 | Laboratory staff accumulate samples and register them at a time. Paper-work involved.
| Accumulation of samples should be discouraged. Training of staff regarding ill effects of sample accumulation and importance of post-analytical phase of testing. Designated report delivery desk may be started with a separate staff. Electronic test result approval system may be started in the hospital including the OPD within its domain.
|
| D4b | 8.950 | 1.893 | Laboratory staff accumulate samples and register them at a time. Paper-work involved.
|
| D5 | 19.530 | 13.325 | Laboratory staff accumulate samples and test them at a time. Hence samples have variable waiting time which increased the Standard Deviation.
|
| D6 | 12.320 | 10.652 | Laboratory staff accumulate the reports and dispatch them at intervals. No designated staff is available for report delivery which is treated as a low priority job.
|
The reception counter at the Central Laboratory is devoid of any sign boards or directions in any vernacular languages

The following were the mean differences in time intervals of TAT between the study group and the control group and the causes, along with their suggested solutions.
The extent to which improvements in laboratory turnaround time enhance patient outcomes is still unclear [11]. A critical issue is clinicians’ capacities in responding to, and making clinical use of faster results. The limited data which are available to date are not encouraging. A UK study which investigated the impact of ward computers which allowed access to laboratory results, found that 45% of urgent requests for biochemistry tests from accident and emergency wards, and 29% from inpatient wards, were never accessed. Of the results which were never read, 3% were assessed as necessitating an immediate change in patient management. [12]. Clinicians report dissatisfaction with current tracking and follow up of test results [13]. So, unless clinicians’ behaviours change, for utilizing faster results, we face the risk of over optimizing a single system. Additional system features such as e-mail inboxes which post important results to clinicians directly, or computer alerts which highlight urgent results, may help in supporting a better test management [14].
Conclusion
The present study arrived at the following conclusions: The Turn-around Times of investigations which were performed at the central Laboratory, especially the pre and post-analytical steps, were prolonged and these were statistically significant.
In the observed TAT of the study population, maximum time needed was in the interval between writing of the requisition by the OPD staff and the reaching of patient at the central Laboratory. Hence, employment of minor methods, like printing the directions for reaching the laboratory on the OPD ticket, would substantially bring down the TAT and subsequently increase patient satisfaction.
This study also revealed that certain easy to implement administrative steps would also help in reducing the TAT significantly and simultaneously improve the quality of services of the central Laboratory as a whole. These include the setting up of sample collection counters at the OPD and IPD, the start of a single prick policy and declaring central Laboratory as a separate department.
The TAT can be substantially reduced if minor assistance without active interference is provided to the patients. This was observed in the present study, among the control group of patients.
[1]. Ammenwerth E, Ehlers F, Eichstädter R, Haux R, Pohl U, Resch F, Systems analysis in health care: framework and exampleMethods Inf Med 2002 41:134-40. [Google Scholar]
[2]. Lenz R, Buessecker F, Herlofsen H, Hinrichs F, Zeiler T, Kuhn KA, Demand driven Evolution of IT Systems in HealthcareMethods Inf Med 2005 44:4-10. [Google Scholar]
[3]. Bloch DM, Computer-generated management tools for the clinical pathology laboratory. II. Computer-generated graphic work flowJ Med Syst 1982 6:305-10.doi: 10.1007/BF00992807 [Google Scholar]
[4]. Tell R, Hoffman I, The elimination of turnaround time in routine ECG processingJ Electrocardiol 1971 4:279-81.doi: 10.1016/S0022-0736(71)800420 [Google Scholar]
[5]. Hawkins RC, Laboratory turnaround timeClin Biochem Rev 2007 28(4):179-94. [Google Scholar]
[6]. Braddock CH, Snyder L, The Doctor Will See You Shortly The Ethical Significance of Time for the Patient-Physician RelationshipJ Gen Intern Med 2005 20:1057-62.doi: 10.1111/j.1525-1497.2005.00217.x [Google Scholar]
[7]. Ash J S, Gorman P N, Lavelle M, Perceptions of physician order entry: results of a cross site qualitative studyMethods Inf Med 2003 42:313-23. [Google Scholar]
[8]. Williams Patricia M, Techniques for root cause analysisProc (Bayl Univ Med Cent 2001 14:154-7. [Google Scholar]
[9]. Battles JB, Kaplan HS, van der Schaaf TW, Shea CE, The attributes of medical event-reporting systems: experience with a prototype medical event-reporting system for transfusion medicineArch Pathol Lab Med 1998 122:231-8. [Google Scholar]
[10]. Vorley G, Tickle F, Quality Management – Principles and Techniques 2002 Q M and T Publishers [Google Scholar]
[11]. Garg A, Adhikari N, McDonald H, Effects of computerized clinical decision support systems on practitioner performance and patient outcomes. A systematic reviewJ Am Med Inform Assoc 2005 29:1223-38. [Google Scholar]
[12]. Kilpatrick E S, Holding S, Use of computer terminals on wards to access emergency test results: a retrospective auditBMJ 2001 32:101-3. [Google Scholar]
[13]. Poon E, Gandhi T, Sequist T, I wish I had seen this test result earlier! Dissatisfaction with test result management systems in primary careArch Intern Med 2004 16:223-8. [Google Scholar]
[14]. Rind D, Safran C, Phillips R, Effect of computer based alerts on the treatment and outcomes of hospitalised patientsArch Intern Med 1994 15:511-7. [Google Scholar]