Noise is a mostly unwanted random sound. Its intensity is measured in decibels (dB). Noise is increasingly becoming a pervasive occupational health concern to practicing dentists as well as to the patients. Prolonged acoustic noise [1] is harmful and can cause noise-induced hearing loss (NIHL). The extent of the damage caused by noise depends primarily on the intensity, frequency of them sounds and exposure to noise. In the field of dentistry, researchers have focused the effect of noise in dental clinics on dental professionals, who are exposed to high noise levels for extended periods. Even though, the exposure time of patients to noise in the dental clinic is limited to the treatment time, and may not lead to induced hearing losses, there are indications that dental anxiety, related to fear is aroused by dental equipment/instruments, tend to be a source of patient discomfort [2,3]. The sources of dental sounds that can pose as a potential hazard to hearing system of dentists and patients include high-speed turbine hand pieces, low-speed hand pieces, high-velocity suction, ultrasonic instruments and cleaners, vibrators, mixing devices such as amalgamators and model trimmers [4–13]. Occupational Safety and Health Administration (OSHA) has reported the daily permissible noise level of 85 decibels for 8 hours of continual exposure [14].
Methods
Study Design and Study Sites
The research protocol of the study was reviewed and ethical clearance was obtained from Jaipur Dental College Institutional Board. Prior to conducting the study, the investigator pilot tested the survey questionnaire among 10 eligible subjects who reported to the Department of Public Health Dentistry, Jaipur Dental College for similar type of restorative treatments to ascertain the appropriateness and applicability of the questionnaire and clinical examination.
Sample size at 95% confidence level and allowable error of 15%, assuming effect in 50% of the study participants, minimum of 178 subjects were required as sample size.
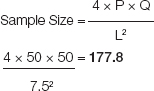
P = Expected proportion of subjects with fear, (Q = 1 – P), L = Allowable error
Thus, the sampling frame comprised of 180 patients, out of which 90 patients attending 10 different private clinics and 90 patients attending a Private Dental College and Hospital in Jaipur, from May to June 2013, were selected.
Before beginning the study, list of practicing dentists working in the college and private practitioners was obtained from the administrative department of college and the Jaipur branch of the Indian Dental Association respectively. A total of 10 practicing dentists with dental laboratories attached to their clinics were randomly picked by the lottery method from both the lists. Written permission was sought from the dentists for conducting the study in their clinics. Nine patients from each dental clinic who fulfilled the inclusion criteria were included in the study. Similarly, total of ninety patients attending the department of Public Health Dentistry, Jaipur Dental College were included in the study.
The levels of Acoustic Noise Stimulus originating from different tools were measured using a sound level meter/decibulometer (SL-4010, Lutron Electronics). The device consists of an electric condenser microphone and a LCD display. Noise in the clinic was assessed by placing the sound level meter in the waiting area and in the middle of the clinic away from the walls. To assess the noise from various handpieces, the decibulometer was placed 5–7 cm away from the sound source (dental tools) at an angle close to 45°. For reproducibility, each measurement was repeated 3 times from different angles. The average of the 3 readings was calculated and taken as the sound level for that particular handpiece in dBA. The measurements of the noise levels were recorded by a separate recorder and thus the principal investigator was blinded.
The study participants for fear survey included healthy subjects aged between 15-50 years, who were co-operative and granted their consent, visiting the dental clinic for the 2nd or 3rd time and undergoing similar type of restorative treatment. Un-cooperative patients visiting the dental clinic for the first time were excluded. Also, paediatric patients and the patients with hearing impairment/ wearing hearing aids were excluded. To assess the effect of noise on patients, a survey questionnaire was used, which included three parts. The first part included demographic information such as age, gender, education and residence. The second part was a comprehensive close-ended, pre-tested, self administered, 19 itemed fear scale survey questionnaire using Dental Fear Scale (DFS) [17], pertaining to fear experienced in association with various events before, during and after the dental treatment, aimed at assessing patient’s feelings towards noise in the dental clinic while waiting, during and after the treatment and possible links to dental fear. The third part included the annoyance scale aimed at assessing patient’s annoyance level after the treatment. The respondents were asked to rate each situation selecting from 5-step categories in terms of how much each situation made them fearful. Category 1 indicated no fear and category 5 indicated very fearful.
Data was entered and analyzed using Med Calc v12.2.1.0. Frequencies were calculated for all variables. For each of the parameters in the questionnaire, the percentage means and standard deviations for both groups were calculated. Inter group comparison were done and computed from chi square test and unpaired t-test. For all tests a p value of 0.05 or less was used for statistical significance.
Results
Out of the total study participants, 45.56% subjects were males and remaining 54.44% were females. The rural-urban ratio of the participants was found to be 0.6:1.
The mean noise level was maximum in pre-clinical setup (69.23 dB) followed by Prosthodontics (61.13 dB), and was found to be least for Public Health Dentistry (56.76 dB) followed by private clinics (56.79 dB). It was found that cutting and mixing equipments of college setup were producing significantly higher noise levels than at private dental clinic setups (p<0.05). Polishing, lathe and vibrating equipments were also producing more noise levels at college setup than at private dental clinic setups. However, it was not statistically significant (p>0.05)
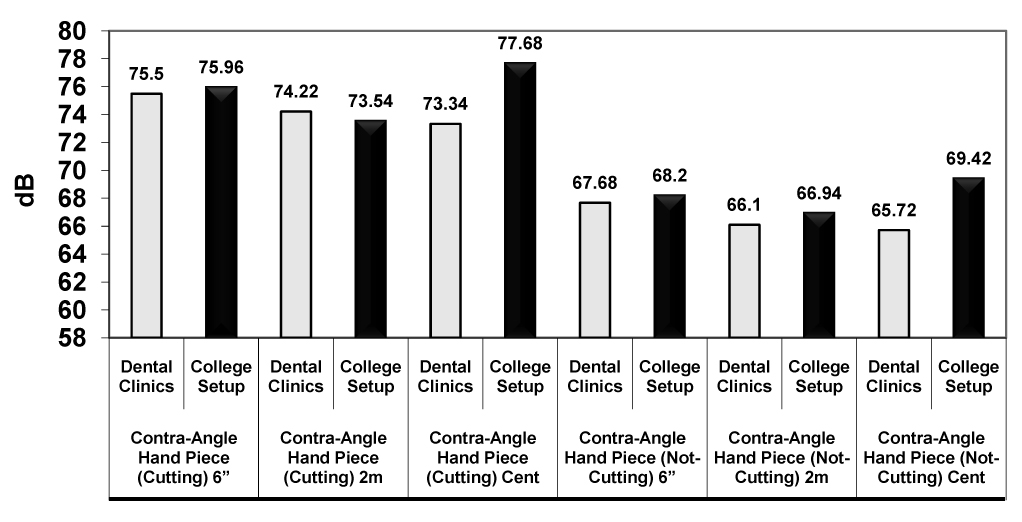
[Table/Fig-1] shows that noise levels produced by Contra-Angle Hand Piece at college setup was significantly higher (p<0.05) than Contra-Angle Hand Piece (Cutting) and Contra-Angle Hand Piece (Not- Cutting) in the centre of the clinic when compared to private dental clinics.
Mean noise levels of conta-angle hand pieces at various distances in different clinical setups
[Table/Fig-2,3] shows, the mean noise level of various clinical equipments in different clinical setups. At private clinics, the mean noise levels were maximum for High Volume Suction Pump (84.26 dB+0.51). At the college setup, it was maximum for Two Way Syringe (84.78 dB +1.12) followed by High Volume Suction Pump (84.62 dB+0.50).
Noise Levels of various clinical equipments in different clinical setups *Unpaired- t-test
| Equipment | Setup | N | Mean | Std. Deviation | p-value* |
|---|
| Contra-Angle Hand Piece (Cutting) 6” | Dental Clinics | 5 | 75.50 | 1.43 | 0.591 |
| College Setup | 5 | 75.96 | 1.15 |
| Contra-Angle Hand Piece (Cutting) 2m | Dental Clinics | 5 | 74.22 | 1.27 | 0.439 |
| College Setup | 5 | 73.54 | 1.36 |
| Contra-Angle Hand Piece (Cutting) Centre | Dental Clinics | 5 | 73.34 | 0.80 | 0.000* |
| College Setup | 5 | 77.68 | 0.55 |
| Contra-Angle Hand Piece (Not- Cutting) 6” | Dental Clinics | 5 | 67.68 | 0.93 | 0.407 |
| College Setup | 5 | 68.20 | 0.94 |
| Contra-Angle Hand Piece (Not- Cutting) 2m | Dental Clinics | 5 | 66.10 | 1.08 | 0.240 |
| College Setup | 5 | 66.94 | 1.01 |
| Contra-Angle Hand Piece (Not- Cutting) Centre | Dental Clinics | 5 | 65.72 | 1.23 | 0.000* |
| College Setup | 5 | 69.42 | 0.72 |
| U/S Scaler Without Suction Pump | Dental Clinics | 5 | 81.28 | 0.77 | 0.066 |
| College Setup | 5 | 82.56 | 1.11 |
| U/S Scaler With Suction Pump | Dental Clinics | 5 | 83.14 | 0.46 | 0.012* |
| College Setup | 5 | 84.24 | 0.60 |
| Micro Motor Cutting | Dental Clinics | 5 | 75.34 | 1.05 | 0.515 |
| College Setup | 5 | 75.72 | 0.67 |
| Two Way Syringe | Dental Clinics | 5 | 84.24 | 0.87 | 0.420 |
| College Setup | 5 | 84.78 | 1.12 |
| Low Volume Suction Pump | Dental Clinics | 5 | 74.50 | 1.18 | 0.180 |
| College Setup | 5 | 75.40 | 0.70 |
| High Volume Suction Pump | Dental Clinics | 5 | 84.26 | 0.51 | 0.292 |
| College Setup | 5 | 84.62 | 0.50 |
Mean noise levels produced by various clinical equipments in different clinical setups
[Table/Fig-4] shows the distribution of patients according to fear level while hearing the drill and various independent factors. The setup of the clinic, age and gender of the patients along with the residential background, education and occupation of the patient were significantly associated (p<0.05) with the fear level of the patients. However, music in the reception area was not found to be significantly associated with the fear level of the patients (p>0.05).
Distribution of patients with fear while hearing the drill *Chi-square (χ2) test
| n | Low fear | Afraid | Very afraid | Terrified | p-value* |
|---|
| No. | % | No. | % | No. | % | No. | % | |
|---|
| Music |
| No | 144 | 27 | 18.75 | 86 | 59.72 | 24 | 16.67 | 7 | 4.86 | 0.545 |
| Yes | 36 | 9 | 25.00 | 27 | 75.00 | 0 | 0.00 | 0 | 0.00 |
| Setup |
| College | 90 | 12 | 13.33 | 52 | 57.78 | 20 | 22.22 | 6 | 6.67 | 0.000* |
| Private Clinics | 90 | 24 | 26.67 | 61 | 67.78 | 4 | 4.44 | 1 | 1.11 |
| Age (years) |
| 15-30 | 84 | 23 | 27.38 | 52 | 61.90 | 8 | 9.52 | 1 | 1.19 | 0.000* |
| 31-40 | 50 | 8 | 16.00 | 38 | 76.00 | 4 | 8.00 | 0 | 0.00 |
| 41-50 | 46 | 5 | 10.87 | 23 | 50.00 | 12 | 26.09 | 6 | 13.04 |
| Gender |
| Male | 82 | 29 | 35.37 | 47 | 57.32 | 5 | 6.10 | 1 | 1.22 | 0.000* |
| Female | 98 | 7 | 7.14 | 66 | 67.35 | 19 | 19.39 | 6 | 6.12 |
| Residence |
| Rural | 65 | 11 | 16.92 | 37 | 56.92 | 15 | 23.08 | 2 | 3.08 | 0.048 |
| Urban | 115 | 25 | 21.74 | 76 | 66.09 | 9 | 7.83 | 5 | 4.35 |
| Education |
| Graduate | 52 | 18 | 34.62 | 31 | 59.62 | 2 | 3.85 | 1 | 1.92 | 0.000* |
| High School | 58 | 12 | 20.69 | 36 | 62.07 | 5 | 8.62 | 5 | 8.62 |
| Middle School | 41 | 5 | 12.20 | 30 | 73.17 | 6 | 14.63 | 0 | 0.00 |
| Primary School | 13 | 1 | 7.69 | 9 | 69.23 | 2 | 15.38 | 1 | 7.69 |
| Illiterate | 16 | 0 | 0.00 | 7 | 43.75 | 9 | 56.25 | 0 | 0.00 |
| Occupation |
| Student | 33 | 7 | 21.21 | 23 | 69.70 | 3 | 9.09 | 0 | 0.00 | 0.000* |
| Self Employed | 27 | 3 | 11.11 | 18 | 66.67 | 1 | 3.70 | 5 | 18.52 |
| Skilled | 16 | 9 | 56.25 | 5 | 31.25 | 2 | 12.50 | 0 | 0.00 |
| Unskilled | 16 | 0 | 0.00 | 15 | 93.75 | 0 | 0.00 | 1 | 6.25 |
| Govt. Employee | 19 | 5 | 26.32 | 13 | 68.42 | 1 | 5.26 | 0 | 0.00 |
| Pvt. Employee | 35 | 12 | 34.29 | 18 | 51.43 | 4 | 11.43 | 1 | 2.86 |
| Unemployed | 34 | 0 | 0.00 | 21 | 61.76 | 13 | 38.24 | 0 | 0.00 |
The presence of music in the reception area, setup of the clinic, age and gender of the patients along with the residential background, education and occupation of the patient were significantly associated (p<0.05) with the fear level of the patients on seeing the drill.
[Table/Fig-5] shows, distribution of patients according to the level of annoyance and various independent factors. The presence of background music in the reception area, setup of the clinic, age and gender of the patients along with the residential background, education and occupation of the patient were all significantly associated (p<0.05) with the annoyance level of the patients.
Distribution of patients according to the level of annoyance and various independent factors
*Chi-square (χ2) test
| n | Not at all annoyed | Moderately annoyed | Annoyed | Very annoyed | p-value* |
|---|
| No. | % | No. | % | No. | % | No. | % | |
|---|
| Music |
| No | 144 | 14 | 9.72 | 59 | 40.97 | 61 | 42.36 | 10 | 6.94 | 0.004* |
| Yes | 36 | 7 | 19.44 | 22 | 61.11 | 7 | 19.44 | 0 | 0.00 |
| Setup |
| College | 90 | 3 | 3.33 | 30 | 33.33 | 47 | 52.22 | 10 | 11.11 | 0.000* |
| Private Clinics | 90 | 18 | 20.00 | 51 | 56.67 | 21 | 23.33 | 0 | 0.00 |
| Age (years) |
| 15-30 | 84 | 14 | 16.67 | 45 | 53.57 | 18 | 21.43 | 7 | 8.33 | 0.001* |
| 31-40 | 50 | 6 | 12.00 | 17 | 34.00 | 25 | 50.00 | 2 | 4.00 |
| 41-50 | 46 | 1 | 2.17 | 19 | 41.30 | 25 | 54.35 | 1 | 2.17 |
| Gender |
| Male | 82 | 16 | 19.51 | 47 | 57.32 | 18 | 21.95 | 1 | 1.22 | 0.000* |
| Female | 98 | 5 | 5.10 | 34 | 34.69 | 50 | 51.02 | 9 | 9.18 |
| Residence |
| Rural | 65 | 1 | 1.54 | 23 | 35.38 | 36 | 55.38 | 5 | 7.69 | 0.000* |
| Urban | 115 | 20 | 17.39 | 58 | 50.43 | 32 | 27.83 | 5 | 4.35 |
| Education |
| Graduate | 52 | 17 | 32.69 | 26 | 50.00 | 7 | 13.46 | 2 | 3.85 | 0.000* |
| High School | 58 | 3 | 5.17 | 31 | 53.45 | 23 | 39.66 | 1 | 1.72 |
| Middle School | 41 | 1 | 2.44 | 17 | 41.46 | 21 | 51.22 | 2 | 4.88 |
| Primary School | 13 | 0 | 0.00 | 7 | 53.85 | 6 | 46.15 | 0 | 0.00 |
| Illiterate | 16 | 0 | 0.00 | 0 | 0.00 | 11 | 68.75 | 5 | 31.25 |
| Occupation |
| Student | 33 | 6 | 18.18 | 22 | 66.67 | 4 | 12.12 | 1 | 3.03 | 0.000* |
| Self Employed | 27 | 0 | 0.00 | 17 | 62.96 | 10 | 37.04 | 0 | 0.00 |
| Skilled | 16 | 5 | 31.25 | 6 | 37.50 | 4 | 25.00 | 1 | 6.25 |
| Unskilled | 16 | 0 | 0.00 | 8 | 50.00 | 4 | 25.00 | 4 | 25.00 |
| Govt. Employee | 19 | 6 | 31.58 | 6 | 31.58 | 6 | 31.58 | 1 | 5.26 |
| Pvt. Employee | 35 | 4 | 11.43 | 18 | 51.43 | 12 | 34.29 | 1 | 2.86 |
| Unemployed | 34 | 0 | 0.00 | 4 | 11.76 | 28 | 82.35 | 2 | 5.88 |
Discussion
Exaggerated noise produced as a result of acoustic environment is the most significant risk factor for the noise induced hearing loss (NIHL) [18,19].
The present study revealed that the mean noise level was maximum for pre-clinical setup/ Laboratory areas (69.23 dB) followed by clinical setup of Prosthodontics. Statistical significant difference was found when compared between each department. The results were in agreement with other studies [20, 21].
The present study demonstrated that noise levels produced by cutting and mixing equipments of college setup were producing significantly higher noise levels than at private dental clinic setups. At the dental hospital laboratories, all the work is carried out in a single, medium sized room. Since the working environment is restricted, higher noise levels are produced, whereas private clinical setup laboratories have better sound absorbing material walls, sound proof acoustical ceiling and restricted entry. Also private clinic laboratories use newer equipments as compared to older equipments by college setups consisting of bearing failures, affected by wear and resulting in higher friction [20].
The mean decibel ratings for stone mixers were found to be 84 dB [5]. The present study showed that the noise produced by Contra-Angle Hand Piece (cutting and non cutting) at 6 inches and at 2 metres, U/S Scaler Without Suction Pump, Micro Motor (Cutting), Two Way Syringe, Low and High Volume Suction Pump did not show any significant difference (p>0.05) between private clinics and college setup. The high speed dental air turbines emit noise at frequencies which might be attributed to variations in aerodynamic and structural components of each handpiece. The former as a result of the turbulence in the air flow path and the latter as a result of the bearings of the air turbine rotor [22].
The present study demonstrated that polishing, lathe and vibrating equipments were also producing more noise at college setup than at private dental clinic setups but it was not statistically significant. Similar results were observed from other studies [20, 23].
High speed turbine was the noisiest equipment when compared to low speed contra angle and straight handpieces [20]. The dentist should maintain a proper distance from the operating field. The recommended distance from the dentist’s eye to the patient’s mouth was reported to be 14 inches, i.e. about 35 cm [5]. When the operator is closer, decibel rating increases. Exposure to such noise levels have proven to be a cause of concern if the exposure times are extended [1, 24].
The present study revealed that the mean noise levels were maximum for High Volume Suction Pump/ Aspirator followed by Two Way Syringe, U/S scaler with suction Pump, U/S Scaler without suction pump, and was found to be least for Contra-Angle Hand Piece (Not- Cutting) at the centre of the clinic. Similar findings were observed from another study [20]. Significant differences were found between used and brand new ultrasonic scalers when used with or without suction pump (p<0.001). Noise levels of cutting equipments when compared to non-cutting equipments showed that noise generated during cutting activities were significantly higher to those when only turned on. Similar findings were observed from another study [14]. This may be attributed to the friction between the cutting material and cutting tools [25]. The instruments must be activated only when they are ready to be used. According to a study [26], reduction in the noise occurs by one- to two-thirds when it begins cutting a tooth.
Noise and Fear Levels
The present study revealed the effect of music in the reception/ clinical setup area resulted in significantly lower fear levels before the procedures i.e. on seeing the drill (p=0.029), as compared to the fear levels of the patients visiting a clinical setup without background music. However, presence of music in the dental clinic setup had no significant effect on the fear levels during the procedures such as on hearing the drill, feeling the vibrations of the drill and while cleaning the teeth. This can be attributed to the relaxing and the soothing nature of music aimed at distracting the patient from the painful or anxiety- provoking stimuli. But the background music cannot mask the noise coming from various equipments during the procedures. Hence, it doesn’t have any effect on the fear levels while hearing the drill, feeling the vibrations of the drill and while cleaning the teeth.
The sight of the drill, hearing the drill, feeling the vibrations of the drill and getting the teeth cleaned resulted in significantly higher fear levels among the patients attending dental college setup as compared to the patients attending private clinical setup (p<0.005). This might be attributed to the better maintenance and regular servicing of equipments at private clinical setup as compared to college setup resulting in more noise production. It might also be due to simultaneous working of more number of equipments and machinery together. All these factors result in higher noise levels which in turn results in higher fear levels. The results were contrary to a study [27], where the number of respondents who feared hearing the sound of a dental drill and feeling a drill were almost equal. The present study demonstrated that female patients encountered significantly higher fear levels on seeing the drill, hearing the drill and on getting their teeth cleaned (p=0.000).This might be because females are more apprehensive as compared to males with regards to various dental procedures as they have a fear that any uneventful thing during the procedure might affect their aesthetics.
Patients residing in rural areas, less educated patients and unemployed encountered significantly higher fear levels on seeing the drill, hearing the drill on feeling the vibrations of the drill and on getting their teeth cleaned (p<0.001). The reason might be due to less awareness levels, fear of unknown and failure to understand the procedures resulting in more fear and anxiety levels towards the dental procedures.
Annoyance Levels
The annoyance levels of patients were measured using a Likert scale, which ranged from “not at all annoyed” to “extremely annoyed”. It was evident by our study that close to 80% of the adult respondents felt “moderately annoyed” to “extremely annoyed” with the noises in the dental clinic. The patient’s who attended college setup and clinics without background music in their setup resulted in significantly higher annoyance levels as compared to the patients attending private clinics and clinics with background music in their setup. Female patients showed significantly higher annoyance levels when compared to male patients. The results of our study were similar to a study [27], where it was observed that respondents who were not afraid of visiting a dentist were only 11–18%, depicting that most of the respondents had some degree of fear. But the results were contradictory to another [28], where nearly 60% of the adult respondents felt “annoyed” to “extremely annoyed” with the noises in the dental clinic.
Conclusion
The environment in the clinics can directly have an effect on the fear and annoyance levels of patients. The patient’s attending college setup, clinics without background music, uneducated and unemployed patients showed higher annoyance levels as a result of noise. The noise from various dental equipments resulting in increased fear and annoyance levels, act as an access barrier in seeking the dental treatment. Despite the effects of the noise are preventable in the dental setup, the adoption of preventive measures among the dentist as well as the patients should be encouraged in order to protect against the harmful effects of noise and to reduce the fear of patients from visiting a dental clinic.
Limitations
Although, the fear as a result of noise was assessed using Dental Fear Scale (DFS), but some amount of fear can also result from other factors such as from pain, dentist, instruments or even upcoming negative events. These determinants are subjective and change from person to person, which can affect the outcome and validity of the study.
Recommendations
Simultaneous use of several turbines should be avoided.
A schedule should be set up for periodic maintenance of equipments on regular basis to ensure that noise levels from dental equipments is minimized.
We should consider the noise emission levels when purchasing new equipments.
Non aversive techniques like music therapy aimed at distracting the patient from the painful or anxiety- provoking stimuli should be considered.