Introduction: Quality of drinking water is a powerful environmental determinant of health. The main objective of introduction of bottled water in the society was its better safety, taste and convenience over tap water. The present study was conducted to assess physicochemical and bacterial qualities of bottled water and sachet water which were available in various markets of Delhi.
Materials and Methods: Sixteen water bottles and four water sachets were selected through stratified random sampling from various public places in Delhi and their analysis was done at National Test House, Ghaziabad. Results were then compared with national (IS10500, IS14543) and international (WHO, FDA, USEPA) standards.
Results: Bottled water showed better quality than sachet water. The mean value of copper (0.0746mg/l) in bottles exceeded the standard values of IS10500 and IS14543(0.05), while the mean value of lead (0.008mg/l) exceeded the FDA standard value (0.005). When the results of sachets were compared with those of standards, the mean values of selenium (0.1195mg/l) and lead (0.862mg/l) were found to exceed values of both Indian and International standards. For the biological parameter i.e. coliform count, the mean value for bottles was 0 (nil), whereas the mean value for sachets was 16.75, which showed the unhealthy nature of sachets.
Conclusion: The parameters which were tested in the present study showed excess of various chemical and bacterial parameters in drinking water, which could pose serious threats to consumers. Thus, these results suggest a more stringent standardization of bottled water market with special attention to quality, identity and licensing by concerned authorities, to safeguard health of consumers.
Introduction
Water is believed to be elixir of life. Humanity highly depends on water and its proper utilization and management. Although, water has various uses, perhaps its use as a thirst quenching fluid is the most significant one. An average man ( with 53kg-63kg body weight) requires about 3 litres of water in liquid and food daily to keep himself healthy. It is also a useful resource for domestic, industrial and agricultural purposes [1,2]. Although it is plentiful in nature, occupying 71% of the earth’s surface, only 1 % is accessible for human consumption. Thus, the quality of this 1 % drinking-water is a powerful environmental determinant of health, as it has an important impact on health of people. Water of poor quality can cause diseases like diarrhoea, typhoid, paratyphoid fever, bacillary and amoebic dysentery and it can contribute to varying rates of diseases which manifest themselves on different time scales [3,4]. According to World Health Organization (WHO), mortality caused by water associated diseases is more than 5 million per year [5]. Access to potable drinking water has improved over the last decades in almost every part of the world, but approximately one billion people still lack access to safe water and over 2.5 billion lack access to adequate sanitation [6]. Although the access to potable drinking water is increasing, the quality of drinking water has deteriorated, due to the presence of toxic elements, which even in trace quantities, can pose serious health issues. Besides the geochemical strata of ground water sources, this problem is mostly caused by the indiscriminate discharge of industrial effluents in the natural water bodies [7,8]. Perhaps, as a response to this challenge of providing safe drinking water, recent years have witnessed emergence and tremendous growth of bottled water industry [9]. Also, the ease of availability, convenience to carry, better taste, reasonable cost and freedom from impurities have made bottled water the choice of drinking water in most of developing and developed countries [8].
Bottled water is defined as water that is intended for human consumption and that is sealed in bottles or other containers, which has no added ingredients, except that it may optionally contain safe and suitable antimicrobial agents [10].
The global Bottled Water Industry has become a multibillion dollar industry. There has been a remarkable growth which has been trajectory for the sector. The usage of bottled water in the world is mainly in North America (30%), Europe (29%), Asia (27%), and other parts of the world (14%) and people from all over the world drink about 13x1010 litres of bottled water annually [11–14].
The brand giants of the global bottled water market include mainly Danone with Evian and Volvic, Nestlé with pure Life, Poland Spring, Perrier and San Pellegrino, Coca-Cola with Bonanqua and Kinley, Dasani and Ceil and PepsiCo with Aquafina, Aqua Minerale and Aqua Diamant [14].
In India, bottled water industry saw virtually no activity till 1993, when Bisleri was launched by Parley. But now, India is among the top ten countries in terms of bottled water consumption. Today, bottled water is one of India’s fastest growing industrial sectors. Further, for the low income population, packed water is also available in the form of relatively cheaper, hand sealed sachets [15].
The rise in the demand and availability of a large number of commercial brands of bottled water in the market have led to the prescription and enforcement of water standards which are prescribed for maximum permissible levels of different constituents, which vary from country to country. Thus, keeping in mind, consumer interests and public health, the Indian Union Ministry of Health and Family Welfare issued a notification on September 29, 2000, for all packaged water manufacturers and traders, according to which ISI certification from Bureau of Indian Standards was made mandatory [16]. Although many studies have been done on individual parameters like physico-chemical quality or bacterial quality, very few studies have been done on the collective quality assessments of bottled water and sachet water. Hence, due to the scanty literature which is available, the present study was done with the aim of evaluating the physical, chemical and microbial qualities of sachet water and bottled water which were sold in Delhi and of ascertaining compliance with specified International (WHO/FDA/USEPA) and Indian (BIS = IS10500 for bottled drinking water, IS14543 for drinking water) standards.
Method
Study area
Delhi, the national capital of India, which is situated at latitude: 28.38 N and longitude: 77.12 E, has a total population of 1.68 crores and a literacy rate of 86% as per census of 2011. The National Capital Territory (NCT) of Delhi, India, is a water scarce state with a deficit in the drinking water supply which is available for its residents Shekhar and Prasad [17]. The exploration, exploitation and unscientific management of ground water resources in the NCT of Delhi, India, have posed a serious threat of reduction in their quantity and deterioration of their quality (Adhikary et al., [18], thus leading to increased consumption of packaged drinking water.
Sampling
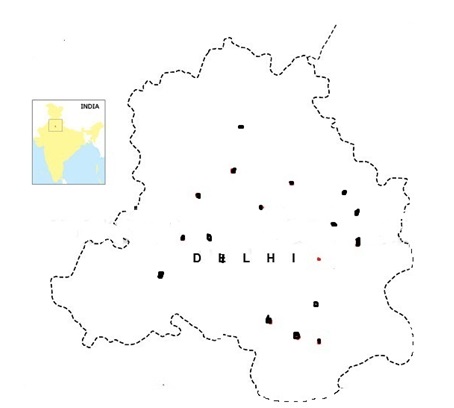
For study purposes, Delhi was geographically divided into 4 zones, namely, north, south, east and west. By using stratified random sampling, 16 bottles and 4 sachets were collected from 2nd to 6th June 2013, from various public and commercial places, from all the 4 zones [Table/Fig-1]. Samples were numbered from 1 to 16 and from 1 to 4 respectively. All the samples were contained in their original sealed containers and were transported in refrigerated conditions immediately to the National Test House, Ghaziabad,India for analyses. The analyst and the statistician were blinded to the study (double blinding). The analyses were done by using American Public Health Association (APHA 18th edition 1992) guidelines [19]. Analyses included physical and aggregate properties such as colour, odour, turbidity, total dissolved solids, total alkalinity and total hardness; major non-metallic, inorganic constituents such as pH, chloride, fluoride, and sulphate; major and trace metals including sodium (Na), potassium (K), calcium (Ca), magnesium (Mg), iron (Fe), zinc (Zn), arsenic (As), cadmium (Cd), chromium (Cr), cobalt (Co), copper (Cu), lead (Pb), manganese (Mn), molybdenum (B), nickel (Ni) and selenium (Se); as well as microbial parameters such as total coliforms. Analyses of Ca, Mg, Na, K, As, Cd, Cr, Co, Cu, Fe, Pb, Mn, Ni, Se, Zn, B were done by using Inductively Coupled Plasma Atomic Emission Spectroscopy (OPTIMA DV-2100) Perkin Elmer Precisely, analyses of F and CN were done by using Ion- Analyzer (ORION), analyses of Hg were done by using mercury analyzer, analyses of Cl and total alkalinity were done by titration, analyses of sulphate were done by using a gravimetric method, analyses of pH were done by using a pH meter and analyses of TDS were done by using a hot air oven. Calibration of the instruments was done prior to the analyses. ICP-AES was calibrated by preparing a 2% calibration blank (by adding 2% nitric acid). Then, 3 standards were run, which achieved a linear calibration graph and correction factor came between 0.9-1(0.9992).
Location Map of Study Area
Statistical Analysis
Statistics was done by using SPSS, version 19. Mean, standard deviation, skewness and kurtosis were calculated for all the parameters. Student’s t-test was used to compare parametric data and Mann-Whitney U-test was used to compare non-parametric data. Correlation was also assessed between different parameters.
Results
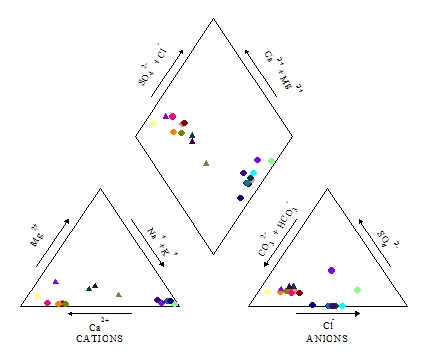
The physical characteristics of all the bottled and sachet water samples showed all the tested water samples were colourless and that they did not have objectionable odours and tastes. [Table/Fig-2 and 3] present the fundamental statistics of the chemical and bacteriological characteristics of bottled and sachet water samples respectively. Mercury, Cadmium, Cobalt, Nickel, Arsenic were absent (nil) in both bottles and sachets and thus they are not mentioned in the table. [Table/Fig-4] shows the comparison between various parameters of bottles and sachets for which the difference was statistically significant. The chemical characteristics of the water compositions in both bottles and sachets, on the basis of major ion concentrations, were evaluated on a Piper diagram [Table/Fig-5].
Fundamental statistical parameters of sachet water in Delhi
| Parameters | n | Minimum | Maximum | Mean | Std. Deviation | Skewness | Kurtosis |
|---|
| pH | 16 | 6.45 | 7.24 | 6.9288 | .2339 | -.791 | .038 |
| Total hardness as CaCo3mg/l | 16 | .875 | 129.84 | 22.4943 | 34.7399 | 2.177 | 5.592 |
| Iron mg/l | 16 | .00 | .04 | .0152 | .0101 | .375 | -.404 |
| Chloride mg/l | 16 | 12.4 | 28.50 | 17.081 | 4.5766 | 1.729 | 2.218 |
| Dissolved solids mg/l | 16 | 12.00 | 221.00 | 59.7500 | 53.3424 | 1.996 | 4.915 |
| Calcium mg/l | 16 | .1 | 47.3 | 8.33 | 12.98 | 2.004 | 4.664 |
| Copper mg/l | 16 | .034 | .098 | .0746 | .0221 | -.549 | -1.324 |
| Manganese mg/l | 16 | .014 | .074 | .05419 | .0181 | -1.247 | .699 |
| Sulphate mg/l | 16 | .0 | 41.2 | 8.909 | 11.5912 | 1.479 | 2.634 |
| Alkalinity mg/l | 16 | 7.000 | 122.000 | 29.1125 | 26.2298 | 3.297 | 12.043 |
| Magnesium mg/l | 16 | .10 | 2.78 | .3555 | .6520 | 3.887 | 15.344 |
| Selenium mg/l | 16 | .000 | .024 | .0075 | .0080 | .770 | -.419 |
| Lead mg/l | 16 | .000 | .058 | .0085 | .0164 | 2.513 | 5.799 |
| Zinc mg/l | 16 | .000 | .015 | .0048 | .0065 | .723 | -1.474 |
| Chromium mg/l | 16 | .000 | .016 | .0043 | .0060 | .968 | -.741 |
| Boron mg/l | 16 | .10 | 1.56 | .2619 | .3511 | 3.829 | 15.027 |
| Fluoride mg/l | 16 | .014 | .250 | .07869 | .0815 | 1.151 | -.166 |
| Sodium mg/l | 16 | 1.50 | 10.78 | 3.4781 | 2.0696 | 3.202 | 11.895 |
| Potassium mg/l | 16 | 1.21 | 6.51 | 4.9925 | 1.2432 | -2.006 | 5.404 |
| Aluminium mg/l | 16 | .000 | .002 | .0003 | .0006 | 1.890 | 3.035 |
| Coli form /bacteria/100ml | 16 | .0000 | .0000 | .0000 | .0000 | . | . |
Fundamental statistical parameters of sachet water in Delhi
| Parameters | N | Minimum | Maximum | Mean | Std. Deviation | Skewness | Kurtosis |
|---|
| pH | 4 | 5.53 | 6.61 | 6.2650 | .49534 | -1.869 | 3.613 |
| Total hardness as CaCo3mg/l | 4 | 6.405 | 22.048 | 11.60175 | 7.113607 | 1.757 | 3.179 |
| Iron mg/l | 4 | .028 | .040 | .03525 | .005252 | -1.165 | 1.085 |
| Chloride mg/l | 4 | 15.1 | 20.1 | 16.575 | 2.3684 | 1.910 | 3.677 |
| Dissolved solids mg/l | 4 | 68 | 115 | 94.00 | 21.556 | -.419 | -2.748 |
| Calcium mg/l | 4 | 1.99 | 6.76 | 3.5150 | 2.20842 | 1.769 | 3.140 |
| Copper mg/l | 4 | .0000 | .0000 | .0000 | .0000 | . | . |
| Manganese mg/l | 4 | .000 | .000 | .0000 | .0000 | . | . |
| Sulphate mg/l | 4 | 17.58 | 23.54 | 20.8775 | 2.60436 | -.560 | -1.022 |
| Alkalinity mg/l | 4 | 84.100 | 100.00 | 89.775 | 7.2940 | 1.336 | 1.206 |
| Magnesium mg/l | 4 | .33 | 1.23 | .6625 | .3917 | 1.584 | 2.973 |
| Selenium mg/l | 4 | .008 | .320 | .1195 | .1388 | 1.576 | 2.587 |
| Lead mg/l | 4 | .03 | 3.29 | .8628 | 1.6183 | 1.999 | 3.996 |
| Zinc mg/l | 4 | .000 | .000 | .000\ | .000 | . | . |
| Chromium mg/l | 4 | .000 | .000 | .000 | .000 | . | . |
| Boron mg/l | 4 | .28 | .54 | .3600 | .1232 | 1.708 | 2.830 |
| Fluoride mg/l | 4 | .06 | 0.70 | .2982 | .2879 | 1.290 | 1.116 |
| Sodium mg/l | 4 | 1.0 | 3.5 | 2.075 | 1.0436 | .956 | 1.855 |
| Potassium mg/l | 4 | .40 | 1.20 | .6825 | .3538 | 1.695 | 3.188 |
| Aluminium mg/l | 4 | 000 | .000 | .000 | | | |
| Coli form /bacteria/100ml | 4 | 10.00 | 25.000 | 16.7500 | 6.9940 | .353 | -3.290 |
Comparison of Bottled Water with Sachet Water
| Parameters | Level of Significance(p-value) |
|---|
| pH | .001 |
| Total hardness as CaCo3 mg/l | 0.494 |
| Iron mg/l | .001 |
| Chloride mg/l | .838 |
| Dissolved solids mg/l | 0.064 |
| Calcium mg/l | 0.494 |
| Copper mg/l | 0.000 |
| Manganese mg/l | 0.000 |
| Sulphate mg/l | 0.005 |
| Alkalinity mg/l | 0.005 |
| Magnesium mg/l | 0.385 |
| Selenium mg/l | 0.003 |
| Lead mg/l | 0.033 |
| Boron mg/l | 0.595 |
| Fluoride mg/l | 0.011 |
| Sodium mg/l | 0.122 |
| Potassium mg/l | 0.000 |
| Coli form bacteria /100ml | 0.000 |
The results of the present samples were also compared with various Indian and international standards [Table/Fig-6]. The standards included IS10500 (1991) Indian standard for packaged Bottled drinking water; IS14543 (2004) Indian standard for drinking water; WHO (2006) standards for drinking water; United States Food and Drug Administration (US FDA 2008) standard for packaged bottled drinking water and United States Environmental Protection Agency (US EPA) 2007 standards for drinking water. A correlation matrix of the bottles and sachets showed a significant positive correlation between various elements, as has been given in [Table/Fig-7,8].
WHO, FDA, USEPA and Indian Standards( IS-10500, IS14543) of Drinking Water
| S.No | Tests | IS-10500:1991 | IS-14543:2004 | Who(2006) Drinking Water | FDA(2008) Bottled Water | US-EPA (2007) |
|---|
| 1 | Color Hazen Units | 5 | 2 | - | - | 5 |
| 2 | Odour | Unobjectionable | Unobjectionable | - | - | - |
| 3 | Turbidity | 5 | 2 | - | 5 | 0.5NTU |
| 4 | pH | 6.5-8.5 | 6.5-8.5 | 6.5-9.5 | - | 6.5-8.5 |
| 5 | Total hardness as CaCo3,mg/l | 300 | | 500 | - | - |
| 6 | IRON as Fe, mg/l | 0.30 | 0.1 | - | 0.3 | 0.3 |
| 7 | Chloride as Cl, mg/l | 250 | 200 | 250 | 250 | 250 |
| 8 | Total Dissolved Solids, mg/l | 500 | 500 | - | 500 | 500 |
| 9 | Calcium as Ca, mg/l | 75 | 75 | - | - | - |
| 10 | Copper as Cu, mg/l | 0.05 | 0.05 | 2 | 1 | 1 |
| 11 | Manganese as Mn, mg/l | 0.1 | 0.1 | 0.05 | 0.05 | 0.05 |
| 12 | Sulphate as SO4, mg/l | 14.35 | 200 | - | 250 | 250 |
| 13 | Alkalinity mg/l | 200 | 200 | - | - | - |
| 14 | Magnesium as Mg, mg/l | 30 | 30 | - | - | - |
| 15 | Mercury as Hg, mg/l | 0.001 | 0.001 | - | 0.002 | 0.002 |
| 16 | Cadmium as Cd, mg/l | 0.01 | 0.01 | 3ug/l | 0.005 | 0.005 |
| 17 | Selenium as Se, mg/l | 0.01 | 0.01 | 0.01 | 0.05 | 0.05 |
| 18 | Arsenic as As, mg/l | 0.01 | 0.05 | 0.01 | 0.01 | 0.01 |
| 19 | Lead as Pb, mg/l | 0.05 | 0.01 | 0.01 | 0.005 | 0.015 |
| 20 | Zinc as Zn, mg/l | 5 | 5 | 3 | 5 | 5 |
| 21 | Chromium as (Cr6), mg/l | 0.05 | 0.05 | 0.05 | 0.1 | 0.1 |
| 22 | Boron as B, mg/l | 1 | 5 | - | - | - |
| 23 | Fluoride, mg/l | 1.0 | 1.0 | 1.5 | 0.8-2.4 | 4 |
| 24 | Nickel as Ni, mg/l | - | 0.02 | 0.07 | 0.1 | - |
| 25 | Sodium as Na, mg/l | - | 200 | - | - | - |
| 26 | Potassium as K, mg/l | - | - | - | - | - |
| 27 | Cobalt as Co, mg/l | - | - | - | - | - |
| 28 | Aluminium as Al , mg/l | 0.03 | 0.03 | - | 0.2 | 0.2 |
| 29 | Coli form bacteria/100ml | 0 | - | 0 | <2.2 | - |
Correlation matrix for water quality parameters in the bottled drinking water brands
| Total hardness CaCo3mg/l | Dissolved solids mg /l | Calcium mg/l | Sulphate mg/l | Alkalinity mg/l | Magnesium mg/l | Sodium mg/l |
|---|
| Total hardness as CaCo3mg/l | 1 | | | | | | |
| Dissolved solids mg/l r | .986 | 1 | | | | | |
| Calcium mg/l r | .999 | .986 | 1 | | | | |
| Sulphate mg/l r | .935 | .935 | .937 | 1 | | | |
| Alkalinity mg/l r | .904 | .870 | .890 | .815 | 1 | | |
| Magnesium mg/l r | .883 | .865 | .864 | .795 | .957 | 1 | |
| Sodium mg/l r | -.094 | -.078 | -.099 | -.054 | -.142 | -.014 | 1 |
Correlation matrix for water quality parameters in the drinking water sachet brands
| Numbers | Total hardness as CaCo3mg/l | Iron mg/l | Chloride mg/l | Dissolved solids mg/l | Calcium mg/l | Sulphate mg/l | Alkalinity mg/l | Magnesium mg/l | Selenium mg/l | Fluoride mg/l |
|---|
| totalhardnessasCaCo3mg/l r | 1 | | | | | | | | | |
| Iron mg/l | r | .444 | 1 | | | | | | | |
| Chloride mg/l r | -.194 | -.155 | 1 | | | | | | | |
| Dissolved solids mg/l | r | .791 | .589 | .366 | 1 | | | | | |
| Calcium mg/l | r | .999 | .408 | -.178 | .787 | 1 | | | | |
| Sulphate mg/l r | .815 | .669 | .272 | .993 | .807 | 1 | | | | |
| Alkalinity mg/l r | .974 | .311 | -.003 | .833 | .981 | .832 | 1 | | | |
| Magnesium mg/l r | .991 | .554 | -.245 | .793 | .984 | .831 | .940 | 1 | | |
| Selenium mg/l r | -.282 | .720 | -.192 | -.071 | -.322 | .009 | -.435 | -.152 | 1 | |
| Fluoride mg/l r | -.485 | .307 | -.588 | -.589 | -.516 | -.501 | -.669 | -.378 | .802 | 1 |
Discussion
The present study showed significant difference in the physical, chemical and bacterial parameters between bottles and sachets. Various studies done by A Baba et al., [20], Semerjian L [10], Onweluzo and Akuagbazie [1] and Miranzadeh et al., [4] 114 have shown that qualities of the bottled water in different countries were within acceptable range. But due to influx of a large number of local brands and administrative ignorance, the physical, chemical and bacteriological quality parameters of packaged water sources have not been found to be in the acceptable limits, in the studies which were conducted by Gargil R [11], Oyelude and Ahenkorah [21], Ackah M et al., [22] and Kwakye-Nuako et al., [23].
In the present study, when bottled water was compared with the various national and international standards, most of the chemical parameters were found to be within the levels which were set by these standards, except lead and copper. Lead is a neurotoxin heavy metal which is responsible for the most common type of human metal toxicosis and it is known to turn up in drinking water. In this study, the mean value of lead was found to be more than the FDA standard value, which was in agreement with findings of the study done by Salam et al., [24] Contrary results were found in the studies done by Soylak M et al., [25], Akpoborie and Ehwarimo [26], Babaji et al., [27], Saeed et al., [28] and Baba et al., [20], in which the lead levels were lesser than the standard values. There was only a marginal increase in the mean value of copper in bottled water as compared to the Indian standards. Copper is an essential nutrient which is necessary for haematopoiesis and for the structure and functioning of the nervous system. In Delhi, this can be attributed to the industrial waste which is generated in and around Delhi, which contaminates ground as well as surface water. The complex situations of ground water occurrences in different formations, presence of saline ground water at varying depths in the aquifiers and growing urbanization influence availability and quality of water in different parts of National Capital Territory of Delhi, which could have been used as raw water by bottling units [29].
In the present study, the quality of bottled water was compared with that of sachet water, as was done in the studies of Onweluzo and Akuagbazie [1] Akpoborie and Ehwarimo [26]. In sachet water samples, lead and selenium were found in excess as compared to the standard values. Contrary results were found in the study done by Babaji et al., [27]. Selenium is a caries potentiating element and its increase can be attributed to the industrial waste which pollutes both the ground and surface water [27,30]. Microbial evaluation of all water samples revealed high levels of total coliform bacteria in the sachets but not in the bottles. Similar results were found in studies done by Gangil R et al., [11], Majumder AK et al., [31], Semerjian [10], Urvashi et al., [32], Zeenat et al., [33] and Ajayi AA [34]. The microbial contamination of packaged drinking water could be influenced by factors such as their raw water sources, treatment processes which were employed and hygienic practices which were observed in their productions. Most of the sachet water manufacturers were observed to utilize well water, contaminated boreholes and municipal tap water as raw water sources. Well water is usually contaminated by surface waters, especially during the rainy season and inadequate attention is paid to the environmental sanitary qualities of these wells. Wild animals and birds may also constitute natural sources of zoonotic pathogens, thus contaminating surface and well water [11].
One of the limitations of this study was less numbers of bottles as well as sachets. Also, the unequal number of sachets (4) and bottles (16) which were used in the present study could have led to the differences between the values of different parameters in bottled water and sachet water.
Conclusion
Bottled water industry is booming at a high speed. Physico-chemical and bacterial parameters which were tested in the present study showed significant differences between various parameters in both bottles and sachets. Results also showed that quality of bottled water was better than that of sachets. All the bottled water samples showed negative growth for total coliforms, while sachet samples had positive total coliform counts which showed that they were unfit for consumption. Thus, keeping in mind the rising demand of packaged drinking water, it becomes important for the authorities to monitor its quality control and be licensed by concerned authorities, to safeguard consumer’s health. In addition, cohort-epidemiological studies are recommended in this area, in order to establish the presence or absence of the health related problems that have been linked to the quality of packaged drinking water.
[1]. Onweluzo JC, Akuagbazie CA, Assessment of the quality of bottled and sachet water Sold in Nsukka townAgro- science J. Trop. Agric. Food Environ and Exten 2010 9(2):104-10. [Google Scholar]
[2]. Versari AGP, Galassi S, Chemometric survey of Italian bottled mineral waters by means of their labeled physico-chemical and chemical compositionJ Food Com. Anal 2002 15:251-64. [Google Scholar]
[3]. Taiwo AM, Gbadebo AM, Awomeso JA, Potability Assessment of Selected Brands of Bottled Water in Abeokuta, NigeriaJ. Appl. Sci. Environ. Manage 2010 14(3):47-52. [Google Scholar]
[4]. Miranzadeh BM, Ehsanifar M, Iranshahi L, Evaluation of Bacterial Quality and Trace Elements Concentrations in 25 Brands of Iranian Bottled Drinking Water. American-EurasianJ. Agric. and Environ. Sci 2011 11(3):341-5. [Google Scholar]
[5]. World Health Organization. Water quality and health strategy. 2013-2020.2013;1-2 [Google Scholar]
[6]. Cabral JPS, Water Microbiology: Bacterial Pathogens and WaterInt. J. Environ. Res. Public Health 2010 7:3657-703. [Google Scholar]
[7]. Ikem AS, Egierbro O, Nyavor K, Chemical quality of bottled waters from three cities in eastern AlbamaSci Total Environ 2002 285:165-75. [Google Scholar]
[8]. Nickson RT, McArther JM, Shrestha B, Kyaw-Mint TO, Lowery D, Arsenic and other drinking water quality issues, Muzaffarnagar district PakistanApp. Geo chem 2005 20:55-68. [Google Scholar]
[9]. Gleick PH, Cooley HS, Energy implications of bottled waterEnviron. Res. Lett 2009 4:1-6. [Google Scholar]
[10]. Semerjian L, Quality assessment of various bottled waters marketed in LebanonEnviron Monit Assess 2011 172:275-85. [Google Scholar]
[11]. Gangil R, Tripathi R, Patyal A, Dutta P, Mathur K.N., Bacteriological evaluation of packaged bottled water sold at Jaipur city and its public health significanceVet World 2013 6(1):27-30. [Google Scholar]
[12]. Khatoon A, Pirzada AZ, Bacteriological quality of bottled water brands in Karachi, PakistanBiologia 2010 56(1, 2):137-43. [Google Scholar]
[13]. Raj SD, Bottled water: how safe is it?Water Environ. Res 2005 77:3013-18. [Google Scholar]
[14]. Rani B, Maheshwari R, Prasad M, Bottled Water – A Global Market OverviewBull. Environ. Pharmacol. Life Sci 2012 1(6):01-04. [Google Scholar]
[15]. The Indian bottled water market: unveiling its thirstIKON Marketing Consultants India 2012 :1-87. [Google Scholar]
[16]. Mathur HB, Johnson S, Mishra R, Kumar A, Singh B, Analysis of pesticide residues in bottled water (Delhi region). New DelhiCenter for Science and Environment 2003 :1-51. [Google Scholar]
[17]. Shekhar S, Prasad RK, The groundwater quality in the Yamuna flood plain of Delhi (India) and the management optionsHydrogeology J 2009 17:1557-60. [Google Scholar]
[18]. Adhikary PP, Chandrasekharan H, Chakraborty D, Kamble K, Assessment of groundwater pollution in West Delhi, India using geostatistical approachEnviron Monit Assess 2010 167(1-4):599-61. [Google Scholar]
[19]. APHAStandard methods for the examination of water and waste water. In A.E.Greenberg, L.S Clesceri, A.D.Eaton (Eds.)U.S American Public Health Association 1992 18th edWashington D.C.American Water Works Association and Water Pollution Control Federation:1-13. [Google Scholar]
[20]. Baba A, Erees FS, Hıçsönmez U, Çam S, Özdılek HG, An assessment of the quality of various bottled mineral water marketed in TurkeyEnviron Monit Assess 2008 139:277-85. [Google Scholar]
[21]. Oyelude E, Ahenkorah S, Quality of Sachet Water and Bottled Water in Bolgatanga Municipality of GhanaRes. J. Appl. Sci. Eng. Technol 2012 4(9):1094-8. [Google Scholar]
[22]. Ackah M, Anim AK, Gyamfi ET, Acquah J, Nyarko ES, Assessment of the quality of sachet water consumed in urban townships of Ghana using physico-chemical indicators: A preliminary studyAdv. Appl. Sci. Res 2012 3(4):2120-7. [Google Scholar]
[23]. Kwakye-Nuako G, Borketey PB, Mensah-Attipoe I, Asmah RH, Ayeh-Kumi PF, Sachet Drinking Water In Accra: The Potential Threats Of Transmission Of Enteric Pathogenic Protozoan OrganismsGhana Med J 2007 41(2):62-7. [Google Scholar]
[24]. Salam M, Engy MA, Ghitany E, Kassem M, Quality of Bottled Water Brands in EgyptJ Egypt Public Health Assoc 2008 83(5,6):369-485. [Google Scholar]
[25]. Soylak M, Armagan Aydin F, Saracoglu S, Elci L, Dogan M, Chemical Analysis of Drinking Water Samples from Yozgat, TurkeyPol J Environ Stud 2002 11(2):151-6. [Google Scholar]
[26]. Akpoborie AI, Ehwarimo A, Quality of packaged drinking water produced in Warri Metropolis and potential implications for public healthJ. Environ. Chem. Ecotoxicol 2012 4(11):195-202. [Google Scholar]
[27]. Babaji I, Shashikiran NN, Reddy VV, comparative evaluation of trace elements and residual bacterial content of different brands of bottled watersJ Indian Soc Prev Dent 2004 22(4):201-4. [Google Scholar]
[28]. Saeed A, Kauser S, Kalim I, Iqbal M, Chemical quality assessment of major brands of bottled water in LahoreWorld Water Day 2010 :51-60. [Google Scholar]
[29]. Chatterjee R, Gupta BK, Mohiddin SK, Singh PN, Shekhar S, Purohit RR, Dynamic groundwater resources of National Capital Territory, Delhi: assessment, development and management optionsEnviron. Earth Sci 2009 59(3):669-87. [Google Scholar]
[30]. Oklo AD, Sha’Ato R, Asemave K, Mkurzurum C, Selenium Content in some Brands of Bottled Beer Marketed in Makurdi Town Benue State, NigeriaInt. J. Sci. Res 2013 2(3):457-9. [Google Scholar]
[31]. Majumder AK, Islam KMN, Nite RN, Noor R, Evaluation of Microbiological Quality of Commercially Available Bottled Water in the City of Dhaka, BangladeshS. J Microbiol 2011 1(1):24-30. [Google Scholar]
[32]. Uravashi Dukwal V, Goyal M, Purohit SK, Physical, chemical and microbiological analysis of bottled waterJ. Vet. Publ. Hlth 2004 2:67-9. [Google Scholar]
[33]. Zeenat A, Hatha AA, Viola L, Vipra K, Bacteriological quality and risk assessment of the imported and domestic bottled mineral water sold in FijiJ Water Health 2009 7(4):642-9. [Google Scholar]
[34]. Ajayi AA, Sridhar MKC, Adekunle LV, Oluwande PA, Quality of packaged waters sold in Ibadan, NigeriaAfr. J. Biomed. Res 2008 11(3):251-8. [Google Scholar]