Dental caries affects most adults in the world and is the most common chronic disease of children [1]. Although the caries has affected humans since pre historical times, the prevalence of this disease has greatly increased in modern times on a worldwide basis and the increase is strongly associated with dietary change [2].
The earliest evidence of this disease can remain hidden until there has been some surface damage to a tooth crown and it becomes visible to the naked eye as a white spot lesion. However it has now been shown clearly that the disease progresses reasonably slowly in the early stages. In fact, it can be controlled or even eliminated before surface cavitation. Recognition of the initiation and early establishment of caries should be the primary concern of the dentist rather than the search for cavities. For the diagnosis of approximal carious lesions in posterior teeth bitewing radiographs are considered a valuable tool. Diagnostic criteria for approximal lesions can be precisely applied to radiographic examination than to clinical examination [3]. Radiation protection emphasizes the need to minimize any radiation dose to patients during radiographic examination. In dentistry this may be achieved by using fastest fim [4].
Studies have shown that depletion of processing solutions have an adverse effect on the speed of films and many dentists however retain processing solutions for much longer periods; on the other hand they do not process large number of films. Some dentists also over expose radiographs to compensate for the loss of density due to outdated processing solutions [5].
So this study was carried out to obtain additional information on the diagnostic performance of the three different films in fresh processing solution and to evaluate the effects of developer depletion on the diagnostic performance of these films. The study also aimed at comparing the histological score of proximal caries with conventional film radiography taken by Kodak D, E and Agfa Comfort M2 films.
Methods
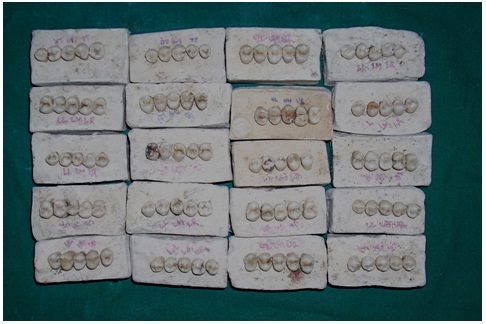
This study was conducted in the Department of oral medicine and radiology, college of dental sciences, Davangere from January to December 2009. A Total of 100 extracted unrestored permanent premolars (50 maxillary and 50 mandibular premolars) were collected and preserved in formalin. The teeth were mounted in plaster of Paris as close as possible to each other. Three teeth in middle of each block were used in the study, the teeth at either end served to create natural contact points, i.e. only 60 (30 maxillary and 30 mandibular) teeth were utilized. In total, 20 plaster blocks (10 sets) for 100 teeth were constructed. For each radiograph two blocks were used simulating bitewing radiograph. Radiographs were taken using Kodak Ultraspeed, Kodak Ektaspeed and Agfa Dentus M2 comfort film. The exposure was made by Gendex at 65kVp and 7.5 mA. Standardized exposure time was determined for each film.
Inclusion Criteria
Unrestored extracted human premolars.
Exclusion criteria
Teeth with damaged surfaces.
Restored teeth.
Fractured teeth.
To evaluate the appropriate exposure times for each film
Two plaster models were constructed with 5 teeth in each plaster model. To obtain appropriate exposure time for each film these two plaster models were exposed over wide time range (0.1, 0.2, 0.32, 0.4 , 0.5 seconds) with each film type (Kodak D, E and Agfa Dentus M2 comfort) while keeping other exposure parameters same for all types of film. Then exposed films were processed using standardized processing conditions.
The optical density of all processed films of three types was measured using spectrophotometer at a wavelength of 450nm. The density of each film was measured at five different points (a,b,c,d,e) and mean optical density was calculated. For the standardization, the exposure time that resulted in optical density of two as recommended by ISO 5799-1991 was selected for each film [6]. For all models of teeth, the resulting time for the evaluated radiographs were 0.32 sec for both Kodak E speed and Agfa Dentus comfort M2 film and 0.5 sec for Kodak Ultraspeed film.
Contrast values corresponding to exposure time of 0.1, 0.2, 0.32, 0.4, 0.5 seconds were calculated using the formula C = D1- D2, where D1- Density of extreme black area and D2- Density of extreme light area. Total of 5 contrast values were obtained.
Log relative exposure at 0.1, 0.2, 0.32, 0.4, 0.5 seconds were calculated using the formula, Exposure= kVp x time. These values were used to plot a curve against optical density.
Standardization
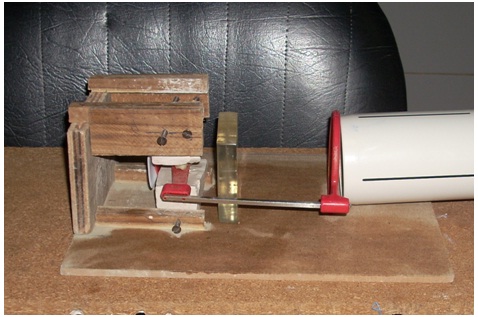
An optical bench consisting of XCP film holder was mounted on a platform [Table/Fig-1]. All 60 teeth in 20 plaster models [Table/Fig-2] were exposed with Gendex intraoral radiographic machine at 65 kVp and 7.5 mA in such a way that the central ray passed perpendicularly, through the interdental spaces of these teeth mounted on plaster models with focal spot to film distance of about 30 cm [7]. As stated by Ralf Kurt et al., acrylic block [8]. which was about 12 mm thick was placed between cone end and plaster blocks to stimulate soft tissue. Exposure time was standardized at 0.32 sec for both Kodak E speed and Agfa Dentus M2 comfort film and 0.5 sec for Ultraspeed film. The teeth were then radiographed using three films. The procedure was repeated every week with 30 radiographs each week for 6 weeks. So each week 30 radiographs were processed with total of 210 radiographs at the end of 6 weeks. Uniform temperature of the processing solution was maintained throughout the study by placing ice cubes and by adding hot water surrounding developing tanks. Developing time was 3 minutes for all 210 radiographs. After development, films were placed in running water for 50 seconds. This was followed by placing the films in fixer for 4 minutes. After fixation was complete, films were placed in running water for 10 minutes. After films were washed, surface moisture was removed by gently shaking excess water. Films were then dried by placing in drying wracks.
Optical Bench with Positioning Ring
Teeth Mounted in Plaster of Paris
Interpretation of radiographs
As suggested by Syriopoulos K et al., [7] the processed radiographs were mounted in frames in such a way that the identification of three films was completely covered. An observer from the Department of Oral Medicine and Radiology examined all 210 radiographs in random order using viewing box with the help of magnifying lens. Interpretation of radiographs was done on the next day of processing. Observer was asked to detect caries in the approximal surface. As suggested by Syriopoulos K et al., only distal surfaces were assessed in each model.
As suggested by Syriopoulos K et al., the following four points scale was used for radiographic assessment.
0-Sound enamel.
1-Enamel lesion.
2-Lesion in amelodentinal junction.
3- Dentinal lesion.
To avoid observer fatigue one viewing session was limited to 30 minutes. Different codes were assigned for each tooth in each set (e.g. 1UL for upper left tooth in first model 1LL for lower left tooth in the first set) and for each film (A for Agfa, E for Kodak E speed, U for Kodak Ultraspeed). The same observer interpreted the radiographs taken at the end of second week and similarly at the end of every subsequent week for a period of 6 weeks. Then teeth were subjected for histological study preparing ground sections at about 300 microns at the level of proximal caries and extent of caries was recorded as Gold standard. Histological readings were subtracted from the readings given by the observer and estimation error was calculated.
As suggested by Syriopoulos K et al., positive value of estimation error indicated that lesion was overestimated where as negative value indicated that lesion was underestimated. Estimation error score of 0 indicated that value given by the observer and histological examination were same. For instance, if the histological examination revealed sound surface (score 0) and the diagnosis of the observer was enamel lesion (score 1), the subtraction resulted in the estimation error score of +1 (overestimation). In a similar manner, the observer’s diagnosis of an actual dentinal lesion (score 3) as an enamel lesion (score 1) yielded an estimation error score of -2 (underestimation). The radiographic examination of enamel lesions and lesions reaching the ADJ could result in underestimating (negative values) or overestimating (positive values) the actual depth of the lesion. The radiographic examination of dentinal lesions could only yielded underestimation, since there were no deeper lesions. On the other hand radiographic examination of sound surfaces could only yield overestimation, since only possible error was diagnosing a sound surface as a carious one. All the results were tabulated for statistical analysis.
Results
Mean Optical Density: Pairwise comparison of three films by paired t-test showed that there was significant difference between the optical density of Ultraspeed and E speed films with p-value 0.0408, whereas on pairwise comparison between E speed and Agfa films p-value was not significant (0.0703). Pair wise comparison of Ultraspeed and Agfa films was also not significant (p 0.9483) [Table/Fig-3].
Comparison of three films with respect to optical density
| Film | Mean | S.D |
|---|
| D | 2.0260 | 0.2446 |
| E | 1.4000 | 0.4996 |
| A | 1.9560 | 0.2639 |
| f-value | 4.6551 |
| p-value | 0.0319 |
| Significance | S |
| Pair wise comparison of films by t-test |
| E - D | p = 0.0408, S |
| E - A | p = 0.0703, NS |
| D - A | p = 0.9483, NS |
Ultraspeed, E- Ektaspeed, A - Agfa Dentus M2 Comfort film
Log Relative Exposure: Log relative exposure for 0.1, 0.2, 0.32, 0.4 and 0.5 seconds were calculated by using the formula, Exposure = kVp x time.
Then curve was plotted with log relative exposure in the x-axis and the optical density in the y-axis. This graph showed at optical density of 2, D speed film needed more exposure compared to E speed and Agfa film [Table/Fig-4].
Log relative exposure and optical density
| Exposure (seconds) | Log Relative Exposure | Optical Density |
|---|
| D | E | A |
|---|
| 0.1 | 6.5 | 0.87 | 1.66 | 1.52 |
| 0.2 | 13 | 1.05 | 1.98 | 1.92 |
| 0.32 | 21 | 1.24 | 2.03 | 2.03 |
| 0.4 | 26 | 1.80 | 2.13 | 2.12 |
| 0.5 | 32.5 | 2.04 | 2.33 | 2.19 |
D - Ultraspeed, E- Ektaspeed, A - Agfa Dentus M2 Comfort film
Comparison of estimation error for D-speed, E-speed and Agfa films at 0,1st, 2nd, 3rd, 4th, 5th and 6th weeks: [Table/Fig-5,6,78].
Comparison of 0, 1st, 2nd, 3rd, 4th, 5th and 6th week estimation error In D-Speed film type
| Age (week) | Mean | SD | Mean Diff. | SD Diff | Paired t-value | p-value | Signi |
|---|
| 0wk | -0.10 | 0.99 | 0.00 | 0.94 | 0.0000 | 1.0000 | NS |
| 1wk | -0.10 | 1.10 |
| 0wk | -0.10 | 0.99 | 0.02 | 0.72 | 0.1782 | 0.8592 | NS |
| 2wk | -0.12 | 1.08 |
| 0wk | -0.10 | 0.99 | 0.20 | 0.82 | 1.8910 | 0.0635 | NS |
| 3wk | -0.30 | 1.00 |
| 0wk | -0.10 | 0.99 | 0.18 | 0.87 | 1.6264 | 0.1092 | NS |
| 4wk | -0.28 | 0.94 |
| 0wk | -0.10 | 0.99 | 0.28 | 0.80 | 2.7281 | 0.0084 | S |
| 5wk | -0.38 | 0.98 |
| 0wk | -0.10 | 0.99 | 0.27 | 0.94 | 2.2059 | 0.0313 | S |
| 6wk | -0.37 | 1.12 |
Ns: Not Significant,S: Significant
Comparison of 0, 1st, 2nd, 3rd, 4th, 5th and 6th week estimation error In E-Speed film type
| Age (week) | Mean | SD | Mean Diff. | SD Diff | Paired t-value | p-value | Signi |
|---|
| 0wk | 0.03 | 1.02 | -0.03 | 1.01 | -0.2562 | 0.7987 | NS |
| 1wk | 0.07 | 0.99 |
| 0wk | 0.03 | 1.02 | 0.17 | 1.08 | 1.1996 | 0.2351 | NS |
| 2wk | -0.13 | 0.98 |
| 0wk | 0.03 | 1.02 | 0.43 | 0.93 | 3.6197 | 0.0006 | S |
| 3wk | -0.40 | 0.99 |
| 0wk | 0.03 | 1.02 | 0.30 | 1.01 | 2.2929 | 0.0254 | S |
| 4wk | -0.27 | 0.94 |
| 0wk | 0.03 | 1.02 | 0.48 | 0.87 | 4.2877 | 0.0001 | S |
| 5wk | -0.45 | 0.98 |
| 0wk | 0.03 | 1.02 | 0.52 | 0.93 | 4.3052 | 0.0001 | S |
| 6wk | -0.48 | 0.95 |
Ns: Not Significant,S: Significant
Comparison of 0, 1st, 2nd, 3rd, 4th, 5th and 6th week estimation error in Agfa film type
| Age (week) | Mean | SD | Mean Diff. | SD Diff | Paired t-value | p-value | Signi |
|---|
| 0wk | 0.02 | 1.10 | -0.03 | 1.22 | -0.2115 | 0.8332 | NS |
| 1wk | 0.05 | 1.32 |
| 0wk | 0.02 | 1.10 | 0.07 | 1.21 | 0.4284 | 0.6699 | NS |
| 2wk | -0.05 | 1.13 |
| 0wk | 0.02 | 1.10 | 0.17 | 1.08 | 1.1996 | 0.2351 | S |
| 3wk | -0.15 | 1.02 |
| 0wk | 0.02 | 1.10 | 0.18 | 0.97 | 1.4711 | 0.1466 | S |
| 4wk | -0.17 | 1.06 |
| 0wk | 0.02 | 1.10 | 0.43 | 1.24 | 2.7067 | 0.0089 | S |
| 5wk | -0.42 | 1.33 |
| 0wk | 0.02 | 1.10 | 0.50 | 1.08 | 3.5814 | 0.0007 | S |
| 6wk | -0.48 | 0.91 |
Ns: Not Significant,S: Significant
Average estimation error per film type per week
Ns: Not Significant,S: Significant
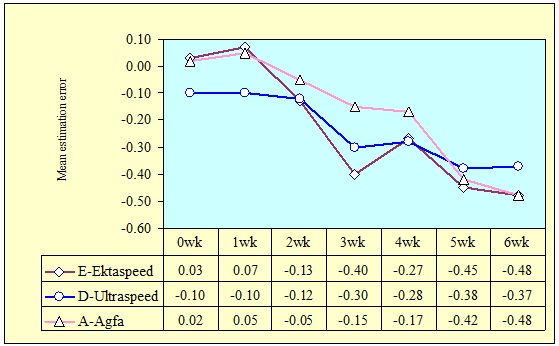
On an average the lesions in E-speed and Agfa films were both underestimated as well as overestimated whereas lesions in D-speed film were only underestimated.
Discussion
Although radiographic films are increasingly being replaced by digital systems, intraoral radiographic imaging systems are still used for the purpose of carious lesion detection. The main aim in radiology is the production of image with sufficient detail to reveal significant diagnostic information while keeping the radiation dose as low as reasonably achievable [9]. Ideal X-ray film for use in day to day dental practice should be fast but should produce a highly consistent image quality irrespective of the processing conditions [10].
On pairwise comparison of three films significant difference in densities were present when Ektaspeed and Ultraspeed films were compared. This difference was because of higher density of Ultraspeed film. Comparison between E-speed and Agfa as well as between D-speed and Agfa films were not significant. Findings of this study suggest that Ultraspeed had better density compared to Ektaspeed and Agfa film. These observations were correlating with other study where a comparative study was conducted for sensitometric evaluation of F speed film with Ektaspeed Plus and Ultraspeed which showed that density reduces with increasing speed of the film [11].
Ultraspeed required more exposure compared to E speed and Agfa film. This finding in the study was correlating with the study where characteristic curves of the dental X-ray films, Ultra speed, Ekta-speed, Deflux Dentus and Phil- X30, all of which were used in Finland and the absorption of radiation in the films with their protective wrappers were determined at the X-ray laboratory of the institute of Radiation Protection. The Ekta-Speed was about twice as sensitive as Ultraspeed film at a net optical density of 1.0. Deflux was about 30% sensitive than Ultraspeed while Phil X30 was about 20% more sensitive than Ultraspeed film. This study showed that Ekta speed was twice as fast as Ultraspeed with slightly lower contrast [12]. In our study Kodak E speed film was most sensitive film whereas Ultraspeed and Agfa films were relatively less sensitive for the changes in the developing solution. The findings of this study with respect to Ultraspeed film was correlating with other study where the diagnostic performance of Ultraspeed, Ektaspeed Plus and Agfa Dentus M2 comfort film was compared in fresh as well as aged processing solution, in which it was found that Ultraspeed was least sensitive film.
Conclusion
Kodak Ultraspeed, Ektaspeed and Agfa Dentus M2 Comfort films had similar diagnostic accuracy in fresh solution but in progressively depleted processing solution Ektaspeed film was inferior compared to other two films. As far as the diagnosis of approximal caries is considered processing solution should not be used longer than 3 weeks. Considering the significant reduction in patient radiation exposure with Ektaspeed film, this should be the film of choice whenever possible. Further evaluation is needed for any modification in the composition of processing solution or any other method to prevent the oxidation of developer solution which would increase the lifespan of the solution as well as the diagnostic accuracy, even when the films are processed in aged solution.
Ultraspeed, E- Ektaspeed, A - Agfa Dentus M2 Comfort film
D - Ultraspeed, E- Ektaspeed, A - Agfa Dentus M2 Comfort film
Ns: Not Significant,S: Significant
Ns: Not Significant,S: Significant
Ns: Not Significant,S: Significant