Predictable three-dimensional control of the teeth during the orthodontic treatment is essential to avoid any adverse effects on the dentition and the adjoining tissues due to the applied orthodontic force. Though the control of the teeth is required from day one of the therapy, it is most critical during retraction. Extra oral forces have probably been the only comfort factor to provide satisfactory control, but it has huge dependency on patient’s compliance, which can set back the whole concept of control over the treatment. Other issues being able, to achieve true intrusion and torque control of the anteriors and majorly, the tipping of the molars.
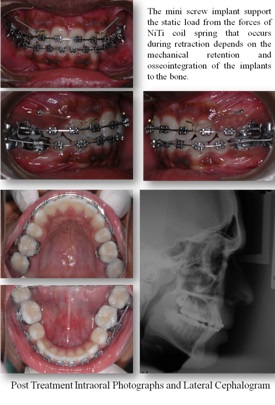
Mini-implants and micro-implants have changed the face of orthodontics today. They have increased the scope of orthodontics and encroached into the surgical zone, that is, what was considered impossible in orthodontics, is quite a possibility now, with the usage of implants. Implants have gained popularity in all the treatment phases, as in retraction, intrusion of anteriors and posteriors and a key role in adult orthodontics. Miniscrews are convenient, save time, and produce good treatment results with no need for patient-cooperation. These implants have always offered sufficient anchorage stability while allowing easy removal without fracturing after treatment [1,2].
The aim of this study is to determine and compare, the Torque of incisors, Tip of molars and Vertical control during the orthodontic treatment, using MBT appliance system (Richard McLaughlin, John Bennett and Hugo Trevisi, in the early 1990s launched MBT Appliance System) with and without mini screw implants.
Materials and Methods
The patient sample was selected from the subjects seeking treatment at the Department of Orthodontics, Meenakshi Ammal Dental College and Hospital, Meenakshi University, Tamil Nadu, India. Twenty patients requiring all 1st premolar extraction for correction of proclination between 14-25 years, both male and females were selected for the study. Patients were specifically instructed to maintain a good oral health till cessation of therapy. Comprehensive medical and dental history of all the patients was taken to rule out any systemic illness. Only those subjects with an average mandibular plane angle were included for the study. It was mandatory that all patients, after initial aligning, had a minimum of 4 mm of space left for retraction.
After the extraction of all first premolars, molars were banded and the remaining teeth were bonded with 0.022″ slot MBT appliance system (3M Unitek Gemini Metal Brackets) and 0.016″ NiTi (OrthoForm III) wires were placed. The 20 subjects were randomly divided into 2 Groups consisting of 10 each: Group A & Group B. Group A subjects comprised of those where implants were placed and Group B formed the control Group. The implant used in this study was a mini screw (Absoanchor - SH 1312-08) having a diameter of 1.3 mm and a length of 8 mm. Periapical X-rays were taken with guide bar 8 (jig) to standardize the exact position and to determine whether adequate space was available for implant placement [Table/Fig-1]. To obtain 8 mm biting depth without injuring the adjacent structures, the screw insertion was angulated at 40° and 8 mm gingival to the archwire [3]. The occlusogingival position of microscrew implants determines the force direction so that the retraction of the anterior teeth can be controlled.
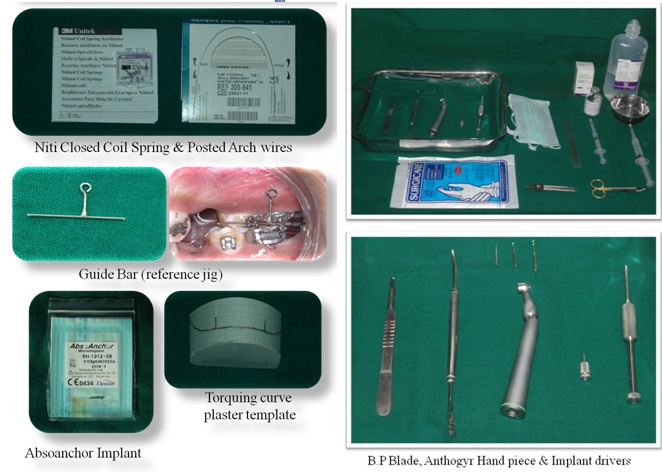
The microscrew implant was placed 8 mm gingival to the archwire (reference jig, [Table/Fig-1]) for retracting the six anterior teeth. The center of resistance of the six anterior teeth was estimated to be halfway between the center of resistance of the four incisors and canines [4]. By using an upward and backward force passing near the center of resistance, the maxillary anterior teeth would show bodily intrusion and retraction.
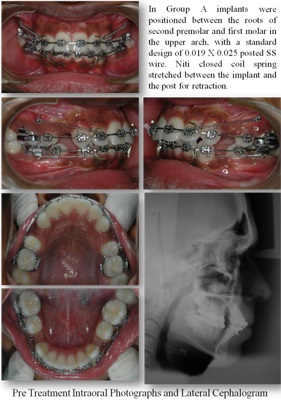
For subjects under Group A, [Table/Fig-2a] the implants were positioned at maximum thickness of infrazygomatic crest 1, between the roots of second premolar and first molar in the upper arch, as soon as, they were upgraded to 0.019 x 0.025 posted SS wire. Retraction was planned after 4 weeks of implant placement and done using NiTi closed coil spring (3M Unitek Medium, 9 mm), stretched between the implant and the post of the 0.019 x 0.025 SS wire in Group A.
For retraction in Group B, [Table/Fig-2b] NiTi closed coil spring was stretched between the molar hook and the post of the 0.019 x 0.025 SS wire. The methods controlling the mode of anterior teeth retraction were the vertical position of the anterior hooks on 0.019 X 0.025 posted SS wire and the amount of torquing curve (reverse curve) given on the archwire. To standardize the amount of torquing curve given on the archwire a plaster template [Table/Fig-1] having a standard design for 0.019 X 0.025 posted SS wire was used. The torquing curve incorporated into the archwire produces an intrusive force and generates a labial crown torque on anterior teeth which helps to enhances the vertical and torque control of the anterior teeth [5].
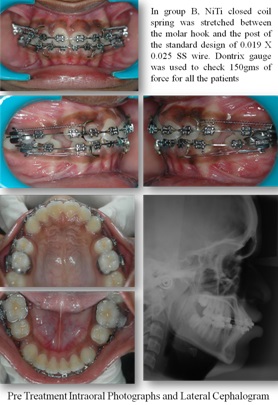
Dontrix gauge was used to check 150 gms of force which was applied using NiTi closed coil spring for all the patients. All patients were recalled at regular intervals of 4 weeks. At each visit the springs were checked such that a force around 150 gms was maintained, while the arch wire was checked for any damage to prevent any interference with sliding. At the end of space closure, post treatment records were taken which included cephalogram. [Table/Fig-3a,3b].
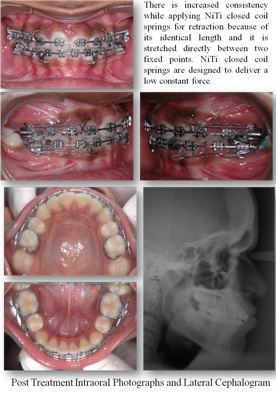
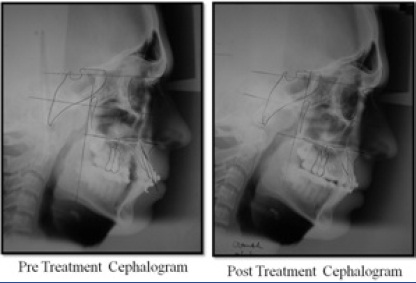
The assessment of the torque control and vertical control during retraction was done by radiographic assessment method. Lateral cephalograms were superimposed according to the method of Pancherz [6]. Lateral cephalometric radiographs were taken before (T1) and after retraction (T2) [Table/Fig-4]. All lateral cephalograms were traced by two different investigators twice and the mean of all the values were taken into consideration. Landmarks and reference planes used for this study are illustrated in [Table/Fig-5].
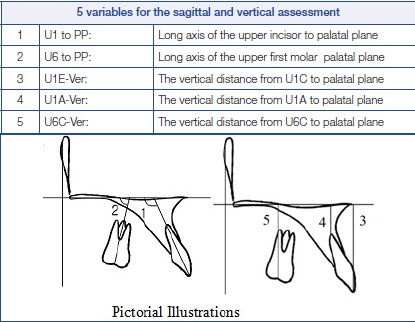
5 variables for the sagittal and vertical assessment with Pictorial Illustrations
Landmarks and reference planes
| Landmarks and reference planes |
|---|
| Nasion | (N) |
| Sella | (S) |
| Orbitale | (Or) |
| Porion | (Po) |
| Anterior nasal spine | (ANS) |
| Posterior nasal spine | (PNS) |
| Pterygoid point | (Pt point) |
| Upper incisor edge | (U1E) |
| Upper incisor root apex | (U1A) |
| Center of Max. 1st molar crown on occlusal surface | (U6C) |
| Most mesial point of mesial surface of Max. 1st molar crown | (U6M) |
| Mesiobuccal root apex of Max. 1st molar | (U6A) |
| Vertical reference plane through Pt point (tangent to palatal plane) | (PTV) |
For the assessment of torque control and vertical control during retraction five variables [6] were taken into consideration. Cephalometric readings of these five variables were taken and tabulated. The variables and their description with illustrations are mentioned in [Table/Fig-6].
Records of each patient were tabulated and the values for all patients were recorded as appended below in [Table/Fig-7].
Recorded values for all patients
| Subjects | U1–PP | U6-PP | U1E-Ver | U1A-Ver | U6C-Ver |
|---|
| Pre-Rx | Post-Rx | Pre-Rx | Post-Rx | Pre-Rx | Post-Rx | Pre-Rx | Post-Rx | Pre-Rx | Post-Rx |
| Group A |
| 1 | 126 | 111 | 86 | 86 | 31 | 30 | 10 | 9 | 26 | 26 |
| 2 | 122 | 110 | 81 | 81 | 29 | 27 | 6 | 4.5 | 22 | 22 |
| 3 | 130 | 114 | 92 | 92 | 27 | 29 | 6.7 | 6 | 25 | 25 |
| 4 | 125 | 129 | 89 | 92 | 29 | 27 | 6.5 | 5 | 27.5 | 26.5 |
| 5 | 130 | 119 | 85 | 81 | 27 | 29 | 4.7 | 5.5 | 24.5 | 24 |
| 6 | 118 | 110 | 82 | 85 | 34 | 33 | 8 | 7 | 29.5 | 28.5 |
| 7 | 114 | 108 | 85 | 84 | 34 | 34 | 11 | 11 | 28 | 28 |
| 8 | 123 | 111 | 82 | 82 | 29 | 27 | 7 | 5.5 | 23 | 23 |
| 9 | 126 | 111 | 86 | 86 | 31 | 30 | 10 | 9 | 26 | 26 |
| 10 | 122 | 110 | 81 | 81 | 29 | 27 | 6 | 4.5 | 22 | 22 |
| Group B |
| 1 | 123 | 117 | 79 | 87 | 31 | 28 | 7.8 | 5 | 25 | 23 |
| 2 | 127 | 110 | 79 | 85 | 28 | 30 | 5.5 | 5.8 | 24 | 26 |
| 3 | 125 | 123 | 87 | 90 | 32.5 | 30 | 7.5 | 7.3 | 25 | 27 |
| 4 | 120 | 128 | 86 | 89 | 32 | 28.5 | 5 | 5 | 26 | 24.5 |
| 5 | 118 | 109 | 87 | 88 | 30 | 30 | 6 | 6 | 22 | 22 |
| 6 | 129 | 129 | 89 | 90 | 38 | 27 | 6 | 7 | 23 | 23 |
| 7 | 120 | 115 | 84 | 88 | 29 | 29 | 6 | 6 | 25 | 25 |
| 8 | 122 | 116 | 78 | 86 | 31 | 30 | 7 | 5 | 25 | 24 |
| 9 | 123 | 117 | 79 | 87 | 31 | 28 | 7.8 | 5 | 25 | 23 |
| 10 | 127 | 110 | 79 | 85 | 28 | 30 | 5.5 | 5.8 | 24 | 26 |
Results
At the end of retraction, the results obtained were recorded, tabulated and statistically analyzed as follows [Table/Fig-8a,b,c]. Means and standard deviation were estimated from the samples for each Group. Comparison of mean values between Group A and B were estimated. In the present study, p<0.05 was considered as the level of significance. The mean, S.D and value of significance for Group A and B were analyzed under the following headings; P1and P2.
Statistically analyzed values tabulated
| Torque of incisors (a) |
|---|
| Variable | Group A | Group B | p-value* | Significance |
| Mean ± S.D | Mean ± S.D |
| P11-pre | 123.9 ± 6.0 | 125.4 ± 3.0 | 0.54 | N.S |
| P11-post | 118.1 ± 6.1 | 119.6 ± 3.2 | 0.55 | N.S |
| P11- Change | 5.8 ± 1.3 | 5.8 ± 1.3 | 1.00 | N.S |
| Tip of Molars (b) |
| Variable | Group A | Group B | p-value | Significance |
| Mean ± S.D | Mean ± S.D |
| P12-pre | 85.8 ± 4.2 | 84.4 ± 3.0 | 0.47 | N.S |
| P12-post | 84.9 ± 4.8 | 87.8 ± 2.4 | 0.15 | N.S |
| P12- Change | 0.88 ± 1.13 | -3.38 ± 0.92 | <0.0001 | * |
| Vertical Control (c) |
| Variable | Group A | Group B | p-value | Significance |
| Mean ± S.D | Mean ± S.D |
| P21-Pre | 30.5 ± 2.3 | 29.7 ± 1.3 | 0.40 | N.S |
| P21-Post | 28.9 ± 3.1 | 30.9 ± 1.2 | 0.12 | N.S |
| P21-Change | 1.6 ± 0.9 | -1.2 ± 1.1 | <0.0001 | * |
| P22-Pre | 7.6 ± 1.9 | 5.6 ± 0.9 | 0.02 | * |
| P22-Post | 6.6 ± 2.3 | 6.9 ± 0.9 | 0.68 | N.S |
| P22-Change | 1.1 ± 0.5 | -1.4 ± 1.2 | <0.0001 | * |
| P23-Pre | 25.7 ± 2.6 | 24.8 ± 1.0 | 0.37 | N.S |
| P23-Post | 25.4 ± 2.3 | 25.5 ± 1.7 | 0.90 | N.S |
| P23-Change | 0.3 ± 0.5 | -0.8 ± 0.9 | 0.01 | * |
Student’s independent t-test was used to calculate the p-value.
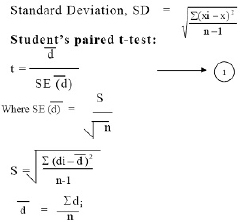
di is the difference of observations of the two Groups. Equation follows a t-distribution with n -1 degrees of freedom. In the present study, the level of significance was considered as p < 0.05.
Inference of [Table/Fig-8(a)]:
The mean value for P11 pre- (torque control of incisors) for Group A was 123.9 ± 6.0 while the mean value for P11 post- for Group A was 118.1 ± 6.1 indicating a mean difference of 5.8 ± 1.3. The mean value for P11 pre- for Group B was 125.4 ± 3.0 while the mean value for P11 post- for Group B was 119.6 ± 3.2 indicating a mean difference of 5.8 ± 1.3 [Table/Fig-9].
P11 Torque of incisors and P12 tip of molar
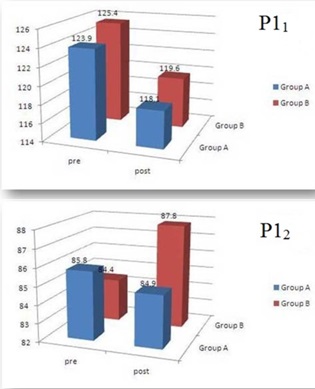
The comparative difference between the mean values (P11 change) in Group A & B was 5.8 ± 1.3 & 5.8 ± 1.3 respectively which indicated no significant difference. The p-value, P11 change of 1.0 substantiates that there was no significant difference.
Inference of [Table/Fig-8(b)]:
The mean value for P12 pre (tip of Molars) for Group A was 85.8 ± 4.2 while the mean value for P12 post for Group A was 84.9 ± 4.8 indicating a mean difference of -0.88 ± 1.13. The mean value for P12 pre- for Group B was 84.4 ± 3.0 while the mean value for P12 post- for Group B was 87.8 ± 2.4 indicating a mean difference of 3.38 ± 0.92 [Table/Fig-10].
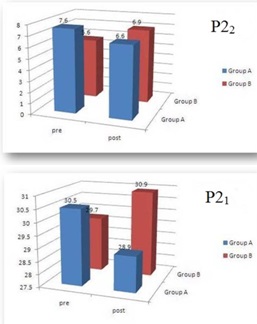
P22 Incisor verticla control - apical and P22 Incisor verticla control – coronal
The comparative difference between the mean values (P12 change) in Group A & B was -0.88 ± 1.13 & 3.38 ± 0.92 respectively, which indicated a significant difference of <0.0001. The P12 change value in Group A of -0.88 ± 1.13 indicated that there was a mild distal tipping of molars, while in Group B, a mesial tipping of 3.38 ± 0.92 was noted. The p-value, P12 change of <0.0001 substantiates the significant difference.
Inference of [Table/Fig-8(c)]:
The mean value for P21 pre- (vertical distance between palatal plane and incisal tip) for Group A was 30.5 ± 2.3 while the mean value for P21 post- for Group A was 28.9 ± 3.1 indicating a mean difference of 1.6 ± 0.9. The mean value for P21 pre- for Group B was 29.7 ± 1.3 while the mean value for P21 post- for Group B was 30.9 ± 1.2 indicating a mean difference of -1.2 ± 1.1.
The comparative difference between the mean values (P21 change) in Group A & B was 1.6 ± 0.9 & -1.2 ± 1.1 respectively, which indicated a significant difference of <0.0001. The P21 change value in Group A of 1.6 ± 0.9 indicated that there was intrusion of incisors while the Group B -1.2 ± 1.1 indicated an extrusion of incisors. The p-value, P41 change of <0.0001 substantiates the significant difference.
The mean value for P22 pre- (vertical distance between palatal plane and apical region of incisor) for Group A was 7.6 ± 1.9 while the mean value for P22 post- for Group A was 6.6 ± 2.3 indicating a mean difference of 1.1 ± 0.5. The mean value for P22 pre- for Group B was 5.6 ± 0.9 while the mean value for P22 post- for Group B was 6.9 ± 0.9 indicating a mean difference of -1.4 ± 1.2.
The comparative difference between the mean values (P22 change) in Group A & B was 1.1 ± 0.5 & -1.4 ± 1.2 respectively, which indicated a significant difference of <0.0001. The P22 change value in Group A of 1.1 ± 0.5 indicated that there was intrusion of incisors while the Group B -3.38 ± 0.92 indicated extrusion of incisors. The p-value, P22 change of <0.0001 substantiates the significant difference.
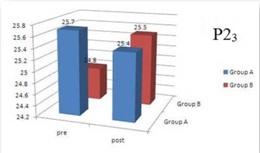
The mean value for P23 pre- (vertical distance between palatal plane and mesiobuccal cusp) for Group A was 25.7 ± 2.6 while the mean value for P23 post- for Group A was 25.4 ± 2.3 indicating a mean difference of 0.3 ± 0.5. The mean value for P23 pre- for Group B was 24.8 ± 1.0 while the mean value for P23 post- for Group B was 25.5 ± 1.7 indicating a mean difference of -0.8 ± 0.9.
The comparative difference between the mean values (P23 change) in Group A & B was 0.3 ± 0.5 & -0.8 ± 0.9 respectively which indicated a significant difference of 0.01. The P23 change value in Group A of 0.3 ± 0.5 indicated that there was only a very mild intrusion of molar, while the Group B -0.8 ± 0.9 indicated a mild extrusion of molars. The p-value, P23 change of 0.01 substantiates the significant difference [Table/Fig-11].
Discussion
The comparative difference between the mean values for P11 change (torque of incisors) for Group A and B was 5.8±1.3 indicating no significant difference, which is contrary to the other studies, which have reported such a change [7,8]. This may be due to the fact that in the earlier studies, loss of torque was significant in the non-implant Group, whilst, it was insignificant in this study. The overall torque control was better due to a full size wire retraction, expression of residual tip and torque before commencement of retraction and proper four-week activation protocol. The mean loss of torque for incisors in this study was found to be 5.80, hence, there was no comparative difference in the mean values obtained for Group A and B in this study.
The comparative difference between the mean values P12 change (tip of molars) in Group A was -0.88 ± 1.13 indicated that there was only a mild distal tipping of molars. This is due to the fact that the reactive component of force is directed occlusal to the centre of resistance of the tooth even after space closure and not apically. The comparative difference between the mean values P12 in Group B was 3.38 ± 0.92 indicated a mild mesial tipping of molar which could be explained by the fact that the molar tooth is the anchor component and the reactionary forces acting on it would bring about a mesial movement of molars.
The comparative difference between the mean values of P21 and P22 change (vertical distance between palatal plane and incisor) in Group A was 1.6 ± 0.9 and 1.1 ± 0.5. The P21 and P22 change value in Group A indicated that there was only a mild intrusion of incisors because the point of force application is more apical to the centre of resistance than with conventional mechanics [5,9]. On the contrary, P21 and P22 change value in Group B which was -1.2 ± 1.1 and -1.4 ± 1.2 indicated a mild extrusion of incisors because the point of force application was more coronal. The p-value, P21 change of <0.0001 substantiates the significant difference.
The comparative difference between the mean values P23 change (vertical distance between palatal plane and molar) in Group A was 0.3 ± 0.5 which is clinically negligible. The mean values for P23 change in Group B was -0.8 ± 0.9 indicated a mild extrusion of molars. This could be explained by the fact that the molar tooth is the anchor component and the reactionary forces acting on it would bring about an extrusion of the molars [10]. The p-value, P21 change of 0.01 substantiates the significant difference.
Conclusion
The implant provides an excellent three-dimensional control of the anterior and posterior segment during retraction when compared to the conventional mode of anchorage. The following advantages are cited,
The torque control between the Groups is comparable.
The tip control of molar is better in the implant Group.
True intrusion is possible with the implant Group.
Vertical control of the molar is better in the implant Group.