Assessment of Nutritional Risk and Its Associated Factors among Elderly Women of Old Age Homes of South Suburban Kolkata, West Bengal, India
Santanu Saha1, Ayan Basu2, Santanu Ghosh3, Arghya Kusum Saha4, Upasana Banerjee5
1 Assistant Professor, Department of General Medicine, Bankura Sammilani Medical College, Bankura, India.
2 RMO cum Clinical Tutor, Department of Tropical Medicine, School of Tropical Medicine, Kolkata, India.
3 Assistant Professor, Department of Community Medicine, Bankura Sammilani Medical College, Bankura, India.
4 Social Worker, Diploma in Social Work & Community Services, National Council of Education, Bengal, Jadavpur University, Kolkata, India.
5 Applied Nutrition (AIIH & PH), Nutritionist, NRHM, Burdwan, Panagarh, India.
NAME, ADDRESS, E-MAIL ID OF THE CORRESPONDING AUTHOR: Dr. Santanu Saha, Nilanjana Apartment 182/1, Block A, Bangur Avenue City, Kolkata-700055, West Bengal, India.
Phone: 09830321254,
E-mail: Santanu0129@gmail.com
Background: Different physiological, social and psychological factors contribute to nutritional risk in elderly population. Elderly women residing at old age homes are particularly susceptible.
Objectives: To find out psychological and financial factors, if any, associated with malnutrition and risk of malnutrition.
Methods: A cross sectional descriptive study was conducted on 200 residents belonging to > 65 years age group of nine old age homes selected randomly among eighteen old age homes located at south suburban areas of Kolkata from September 2010 to April 2011 using a pre-designed, pilot tested schedule containing Mini Nutritional Assessment (MNA) Scale and Geriatric Depression Scale (GDS). Intergroup comparison was performed using chi-square test.The study was approved by Institutional Ethics Committee of All India Institute of Hygiene & Public Health, Kolkata,India. Written informed consent was taken from each study participant.
Results: Among 158 ‘possibly malnourished’ women, 114 (57%) were ‘at risk of malnutrition’ and 44 (22%) were malnourished according to MNA. Psychological stress was present among 44% of ‘at risk of malnutrition’ and 56% ‘malnourished’ population (df=1, x2= 28.852, p<0.001). About 77% of women having moderate depression were ‘at risk of malnutrition’ whereas 52% of women having severe depression were ‘malnourished’ (df =2, x2= 23.769, p<0.001).
Conclusion: High proportion of ‘at risk malnutrition’ and ‘malnutrition’ associated with presence of psychological stress and different grades of depression were the major areas of concern.
Introduction
Ageing is an irreversible biological process which starts from conception and ends after death. The U.S. Census bureau defines those 55 years and above as older population and 65 year and above as elderly population. According to Census 2011, 7.45% of the Indian population are elderly >65 years [1]. Life expectancy of Indian males and females are 63.9 years and 66.9 years respectively. Ageing involves physical changes like metabolic, he-patic, gastrointestinal, renal, skeletal, neurological, immunological as well as physiological changes. Elderly population is at risk of under nutrition due to physical, cognitive as well as functional decline.There are different causes of nutritional risks like physiological causes including diseases, intake of excess medicines, disabilities like walking, hearing. optical, economical causes like reduction of income, higher expenses for medicine, low purchasing capacity, social causes like isolation, getting less importance and attention from family members, religious causes including avoidance of foods at particular days and objection to some foods, psychological causes including depression, loneliness and insecurity.Besides health factors, elderly persons living alone may not bother to prepare a good healthy and balanced diet. They may take help of various fast foods and ready to eat foods.Depression is one of the most common and reversible causes of malnutrition in elderly. Elderly women residing at old age homes seem more vulnerable to all the threats of nutritional risk owing to their isolation from the family, meagre income, psychological stressors, and limited access to health care and lack of self-care. In a study conducted in Mangalore by Pai MK between elderly population living at old age homes and those who reside outside, a high risk of malnutrition (p<0.05) in the old age home residents were found that confirmed the need for increased surveillance of nutritional status among residents of old age homes [2].
Keeping the above background in mind, the present study was conducted among elderly women residing at old age homes of south suburban areas of Kolkata with the objective of finding out psychological and financial factors, if any, associated with malnutrition and risk of malnutrition.
Materials and Methods
The present cross sectional study was conducted among 200 elderly women of >65 years age group residing in nine old age homes of South suburban areas of Kolkata from September 2010 to April 2011.The present study was started after getting approval from Institutional Ethics Committee of All India Institute of Hygiene & Public Health, Kolkata. Written informed consent was taken from each study participant. There are eighteen old age homes in the study area and 50% of them were selected using random number method. Total number of elderly women was 217 among whom 200 provided written informed consent to participate in the study and these 200 women constituted the study population.
Study tools included one pre-designed, pre tested schedule to collect background information, MNA Scale (Assessment of nutritional risk), GDS (Assessment of depression), anthropometric rod (Height measurement), Weighing balance (Weight measurement) and Measuring tape (MAC, Waist, Hip measurement).
MNA Questionnaire: It provides a simple, rapid and useful assessment of nutritional risk by asking 18 questions derived from 4 groups, namely anthropometric assessment, general assessment, dietary assessment and subjective assessment, i.e., self-perception of health and nutrition. There are two parts in MNA. Part I contains 6 screening questions and Part II contains 12 assessment questions. The scoring pattern is mentioned below:
Part I: 12-14: Normal and ≤ 11: Possible malnutrition.
Part II > 24: Well nourished, 17-23.5: Risk of malnutrition. Lower 17: Malnutrition
If score of part I is less than 11 then part II is applied.
The GDS: There are 15 questions related with 7 common characteristics of general life, namely somatic concern, lowered affect (affect is the outward expression of emotion), cognitive impairment, feelings of discrimination, impaired motivation, lack of future orientation and lack of self-esteem. The questions of GDS have only 2 options: Yes and No. The scoring pattern is mentioned below:
0-9 = Normal.
10-19= Mild Depressive.
20- 30= Severely Depressive.
Both questionnaire were translated into Bengali, the vernacular and was retranslated into English. A pilot survey was then conducted using the two sets of both the questionnaires (using the original and the retranslated version with a gap of seven days) on inmates of another old age home in the study area that was not included in the final study.
Reliability and internal consistency were assessed by Cronbach’s alpha coefficient which was found to be 0.83 and 0.81 for MNA and GDS questionnaire respectively which thereby indicated the appropriateness of the Bengali translation of both the questionnaires. The survey was then conducted on the study subjects allowing a recall period of 2 weeks.
Statistical Analysis
Statistical analysis was done using SPSS (Version 20.0). Results were expressed in percentage. Inter-group comparison was performed using Chi-square test. P-value <0.05 was considered statistically significant.
Results
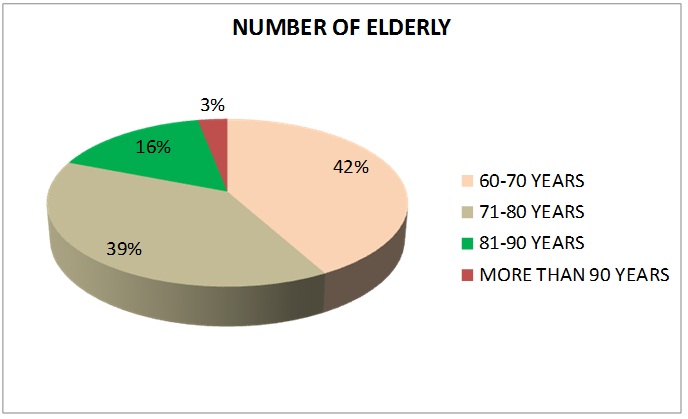
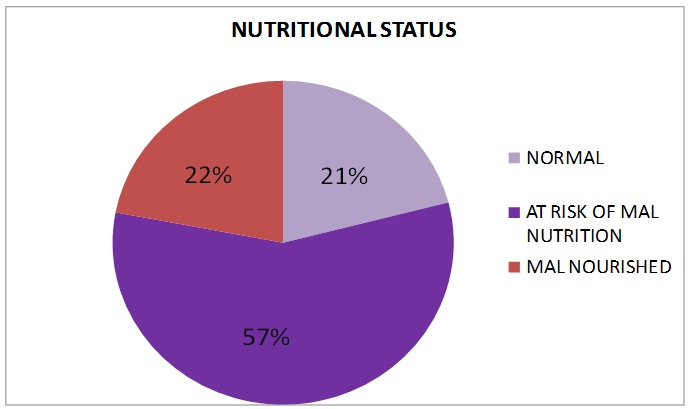
Majority of the study population belonged to 60-70 years age group (42%) [Table/Fig-1]. More than 60% did not receive any pension. According to MNA score, 79% (158/200) elderly women were identified and short listed as ‘possibly malnourished’. Among these 158 shortlisted ‘possibly malnourished’ elderly women, 114 (57%) were at risk of malnutrition and 44 (22%) were malnourished [Table/Fig-2]. Among those shortlisted, 44% belonged to 60-70 year age group followed by 35% who belonged to 71-80 years age group. Only 37% among shortlisted women received any pension. Majority (80.8%) of those who were ‘at risk of malnutrition’ had monthly income above Rs 4,000/- whereas majority of malnourished population (32.1%) sustained on monthly income below Rs 4,000/- (df=1, x2= 2.865, p=0.091) [Table/Fig-3]. GDS was performed on the short listed population. Psychological stress was present among 44% of ‘at risk’ population and 56% malnourished population and the difference was statistically significant (df=1, x2= 28.852, p=0.000) [Table/Fig-4].
Distribution of elderly women population according to Age (n=200)
Distribution of elderly women population according to Nutritional status using MNA scale (n=200)
Distribution of ‘At Risk’ and ‘Malnourished’ population according to monthly income (n=158)
| Income (Rs/-) | ‘At Risk’ of Malnutritionn (%) | Malnourished n (%) | Total n (%) | p- value |
|---|
| <4000 | 72 (67.9) | 34 (32.1) | 106 (100.0) | x2= 2.865, p =0.091 |
| ≥4000 | 42 (80.8) | 10 (19.2) | 52 (100.0) |
| Total | 114 (72.2) | 44 (27.8) | 158 (100.0) |
p-value was calculated after comparing values of ‘at risk of malnutrition’ and ‘malnourished’ groups by using chi-square test with degree of freedom 1
Distribution of ‘At Risk’ and ‘Malnourished’ population according to presence of psychological stress using GDS (n=158)
| Presence of Psychological Stress | ‘At Risk’ of Malnutritionn (%) | Malnourished n (%) | Total n (%) | p- value |
|---|
| Yes | 22 (44.0) | 28(56.0) | 50 (100.0) | x2= 28.852 ***p =0.000 |
| No | 92 (85.2) | 16 (14.8) | 108 (100.0) |
| Total | 114 (72.2) | 44 (27.8) | 158 (100.0) |
***p<0.001 p-value was calculated after comparing values of ‘at risk of malnutrition’ and ‘malnourished’ groups by using chi-square test with degree of freedom 1
It was observed that among women belonging to ‘at risk of malnutrition’, 21% had severe depression, 42.2% had mild depression and 36.8% had no depression. On the other hand, among the 44 malnourished women, 59% had severe depression, 31.8% had mild depression and 9.1% had none. About 77% of women having mild depression were ‘at risk’ whereas 52% of women having severe depression were ‘malnourished’ and the difference was statistically significant (df=2, x2= 23.769, p=0.000)[Table/Fig-5].
Distribution of ‘At Risk’ and ‘Malnourished’ population according to grade of depression using GDS (n=158)
| Grade of Depression | ‘At Risk’ of Malnutrition (%) | Malnourished n (%) | Total n (%) | p- value |
|---|
| Normal | 42 (36.8) | 4 (9.1) | 46 (29.1) | x2= 23.769 ***p =0.000 |
| Mild | 48 (42.2) | 14 (31.8) | 62 (39.2) |
| Severe | 24 (21) | 26 (59.1) | 50 (31.7) |
| Total | 114 (100) | 44 (100) | 158 (100.0) |
***p<0.001 p-value was calculated after comparing values of ‘at risk of malnutrition’ and ‘malnourished’ groups by using chi-square test with degree of freedom 2
Discussion
An estimated 68 million of Indians are above the age of 60 years; however information about their health status and need is limited. Experience in developed countries shows that multiple chronic illness, nutritional deficiency, and functional disabilities are common features of old age. For the development of any health programme, reliable situational information is essential.The present study acts as an eye opener to the poor nutritional status, hitherto unknown, of the elderly women residing in old age homes in Kolkata and adjoining areas.Study conducted by Lopez MDR showed that according to MNA score, 7.9% of older women were malnourished, proportion much lower than that of the present study and 61.8% were at risk of malnutrition, similar to that of the present study [3]. In a study conducted by Pai MK between elderly population living at old age homes and those who reside outside in Mangalore, 19.4% of the population was malnourished and 57.4% were at risk of malnutrition [2], similar to that of the present study. Griep MI also reported 17-23% at risk among elderly female residents of old age homes [4]. However, Maries ML reported malnutrition in 6% of the population and 47% belonged to at risk group in old age homes of Somerset, UK [5].Difference in geographical, social-economic and socio cultural settings are the probable reasons for such differences. In a cross sectional study was done on 267 elderly people aged 60-74 of southern Brazil using M.N.A and G.D.S, majority of the elderly individuals were female (59.9%). Nutritional deficit was identified in 58 elderly people (21.7%) and depression in 65 (24.3%). Nutritional deficit presented a significant association with depression, even after adjusting for control variables such as low schooling, low socioeconomic level, and smoking (OR = 4.38; 95% CI: 2.23-8.64; p < .001). The findings corroborate that of the present study showing statistical association between grades of depression and poor nutritional status.
Limitations
First of all, the study was conducted among 200 elderly women, a relatively small sized population in a suburban area of Kolkata. Therefore the findings of the study may not even be generalizabled for inmates of old age homes located in Kolkata proper. Secondly, qualitative research methods were not adopted that might lead to more detailed assessment of the factors contributing to nutritional status of the study population.
Conclusion
The present study revealed high level of malnutrition and risk of malnutrition among elderly women residing in old age homes in and around Kolkata. Significant association was observed between nutritional risk and the presence of psychological stress and between nutritional risk and different grades of depression. Women with insufficient monthly income also found to have poor nutritional status. Early nutritional intervention should be implemented especially to those who were ‘at risk of malnutrition’ to halt their progress towards malnutrition and also for already malnourished population for restoration of normal nutritional status. More extensive and in depth studies of longitudinal design with qualitative research components to probe into the causes and consequences of such grave and pertinent public health problem are required.
p-value was calculated after comparing values of ‘at risk of malnutrition’ and ‘malnourished’ groups by using chi-square test with degree of freedom 1
***p<0.001 p-value was calculated after comparing values of ‘at risk of malnutrition’ and ‘malnourished’ groups by using chi-square test with degree of freedom 1
***p<0.001 p-value was calculated after comparing values of ‘at risk of malnutrition’ and ‘malnourished’ groups by using chi-square test with degree of freedom 2
[1]. Office of Registrar General. Census of India. New Delhi: Office of Registrar General, Government of India, 2011. Available from: http://www.censusindia.gov.in/Census_Data_2011 [Last accessed on 2013 Dec 20] [Google Scholar]
[2]. Pai MK, Comparative study of nutritional status of elderly population living in the home for aged vs. Those living in the communityBiomedical Research 2011 22:120-26. [Google Scholar]
[3]. Lopez MDR, Artacho R, Oliva P, Moreno-Torres R, Bolaños J, Teresa CD, Nutritional risk in institutionalized older women determined by M.N.A. test; what are the main factors?Nutrition 2003 19:767-71. [Google Scholar]
[4]. Griep MI, Mets TF, Collys K, Ponjaert-Kristoffersen I, Massart DL, Risk of Malnutrition in Retirement Homes Elderly Persons Measured by M.N.AJ Gerontol A Biol Sci Med Sci 2000 55:57-63. [Google Scholar]
[5]. Marais ML, Marais D, Labadarios D, Assessment of Nutritional Status of Older People in Homes for Aged in The Somerset West AreaSAJCN 2007 20:102-08. [Google Scholar]