Workplace can serve as an important place for prevention, control and management of chronic diseases as workers represent a large proportion of the general population. Occupation has an influence on CVD risks attributable to work conditions such night shifts, form and duration of work [11–13]. Thus, targeting MS in high risk occupations may aid in prevention, control and management of CVD and other related chronic diseases. However, the crucial basis for developing and implementing nutrition and health interventions in the workplace requires the determination of major CVD risks as well as their distribution patterns [14]. Also, age and sex variation in clustering of risks have important implications for interpreting the association between MS and mortality risk [15]. In China, extensive research on MS prevalence has been carried out on the general population [16, 17] however limited data is available on workers. In light of risk factors such as heavy workload, long working hours, extended work schedules in Chinese Universities [18,19], and differences in working conditions in comparison to the general population, the health status of university workers merits more attention. Therefore, the objective of this study was to investigate the prevalence of MS and its components among University workers, and determine how the prevalence varied according to sex and occupation.
Materials and Methods
Study Participants and Research Design
This was a cross-sectional study of 2,428 University employees who received an annual clinical examination at Jiangnan University Hospital. Some variables were missing in 155 participants hence were not included in analysis. A total of 2,273 participants were therefore evaluated (male, 1,198; female, 1,075). Workers were then categorised into two occupation groups: administration and academic. Administrators are involved with office work while those in academic are involved with research, teaching or combination. All the survey protocols were approved by Jiangnan University ethical committee and the hospital management. Informed consent was given by all participants. Study protocols were conducted in accordance with the Declaration of Helsinki recommendations of 1975, revised 2000.
Data Collection
Physical assessment
The anthropometric measurements, weight (kg) and height (m) were measured using weight-height machine (HW-700, Zhengzhou, China) and used to compute body mass index (BMI). BMI ≥ 28 Kg/m2 was defined as obesity. Systolic and diastolic blood pressure (mmHg) was measured on the upper right arm using standard sphygmomanometer (YE-665 A, Jiangsu, China) after at least five minutes of rest. All measurements were taken by trained medical personnel.
Blood sample collection and preparation
The overnight fasting blood samples were obtained in the morning by venipuncture and collected into vacutainer tubes. Blood samples were kept on ice immediately and plasma separated by centrifugation, (KDC-1044, Hangzhou, China) at 1000 × g for 10 minutes at 4oC. Using standard biochemical reagents (Jiancheng Bioengineering Institute, Nanjing, PR China), an automatic Biochemical Analyser (HF 400, Shanghai, China) was used to measure enzymatically the levels of FPG, lipid profiles; triglycerides (TG), Total Cholesterol (TC), Low Density Lipoprotein (LDL) cholesterol and High-Density Lipoprotein (HDL) cholesterol. All biochemical analyses were conducted at Jiangnan University hospital laboratory. MS was defined according to the Modified criteria of the National Cholesterol Education Program Adult Treatment panel [20].
Statistical Analysis
Data were analysed with Statistical Package for Social Scientists for Windows, 18 (SPSS, Inc. Chicago, USA). Independent samples t-test was used to compare means. Chi-square (χ2) test was used to compare categorical variables. Conditional forward and backward binary logistic regression was used to examine associations. p < 0.05 was considered statistically significant.
Results
Anthropometric and Metabolic Characteristics of the Study Population
The measured anthropometric and metabolic characteristics of the participants are shown in [Table/Fig-1]. The average age was 42.5 ± 8.6 years; females (40.5 ± 8.0 years) being younger than males (44.4 ± 8.8 years). The BMI for the total adult population was within normal reference levels (22.94 ± 3.06 kg/m2). As compared with females, males had higher (p<0.01) BMI, systolic and diastolic blood pressure, FPG, TC, TG and LDL cholesterol. However, females showed elevated (p<0.01) HDL cholesterol.
Anthropometric and metabolic characteristics of adults by sex
| Characteristic | All (n=2273) | Male (n=1198) | Female (n=1,075) | p |
|---|
| Age (years) | 42.5 ± 8.6 | 44.4± 8.8 | 40.5 ± 8.0 | 0.001 |
| Weight (kg) | 1.67 ± 0.07 | 71.46 ±16.72 | 56.31± 7.10 | 0.001 |
| BMI (Kg/m2) | 22.94 ± 3.06 | 24.08 ± 2.92 | 21.64 ± 2.68 | 0.001 |
| Systolic BP (mmHg) | 120.34 ± 14.94 | 125.59 ± 14.07 | 114.48 ± 13.68 | 0.001 |
| Diastolic BP (mmHg) | 81.22 ± 9.87 | 85.26 ± 9.16 | 76.71 ± 8.610 | 0.001 |
| Fasting plasma glucose | 5.13 ± 0.82 | 5.30 ± 0.99 | 4.93 ± 050 | 0.001 |
| Total cholesterol (mmol/L) | 5.13 ± 0.94 | 5.22 ± 0.97 | 4.99 ± 0.89 | 0.001 |
| Triglycerides (mmol/L) | 1.31 ± 0.86 | 1.54 ± 0.94 | 1.04 ± 0.66 | 0.001 |
| LDL(mmol/L) | 2.68 ± 0.77 | 2.84 ± 0.77 | 2.48 ± 0.71 | 0.001 |
| HDL(mmol/L) | 1.52 ± 0.39 | 1.39 ± 0.36 | 1.64 ± 0.37 | 0.001 |
Data are expressed as means ± standard deviation; fasting plasma glucose in mmol/L; BMI, body mass index; BP, blood pressure; LDL, low-density lipoprotein; HDL, high-density lipoprotein cholesterol; P<0.01 statistically significant by independent samples t-test
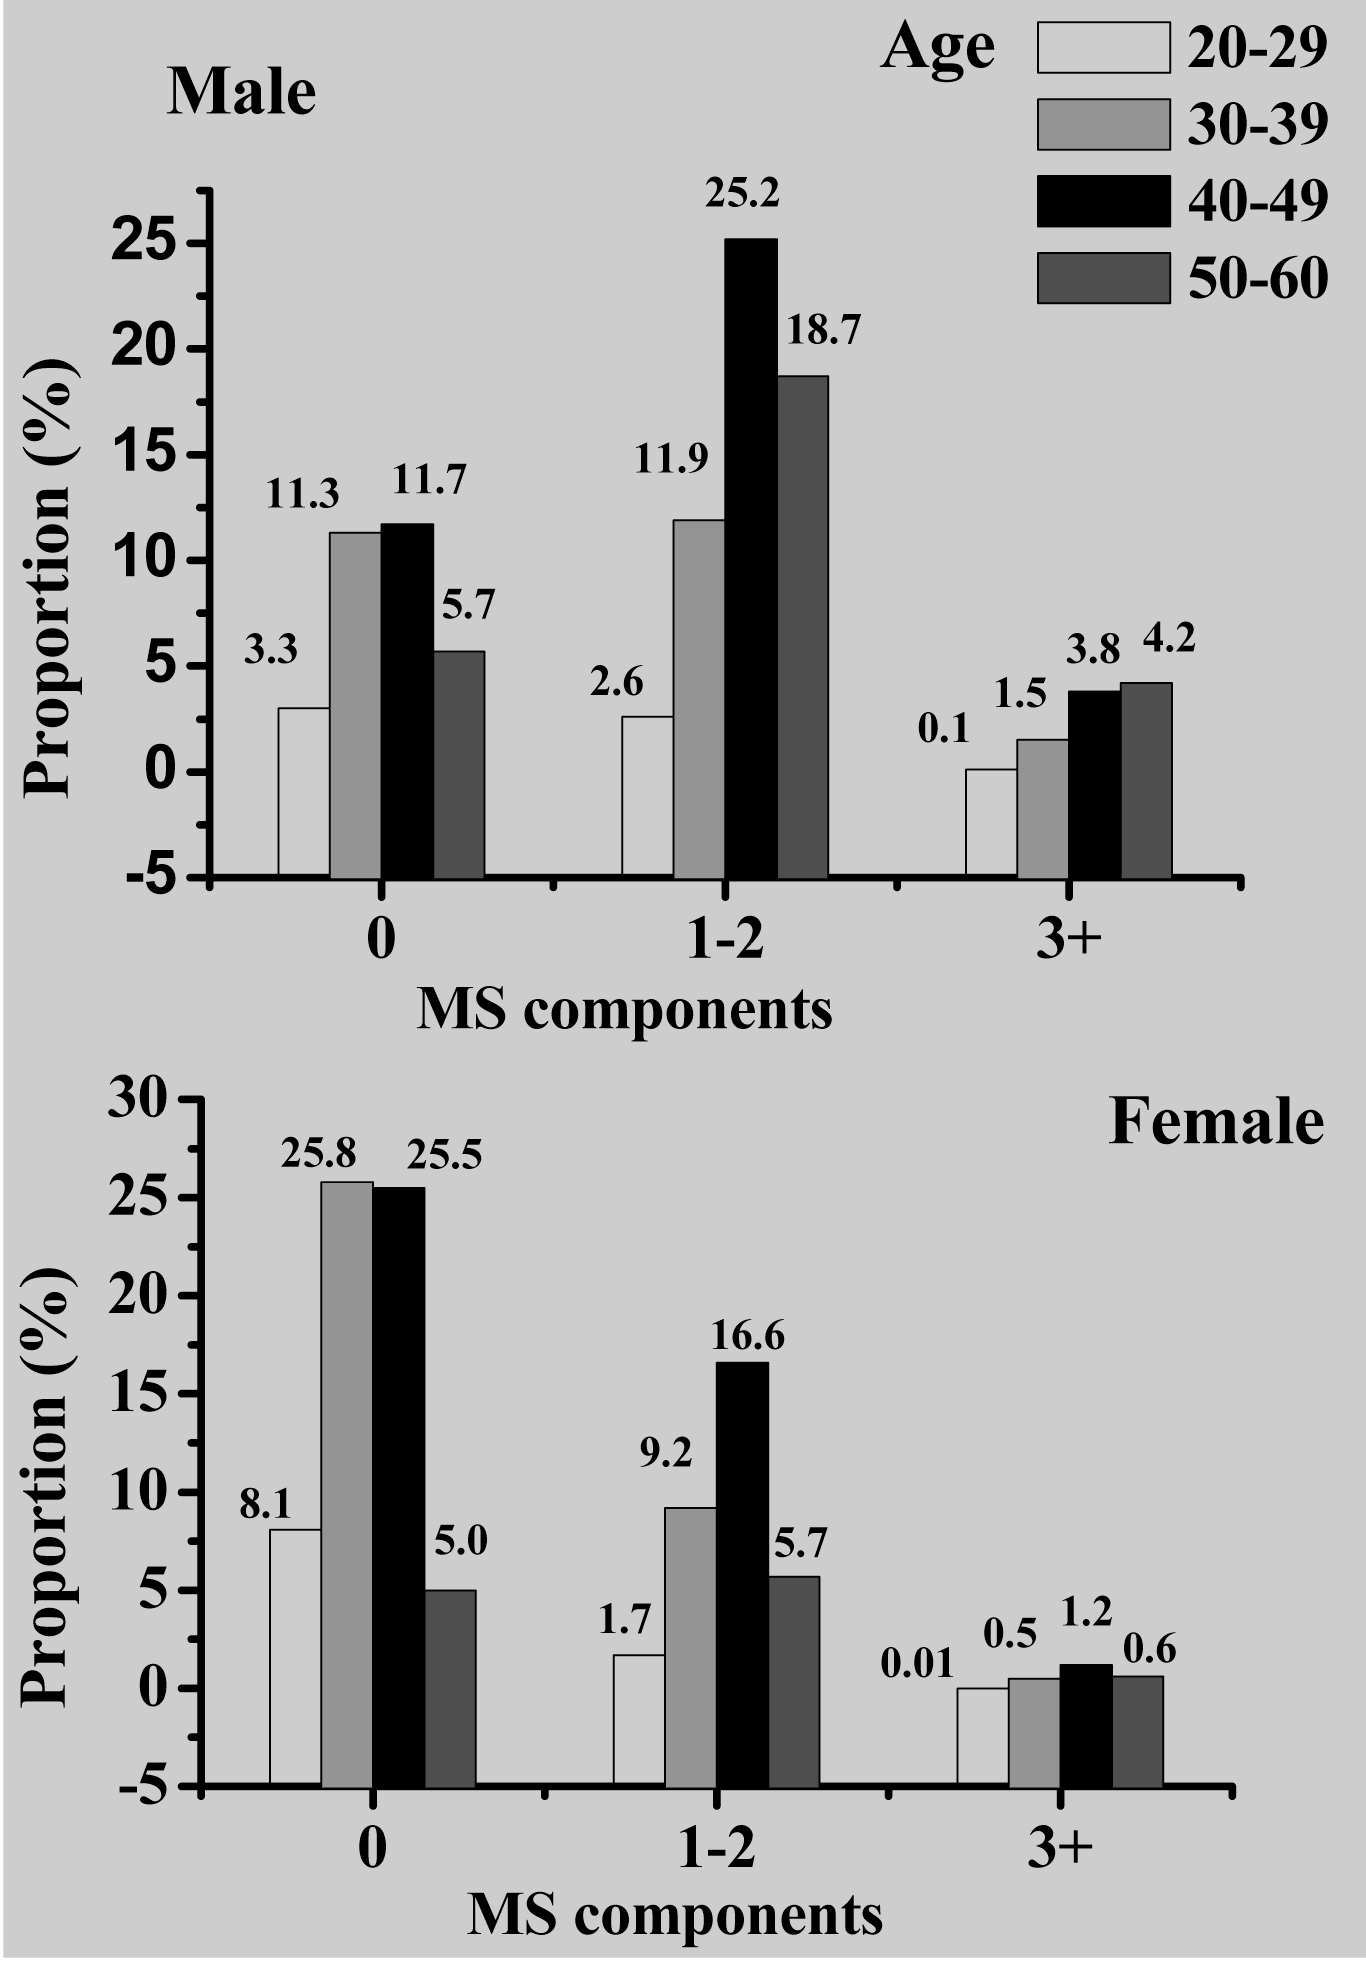
Prevalence of Metabolic Abnormalities by Sex and Age Groups
Workers were categorized into four age groups: 20-29, 30-39, 40-49 and 50-60 years old. Prevalence of MS components varied across age groups in both males (χ2=74.896, p=0.001) and females χ2=53.587, p=0.001). As shown [Table/Fig-2], prevalence in the number of components was greater in 40-49 years age group among males (25.2%) and females (16.6%). Overall, MS prevalence was 6.1%, and was higher (p<0.01) in males (5.1%) than females (1.1%) [Table/Fig-3]. The most prevalent component in all participants was hypertension (37.9%), followed by elevated TG (20.8%), reduced HDL (13.8%), hyperglycemia (13.3%) and obesity (4%). Male workers showed higher prevalence than females. Hypertension (28.3%) and elevated TG (16.1%) were most frequent in males while hypertension (9.6%) and reduced HDL (7.7%) were common in females. Furthermore, prevalence increased (p<0.05) with age up to 49 years, and declined in the older age group [Table/Fig-4].
Sex-specific prevalence of the number of metabolic syndrome components by age groups; p<0.05 significant by χ2 test; MS, metabolic syndrome
Prevalence of metabolic syndrome and its components by sex
| All (n=2273) | Male (n=1198) | Female (n=1075) | p |
|---|
| Metabolic syndrome | 139 (6.1) | 115 (5.1) | 24 (1.1) | 0.001 |
| High body mass index | 75 (4.0) | 65 (3.5) | 10 (0.5) | 0.001 |
| Hypertension | 857 (37.9) | 640 (28.3) | 217 (9.6) | 0.001 |
| Hyperglycemia | 294 (13.3) | 234 (10.6) | 60 (2.7) | 0.001 |
| Elevated triglycerides | 462 (20.8) | 357 (16.1) | 105 (4.7) | 0.001 |
| Reduced HDL | 307 (13.8) | 137 (6.2) | 170 (7.7) | 0.001 |
Data shown are n (%); HDL, high density lipoprotein cholesterol; p<0.01 statistically significant by χ2 test
Sex-specific prevalence of metabolic syndrome and its components by age groups
| Male | Female |
|---|
| 20-29 (n=97) | 30-39 (n=290) | 40-49 (n=476) | 50-60 (n=335) | p | 20-29 (n=103) | 30-39 (n=373) | 40-49 (n=455) | 50-60 (n=144) | p |
|---|
| MS | 1(0.1) | 18(1.5) | 44(3.8) | 49(4.2) | 0.001** | 0(0) | 5 (0.5) | 13 (1.2) | 6 (0.6) | 0.035* |
| High BMI | 2(0.2) | 14(1.4) | 25(2.6) | 23(2.4) | 0.376 | 2(0.2) | 2(0.2) | 4(0.5) | 2(0.2) | 0.435 |
| Hypertension | 21(1.8) | 109(9.3) | 273(23.3) | 222(19) | 0.001** | 3(0.3) | 40(3.8) | 123(11.8) | 48(4.6) | 0.001** |
| High FPG | 4(0.3) | 27(2.4) | 89(7.8) | 109(9.5) | 0.001** | 2(0.2) | 16(1.6) | 27(2.6) | 14(1.4) | 0.005* |
| High TG | 8(0.7) | 73(6.4) | 162(14.1) | 109(9.5) | 0.001** | 5(0.5) | 25(2.4) | 49(4.8) | 23(2.3) | 0.001** |
| Low HDL | 7(0.6) | 33(2.9) | 56(4.9) | 37(3.2) | 0.946 | 12(1.2) | 66(6.5) | 73(7.1) | 16(1.6) | 0.427 |
Data shown are n (%); MS, metabolic syndrome; BMI, body mass index (kg/m2); FPG, fasting plasma glucose; TG, triglycerides; HDL, high density lipoprotein cholesterol;**p<0.01, **p<0.05 statistically significant by χ2 test
Metabolic Syndrome and Occupation
[Table/Fig-5] shows the association of occupation with MS and each of its components. After adjustment for age and BMI, there was no difference (p>0.05) between MS prevalence in administrators and those in academic. Overall, workers in administration had increased (p<0.05) body weight, hypertension and hyperglycemia while no difference was found in dyslipidemia. After adjustment for age, male administrators showed increased hypertension and hyperglycemia while females had higher hypertension and lower prevalence of hypertryglyceridemia compared to those in academics. In both sexes, no difference (p>0.05) was found in reduced HDL, and elevated TG in males.
Odds ratios and 95% confidence intervals for workers in administration
| | All (n=780) | | Male (n=448) | | Female (n=332) | |
|---|
| Model | OR | 95 % CI | p | OR | 95 % CI | p | OR | 95 % CI | p |
|---|
| Metabolic syndrome | 1 | 1.602 | 1.136-2.259 | 0.007* | 1.737 | 1.181-2.555 | 0.005* | 0.741 | 0.292-1.885 | 0.530 |
| 2 | 1.172 | 0.897-1.834 | 0.172 | 1.467 | 0.981-2.193 | 0.062 | 0.653 | 0.254-1.676 | 0.375 |
| 3 | 1.059 | 0.691-1.623 | 0.794 | 1.233 | 0.774-1.964 | 0.378 | 0.394 | 0.114-1.371 | 0.143 |
| Obesity | 1 | 1.988 | 1.250-3.161 | 0.004* | 1.699 | 1.025-2.816 | 0.040* | 2.533 | 0.727-8.828 | 0.145 |
| 2 | 1.855 | 1.154-2.984 | 0.011* | 1.634 | 0.974-2.744 | 0.063 | 2.640 | 0.750-9.291 | 0.131 |
| Hypertension | 1 | 1.798 | 1.506-2.147 | 0.001** | 1.748 | 1.377-2.219 | 0.001** | 1.681 | 1.234-2.292 | 0.001** |
| 2 | 1.493 | 1.233-1.808 | 0.001** | 1.474 | 1.146-1.896 | 0.002* | 1.492 | 1.071-2.080 | 0.018* |
| 3 | 1.362 | 1.090-1.703 | 0.007* | 1.313 | 0.993-1.737 | 0.056 | 1.389 | 0.933-2.069 | 0.105 |
| Hyperglycemia | 1 | 1.611 | 1.270-2.044 | 0.001** | 1.786 | 1.337-2.386 | 0.001** | 0.933 | 0.529-1.647 | 0.811 |
| 2 | 1.321 | 1.028-1.698 | 0.030* | 1.469 | 1.082-1.993 | 0.014* | 0.897 | 0.503-1.598 | 0.712 |
| 3 | 1.196 | 0.882-1.620 | 0.249 | 1.391 | 0.984-1.967 | 0.062 | 0.662 | 0.322-1.361 | 0.262 |
| High triglycerides | 1 | 1.153 | 0.941-1.413 | 0.170 | 1.287 | 0.998-1.661 | 0.052 | 0.776 | 0.493-1.221 | 0.273 |
| 2 | 1.019 | 0.824-1.259 | 0.864 | 1.221 | 0.998-1.589 | 0.138 | 0.635 | 0.392-1.026 | 0.064 |
| 3 | 0.886 | 0.681-1.154 | 0.370 | 1.062 | 0.786-1.436 | 0.694 | 0.390 | 0.204-0.746 | 0.004 |
| Low HDL | 1 | 0.943 | 0.731-1.217 | 0.652 | 1.016 | 0.704-1.467 | 0.933 | 0.925 | 0.647-1.323 | 0.670 |
| 2 | 0.982 | 0.755-1.277 | 0.892 | 1.027 | 0.701-1.503 | 0.893 | 0.962 | 0.667-1.386 | 0.834 |
| 3 | 1.035 | 0.770-1.390 | 0.821 | 1.044 | 0.683-1.596 | 0.841 | 1.050 | 0.688-1.602 | 0.820 |
Reference, workers in academics; HDL, high-density lipoprotein cholesterol; OR, odds ratio; CI, confidence interval; model 1, crude; model 2, after adjustment for age; model 3, after adjustment for body mass index; **p<0.01, *p<0.05, statistically significant by binary logistic regression
Workers in academic were further grouped into two professional positions: Lecturers/Technicians and Professors (Associate and Full). The mean age for male (42.2 ± 8.7) and female lecturers (38.9 ± 7.4) was lower as compared to the professors (41.2 ± 7.9, 41.6 ± 8.2 respectively). There was no significant (p>0.05) difference in the prevalence of all the metabolic risks between the two professional positions in both sexes [Table/Fig-6].
Prevalence of metabolic syndrome and its components in academic workers by professional position
| Male | Female |
|---|
| Lecturers† (n=344) | Professors‡ (n=406) | p | Lecturers (n=442 ) | Professors (n= 301) | p |
|---|
| MS | 21 (3.3) | 33 (5.1) | 0.315 | 13 (2.0) | 4 (0.6) | 0.248 |
| High BMI | 9 (1.7) | 22 (4.1) | 0.058 | 3 (0.6) | 2 (0.4) | 0.920 |
| Hypertension | 130 (20.2) | 174 (27.1) | 0.189 | 74 (11.6) | 43 (6.8) | 0.977 |
| High FPG | 41 (6.5) | 61 (9.7) | 0.252 | 22 (3.6) | 16 (2.6) | 0.534 |
| High TG | 74 (11.8) | 11 (17.7) | 0.081 | 45 (7.3) | 25 (4.0) | 0.760 |
| High HDL | 34 (5.4) | 38 (6.1) | 0.737 | 68 (11.0) | 39 (6.3) | 0.827 |
Data shown are n (%); †Includes teaching and technical staff; ‡includes associate and full professors; HDL, high density lipoprotein cholesterol; p >0.05 statistically non-significant by χ2 test
Discussion
The present study demonstrates differences in the prevalence of MS and its components by age, gender and occupation among University workers. This is in concurrence with findings from other occupations [11, 12]. In the study, MS components occurred more frequently in male workers than females and increased with age [Table/Fig-2]. Hypertension and elevated TG were more common in males while hypertension and reduced HDL cholesterol were frequent in females [Table/Fig-3]. This gender disparity is attributed to age and endogenous sex hormones that mediate cholesterol metabolism in a sexually dimorphic manner [21]. Majority of the females were pre-menopausal and thus could have benefited from protective effects of estrogen on cardiovascular risks [22]. Moreover, males have more visceral adipose tissue that increases over expression of inflammatory markers associated with increased cardiovascular risks [23]. Other plausible factors may include dietary habits, known CVD risk factors such as cigarette smoking and alcohol consumption common in Chinese men than women [2, 3]. Of remarkable interest is the high prevalence of hypertension in both male and female workers which may suggest it as the main determinant for CVD risks in this working population.
The differential clustering of metabolic risks by gender is consistent with findings from the general population in China [7,8,16,17], however, prevalence was lower in University workers. Also, metabolic risks increased with age [Table/Fig-4], but declined after 49 years, an observation previously made on Taiwanese high-tech industry workers [24]. These two observations may be attributed to ‘healthy worker effect’ as workers with compromised health may choose to leave employment or retire early. Age and gender specific clustering pattern of metabolic risks supports the importance of tailoring nutrition and health intervention strategies to certain groups and not generalizing intervention programmes in the population [15]. Moreover, convincing evidence show that MS component combinations give differing contributions to CVD risks in populations, and between men and women [25]. Thus, identification of the most prevalent components of MS and distribution patterns in population groups is important in achieving better results in health intervention strategies [14].
Furthermore, occupation was observed to influence MS components as reported in other workplace [13]. After adjustment for age, administrative work associated with increased prevalence of hypertension and hyperglycemia in male workers, and hypertension in females [Table/Fig-5]. However, administrative females showed lower prevalence of elevated TG as compared with those in academics. Prevalence of obesity, low HDL and MS was not different between the two occupations in both sexes. In addition, there was no association between professional position and metabolic risks in academic workers [Table/Fig-6]. The differences in cardiovascular risks in administrative and academic work may be ascribed to nature of work in the two occupation groups. Administrative or office work involves sedentary behavior characterized by too much sitting while academic work may require movements to lecture buildings. Too much acute and chronic uninterrupted sitting is associated with impaired cardiometabolic risks independently of physical activity [26] due to low energy expenditure, reduced insulin action [27] and reduced skeletal muscle lipoprotein lipase activity [28]. In this regard, sedentary behaviours could potentially be targeted independently from physical activity and dietary intake interventions to reduce MS in the workplace.
The differences in metabolic risks in University workers may also be attributed to work related stress [29]. Although not evaluated in the current study, empirical studies in China report increased occupational stress among university employees related to work conditions [18,19]. It is expected that workers with greater work demands will have more stress which can cause them to adopt unhealthy lifestyles that are risk factors for CVDs. Therefore, identifying the most important cardiovascular risk factors in the workplace may be a useful step towards prevention, control and management of chronic diseases. A limitation of the study is the cross-sectional nature of the design which may not allow causal or directional inferences, and thus the need for a longitudinal study.
Conclusion
Prevalence of MS and its components was higher in male workers than females, increased with age, and were more common in administrative workers. The findings support the need for gender and occupation specific health interventions that promote employee health and help prevent CVDs and type II diabetes in the workplace.