The concept of beauty has changed over the centuries and differs from one population to another but it has always been a subject of interest and importance to people of all culture. The importance of facial esthetics and soft tissue relations in orthodontic treatment was emphasized by Angle as early as 1907 [1]. Angle pointed out that the soft tissues were an important factor in facial harmony. In the later part of the 19th century, Norman Kingsley emphasized the esthetic objectives of the orthodontic treatment. Throughout most of the 20th century, the idea persisted that occlusion was the primary objective of orthodontic treatment, with esthetics playing only a secondary role.
However, Good occlusion does not necessarily mean good facial balance. To accurately predict soft tissue response to hard tissue changes, orthodontist must understand soft tissue behavior in relation to orthodontic and orthopedic changes and must also take into consideration growth and development of various soft tissue traits. Many studies have demonstrated that soft tissues are a major factor in determining a patient’s final facial profile [2–5]. Hence to attain and preserve optimal facial attractiveness, it is important that the orthodontist conduct a thorough facial examination so that orthodontic correction will not adversely affect the normal facial traits and can achieve best facial esthetics [6].
Arnett and Bergman presented facial keys to orthodontic diagnosis and treatment planning [7]. They developed the STCA that emphasizes various soft tissue measurements which determines balance and harmony, in both the sagittal and vertical planes. It also emphasizes the importance of clinical examination of the patient, to correlate it with cephalometric findings.
Soft tissue cephalometric standards have been developed for various ethnic groups and most of them have shown differences between different ethnic and racial groups [8–14]. Normal values of the STCA for Mahabubnagar population of Andhra Pradesh will help in orthodontic diagnosis and treatment planning by providing specific values for the local population. As for all ethnic groups norms differ, our aim was to develop soft-tissue cephalometric norms for Mahabubnagar population to provide a holistic approach to orthodontic diagnosis and treatment planning.
Materials and Methodology
Sixty subjects (30 Males & 30 Females) from different part of Mahabubnagar in the age group 18-25 Years (Mean age 21.3 Years), with Angle’s Class I occlusion, minimal or no incisal crowding and spacing, and no history of previous orthodontic treatment; they displayed good facial aesthetics were selected at random for the study. The institutional review board (IRB) of the participating institution approved the protocol and informed consent delivered in the local language was obtained from all the patients.
Thorough medical history was taken regarding any previous major illness in childhood that might have effected growth. The patients having such history were not selected for the study. Individuals, younger than 18 years were also not chosen due to possible growth changes. Initially clinical examination was done in natural head position, with seated condyles and passive lips. Metallic markers were placed on different soft-tissue structures of the face (i.e. Soft tissue orbital rim, Soft tissue cheek bone, Subpupil and Nasal base) to relate them to the TVL as described by Arnett et al. All the lateral cephalograms were taken in natural head position using Kodak 8000 Dental System. Natural head position was recorded using a simple fluid level device designed based on Showfety KJ method [15]. All lateral cephalometric films were hand traced by taking parameters of STCA [7] on a transparent cellulose acetate sheet of 0.003″ thickness. Overall 46 measurements including 5 dentoskeletal, 6 soft tissue structures, 9 Facial lengths, 14 projections to TVL and 12 facial harmony parameters were used in this study. The radiographs were hand traced by two observers (JS and RMR) who were blinded to the primary aims of the study and standard error was calculated using unpaired t-test. Mean and standard deviation were calculated. The difference between males and females as well as Mahabubnagar population and Arnett et al., [7] norms were evaluated using student t-test.
Results
The measurements which are enumerated in [Table/Fig-1 and 2] to describe the soft tissue profile of Mahabubnagar population has been taken and mean and standard deviation was derived for males and female population. Paired t-test was used to calculate the error between the observers, unpaired t-test was used to compare Mahabubnagar population with that of the Arnett et al., norms and significance of the difference between the male and female samples was tested with the Student t-test.
Comparison of male and females with respect to different parameters by t test (Dentoskeletal factors, Soft tissue structure, Facial length and Projections to TVL) *p<0.05.
| Main parameter | Parameters | Male | Female | t-value | p-value |
|---|
| Mean | Std.Dev. | Mean | Std.Dev. |
|---|
| Dentoskeletal factors | Mx occlusal plane | 98.20 | 3.17 | 98.87 | 2.76 | -0.8688 | 0.3885 |
| Mx1 to Mx occlusal plane | 53.9333 | 3.8321 | 54.2667 | 4.0847 | -0.3260 | 0.7456 |
| Md1 to Md occlusal plane | 61.93 | 3.92 | 61.60 | 3.89 | 0.3305 | 0.7422 |
| Overjet | 2.52 | 0.50 | 2.70 | 0.45 | -1.4974 | 0.1397 |
| Overbite | 2.20 | 0.55 | 2.43 | 0.50 | -1.7117 | 0.0923 |
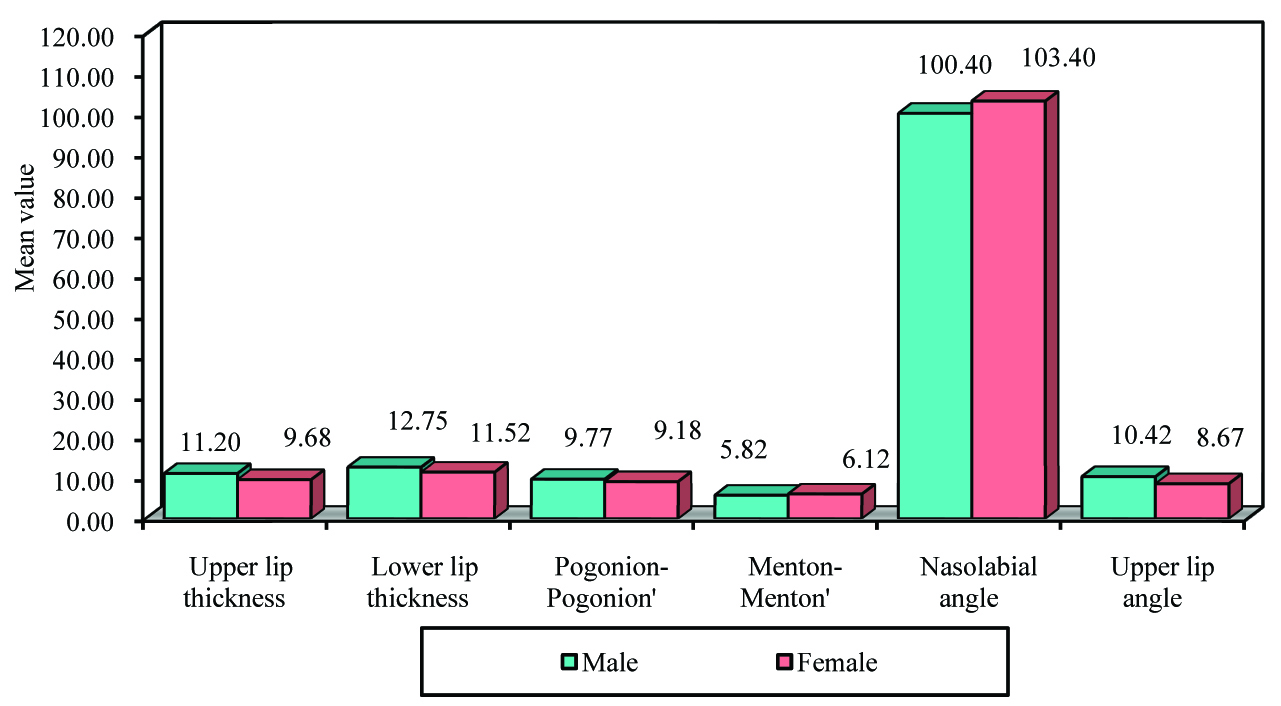
| Soft tissue structure | Upper lip thickness | 11.20 | 0.98 | 9.68 | 1.01 | 5.8974 | 0.0000* |
| Lower lip thickness | 12.75 | 1.09 | 11.52 | 0.88 | 4.8347 | 0.0000* |
| Pogonion-Pogonion’ | 9.77 | 1.00 | 9.18 | 1.21 | 2.0404 | 0.0459* |
| Menton-Menton’ | 5.82 | 1.05 | 6.12 | 1.23 | -1.0145 | 0.3146 |
| Nasolabial angle | 100.4000 | 1.5942 | 103.4000 | 5.9457 | -2.6693 | 0.0098* |
| Upper lip angle | 10.4167 | 2.4778 | 8.6667 | 1.2888 | 3.4320 | 0.0011* |
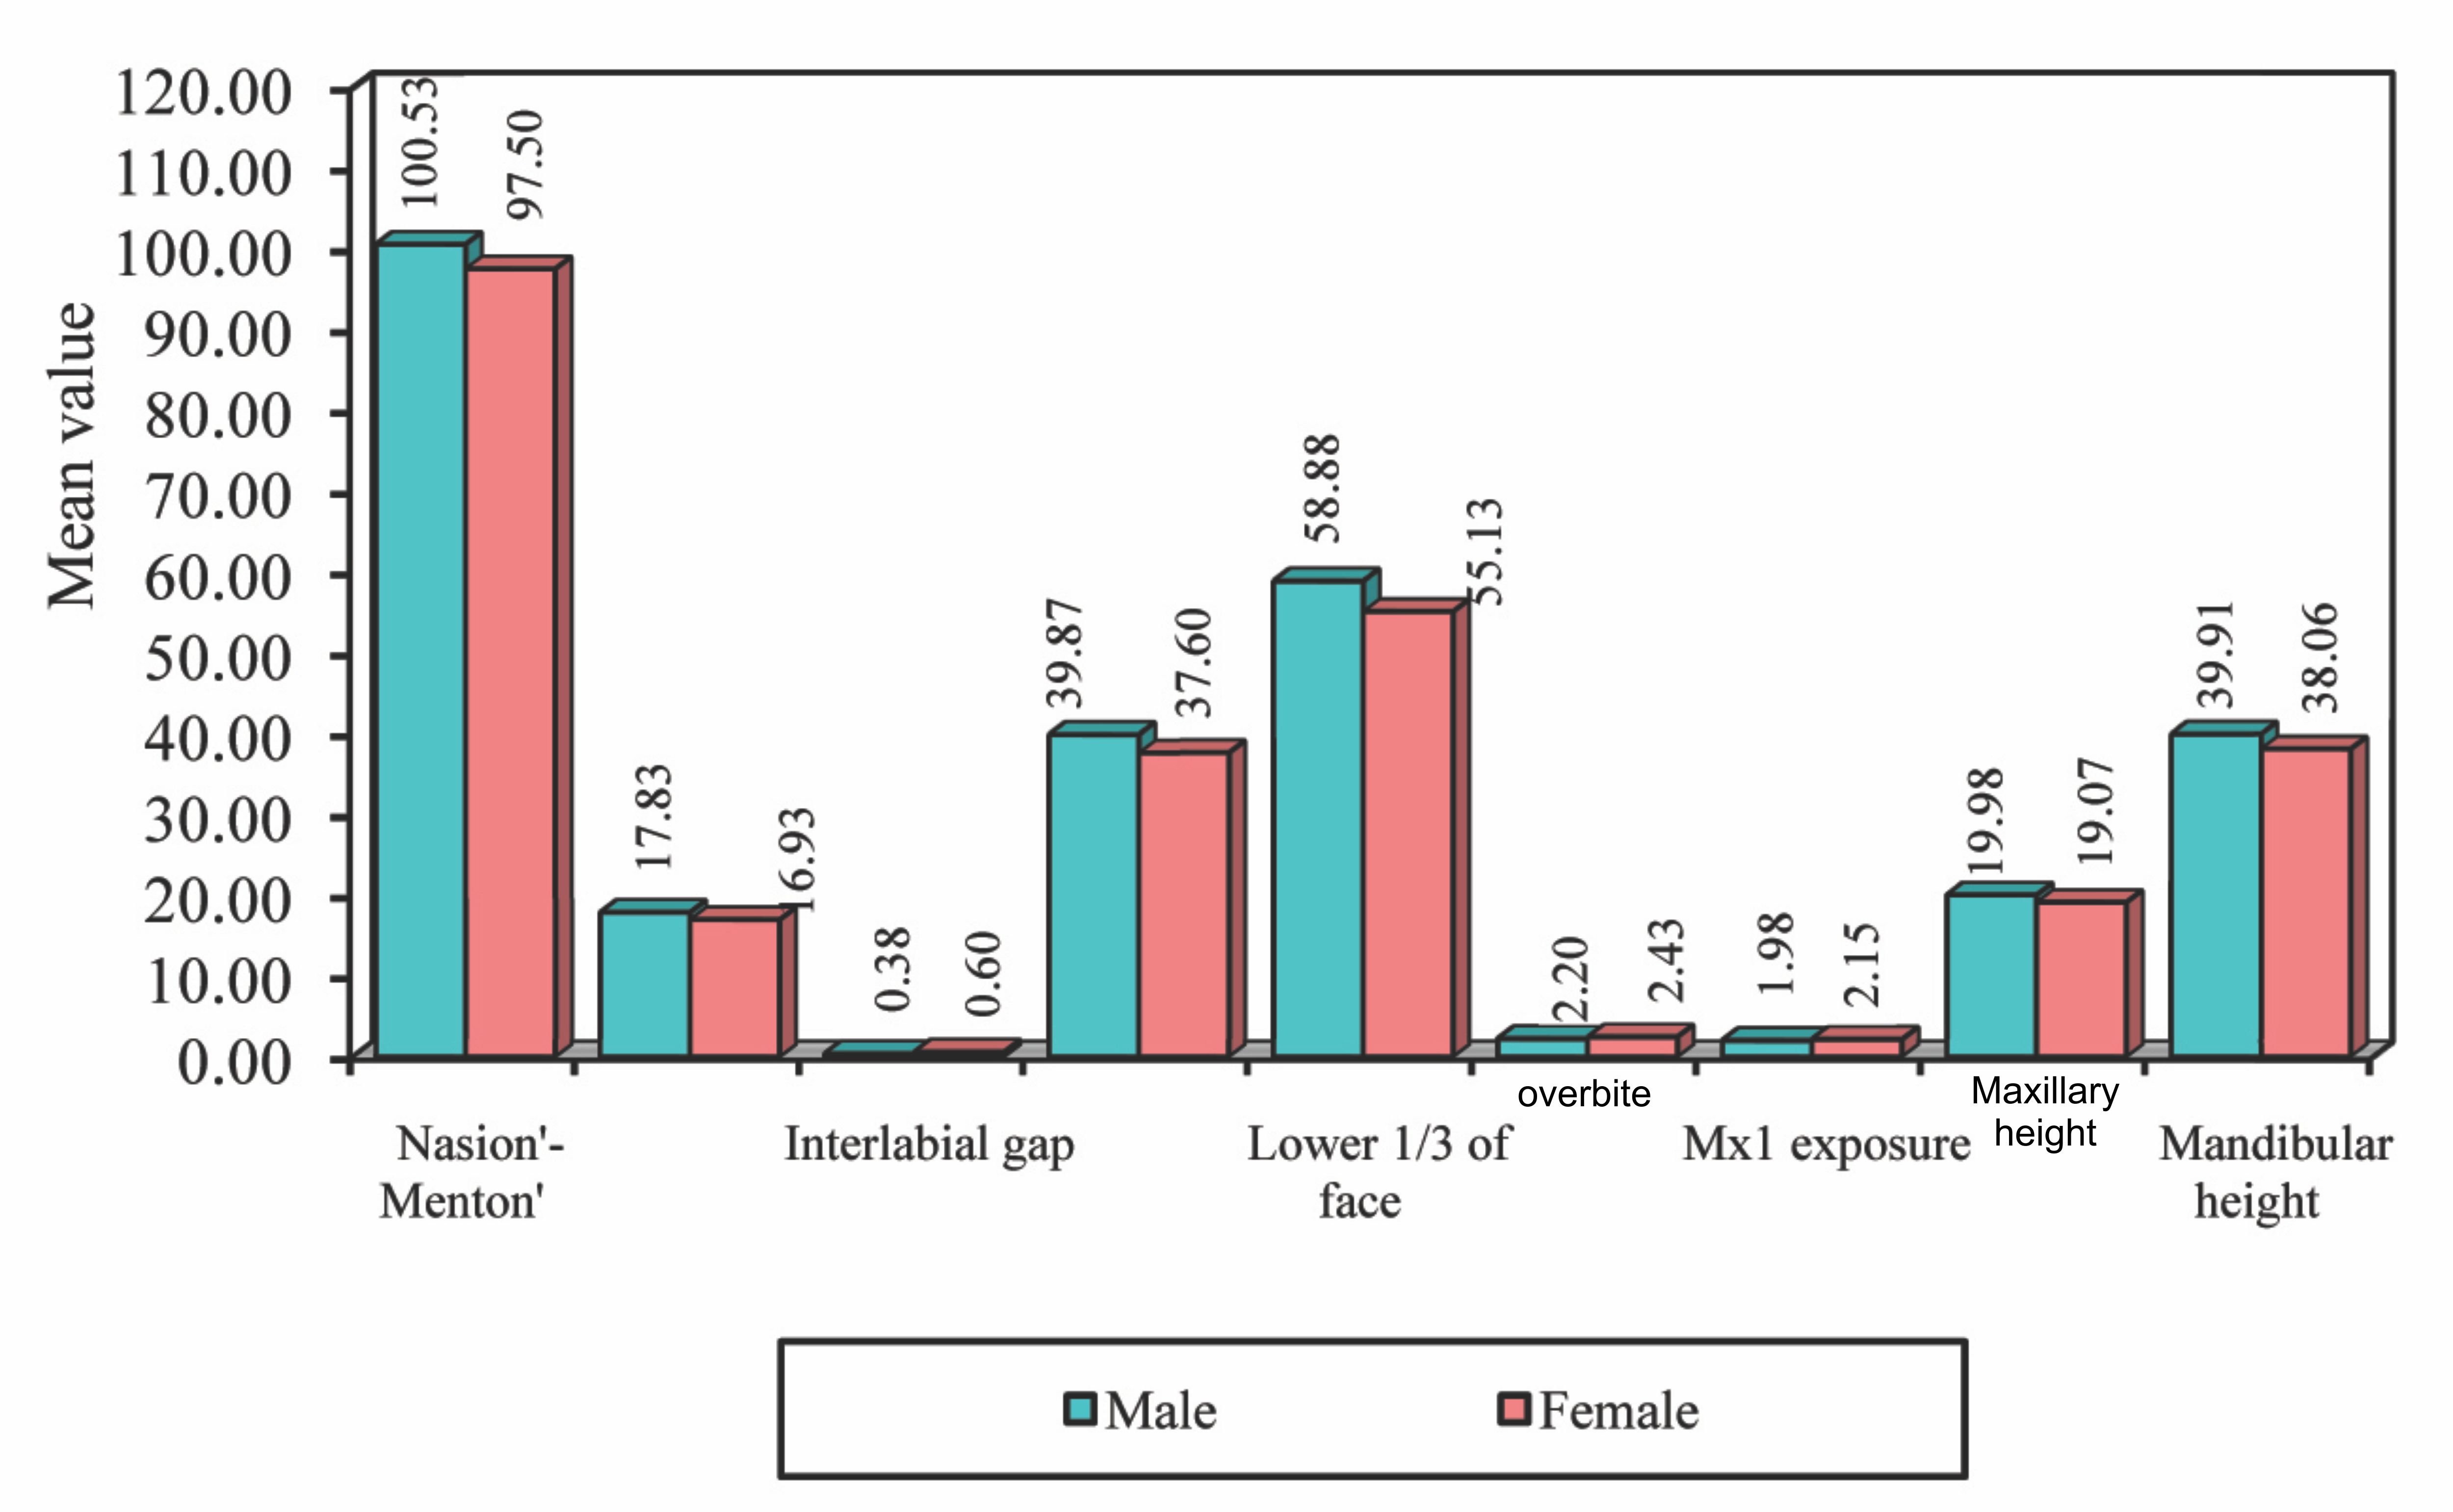
| Facial length | Nasion’-Menton’ | 100.53 | 3.20 | 97.50 | 3.70 | 3.3939 | 0.0012* |
| Upper lip length | 17.83 | 1.32 | 16.93 | 1.86 | 2.1636 | 0.0346* |
| Interlabial gap | 0.38 | 0.58 | 0.60 | 0.97 | -1.0500 | 0.2981 |
| Lower lip length | 39.87 | 2.39 | 37.60 | 1.91 | 4.0563 | 0.0002* |
| Lower 1/3 of face | 58.88 | 2.20 | 55.13 | 3.40 | 5.0681 | 0.0000* |
| Overbite | 2.20 | 0.55 | 2.43 | 0.50 | -1.7117 | 0.0923 |
| Mx1 exposure | 1.98 | 0.90 | 2.15 | 0.80 | -0.7602 | 0.4502 |
| Maxillary height | 19.98 | 1.42 | 19.07 | 2.04 | 2.0203 | 0.0480* |
| Mandibular height | 39.91 | 2.3382 | 38.06 | 1.8087 | 3.4278 | 0.0011* |
| Projections to TVL | Glabella | -4.73 | 1.42 | -4.67 | 2.10 | -0.1442 | 0.8859 |
| Orbital rims | -18.2833 | 1.7844 | -16.9167 | 1.8340 | -2.9254 | 0.0049* |
| Cheek bone | -20.9000 | 1.8773 | -18.3167 | 1.9497 | -5.2278 | 0.0000* |
| Subpupil | -15.55 | 1.60 | -12.48 | 1.51 | -7.6334 | 0.0000* |
| Alar base | -11.0167 | 1.4767 | -9.1833 | 1.1706 | -5.3287 | 0.0000* |
| Nasal projection | 11.02 | 1.16 | 10.98 | 1.22 | 0.1083 | 0.9142 |
| Subnasale | 0.00 | 0.00 | 0.00 | 0.00 | 0.0000 | 1.0000 |
| A point’ | -1.60 | 0.56 | -1.42 | 0.59 | -1.2328 | 0.2226 |
| Upper lip anterior | 1.47 | 1.19 | 1.13 | 0.89 | 1.2296 | 0.2238 |
| Mx1 | -10.13 | 1.27 | -8.77 | 1.54 | -3.7536 | 0.0004* |
| Md1 | -12.65 | 1.29 | -11.50 | 1.53 | -3.1416 | 0.0026* |
| Lower lip anterior | -0.48 | 1.86 | -0.52 | 1.64 | 0.0736 | 0.9416 |
| B point’ | -8.55 | 2.14 | -7.13 | 1.61 | -2.8963 | 0.0053* |
| Pogonion’ | -7.25 | 1.88 | -6.02 | 2.15 | -2.3674 | 0.0213* |
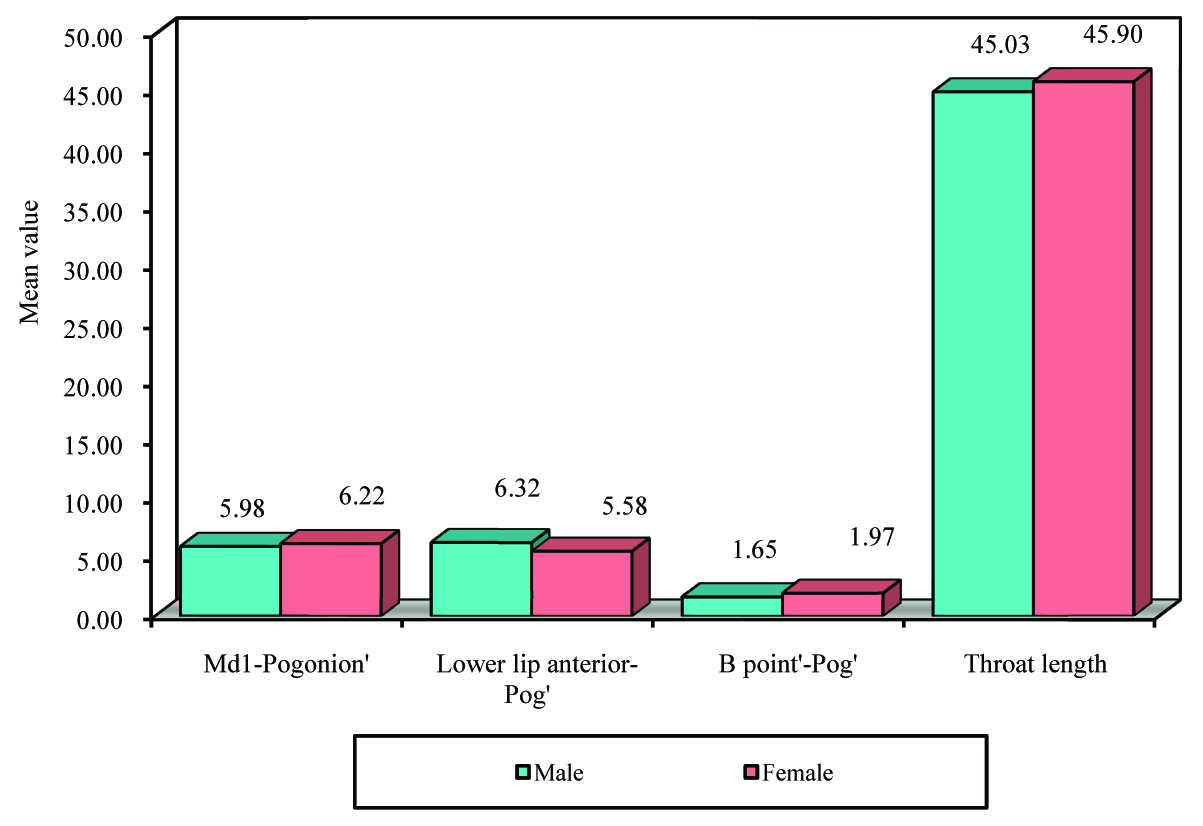
Comparison of male and females with respect to different parameters by t test (Facial harmony values)
| Facial harmony-Intramandibular relations | Md1-Pogonion’ | 5.98 | 1.68 | 6.22 | 2.11 | -0.4743 | 0.6371 |
| Lower lip anterior-Pog’ | 6.32 | 1.30 | 5.58 | 1.59 | 1.9600 | 0.0548 |
| B point’-Pog’ | 1.65 | 0.82 | 1.97 | 0.96 | -1.3765 | 0.1739 |
| Throat length | 45.03 | 2.72 | 45.90 | 3.41 | -1.0879 | 0.2812 |
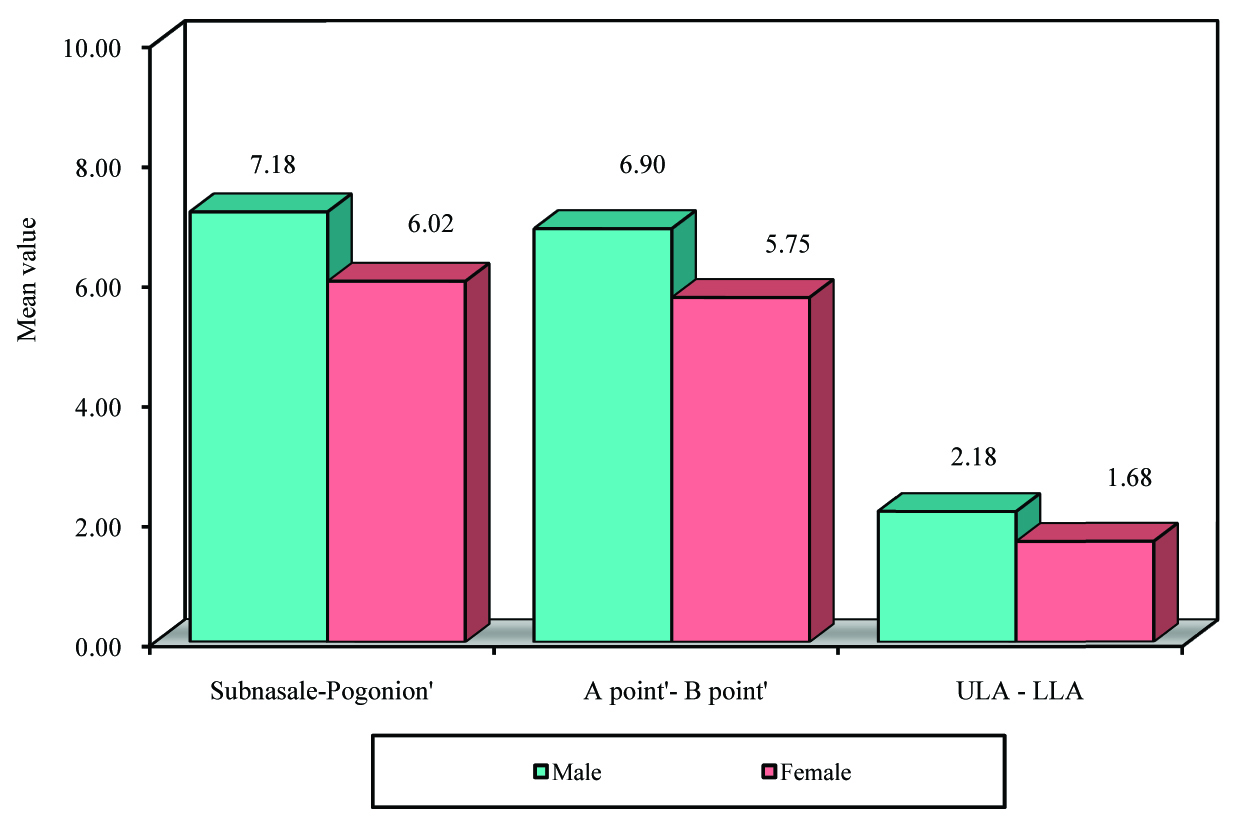
| Interjaw relations | Subnasale-Pogonion’ | 7.18 | 1.64 | 6.02 | 2.15 | 2.3635 | 0.0215* |
| A point’- B point’ | 6.90 | 1.69 | 5.75 | 1.70 | 2.6321 | 0.0109* |
| ULA - LLA | 2.18 | 0.85 | 1.68 | 1.02 | 2.0655 | 0.0434* |
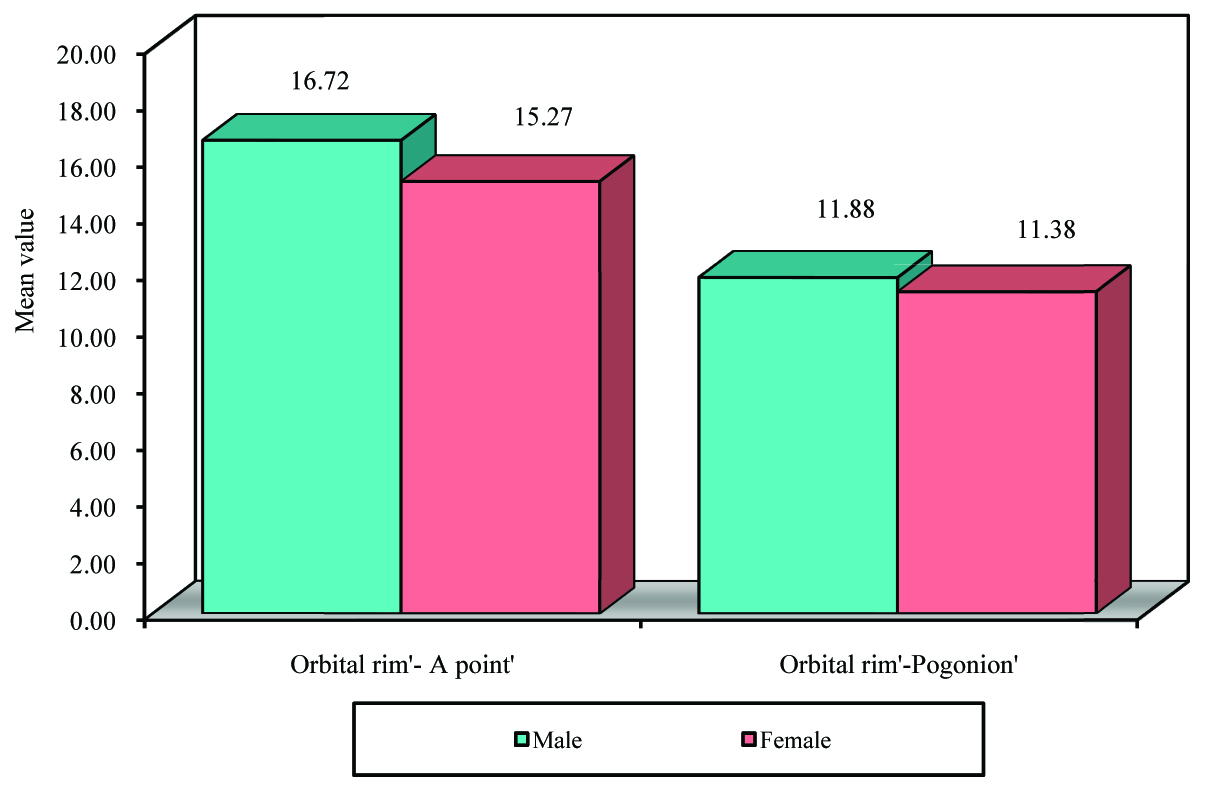
| Orbit to jaws | Orbital rim’- A point’ | 16.72 | 1.65 | 15.27 | 2.06 | 3.0077 | 0.0039* |
| Orbital rim’-Pogonion’ | 11.88 | 1.63 | 11.38 | 2.05 | 1.0476 | 0.2992 |
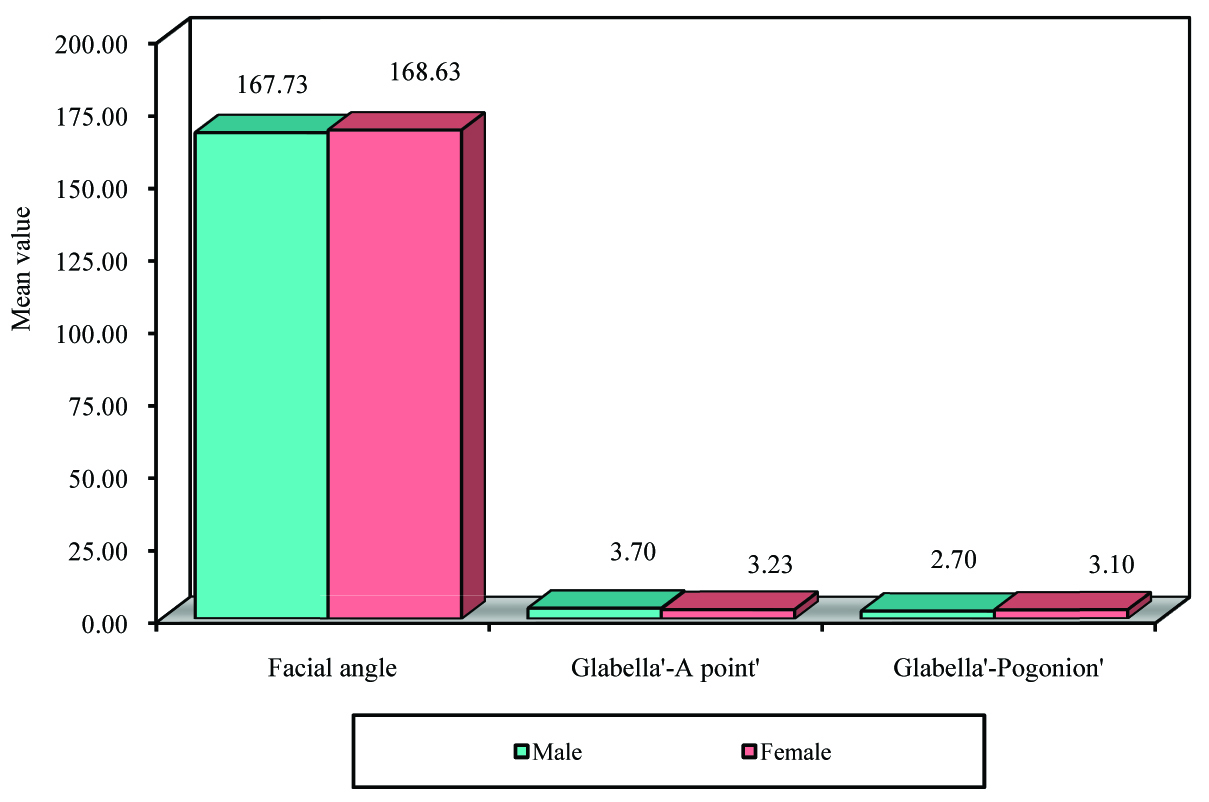
| Full facial balance | Facial angle | 167.73 | 3.51 | 168.63 | 4.83 | -0.8252 | 0.4126 |
| Glabella’-A point’ | 3.70 | 1.21 | 3.23 | 1.74 | 1.2088 | 0.2316 |
| Glabella’-Pogonion’ | 2.70 | 1.20 | 3.10 | 2.93 | -0.6928 | 0.4912 |
In Dentoskeletal factors, there was no statistically difference between the sexes. Soft-tissue measurements indicated men were having increased thickness than women and also more acute nasolabial angles (100.40°) than women (103.4000°). All the facial lengths showed that males (nasion’ to menton’,100.53) were having longer faces than female (97.50). Interlabial gap, maxillary incisor exposure and overbite were greater in women than the men; all these measurements were statistically significant.
Statistically significant differences, were also noted between the sexes in midface and the lower third structures of the face in the projections to TVL. In projection to TVL, orbital rims, cheekbone, subpupil, and alar base to TVL were higher in the men. The nasal projection was higher in the men (11.02mm) when compared with the women (10.98 mm) whereas in the lower third of the face, men were having protrusive lips (upper-lip anterior, 1.47 mm; lower-lip anterior, -0.48 mm).
Discussion
Our findings are discussed under the 5 headings of the STCA of Arnett et al., dentoskeletal factors, soft-tissue structures, facial lengths, projections to TVL, and facial harmony. In each group, comparisons were drawn and analyzed between the male and female samples and the original STCA.
Of the Dentoskeletal factor measurements, The male and female values for Mx occlusal plane angle, Mx1 to Mx occlusal plane, Md1 to Md occlusal plane within Mahabubnagar population showed no statistically significant difference [Table/Fig-3]. Our samples had more proclined upper and lower anteriors when compared to Arnett et al., population for both the sexes, it might be because of ethnic reasons.
Of the Soft tissue measurements there was significant differences between the sexes; males have higher values for upper lip thickness, lower lip thickness, pogonion-pogonion’, menton-menton’ and upper lip angle except for nasolabial angle then females [Table/Fig-4]. The nasolabial angle was higher in females. In comparison with the standard values of the STCA, the means and standard deviation of all the parameters were found to be lower. This suggests that our subjects have thinner soft tissue structures than Arnett et al., population.
Comparison of male and females with respect to Dentoskeletal factors
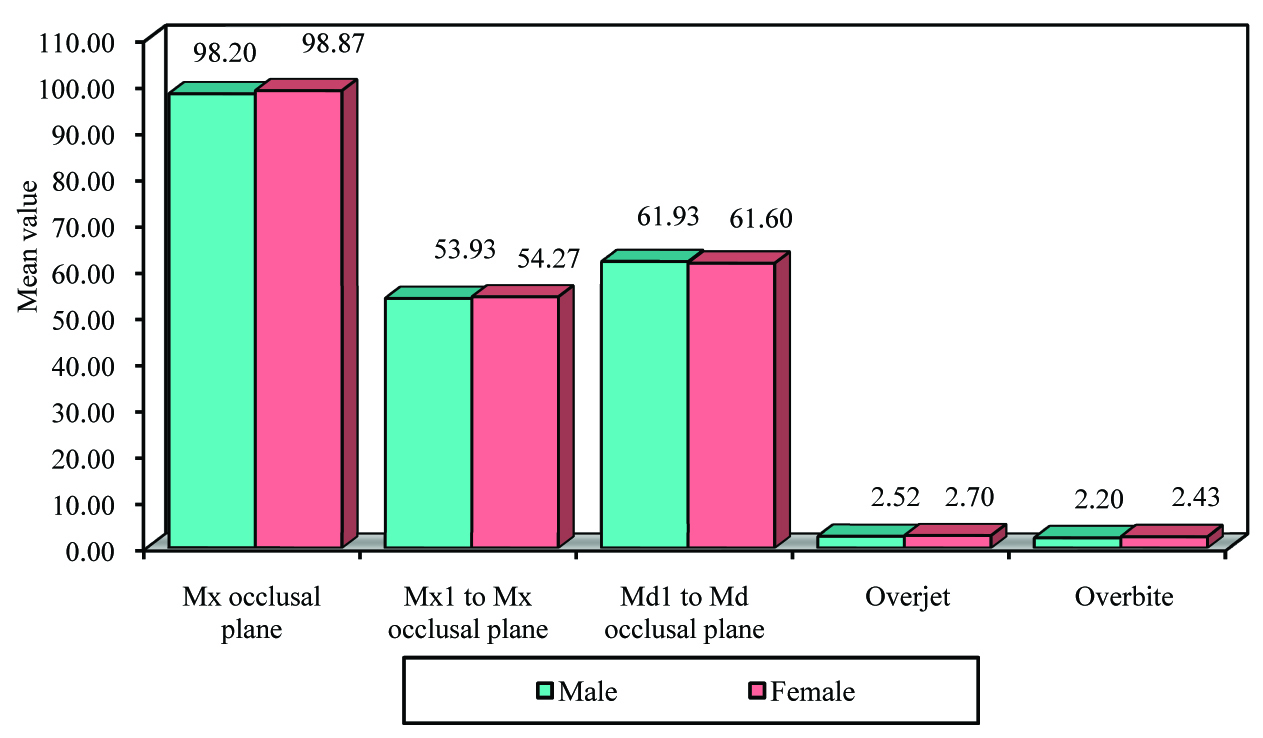
Comparison of male and females with respect to Soft tissue structure factors
In regard to Facial length, the Mahabubnagar population showed statistically significant gender differences in measurements of the Nasion’-Menton’, Upper lip length, Lower lip length, Lower 1/3 of face, Maxillary height, Mandibular height with values greater in males than in females. However females had a greater Interlabial gap, Overbite and Mx1 exposure than males [Table/Fig-5]. Study carried out by Kalha AS et al., [16] on south Indian population showed similar findings. In a study on soft tissue profiles by Scheideman et al., [17] also reported increased lower face height in male subjects. This significant difference in facial lengths between men and women might be critical in treatment planning because these differences can be indications to increase or decrease face height during surgical procedures. The presence and location of vertical abnormalities is indicated by assessing maxillary height, mandibular height, upper incisor exposure, and overbite.
Comparison of male and females with respect to Facial length factors
TVL projections are anteroposterior measurements of soft tissue and represent the sum of the dentoskeletal position plus the soft tissue thickness overlying that hard tissue landmark. Statistically significant gender differences were also found in the glabella, orbital rim, cheek bone, subpupil and alar base values and maxillary incisor tip. In the midface region, males had more retruded or deep- set structures as shown by orbital rim, cheek bone, subpupil, and alar base markers to TVL (more negative to TVL) compared with the females [Table/Fig-6]. This might indicate midface deficiency in the males sample and females have more prominent midface.
Comparison of male and females with respect to Projections to TVL factors
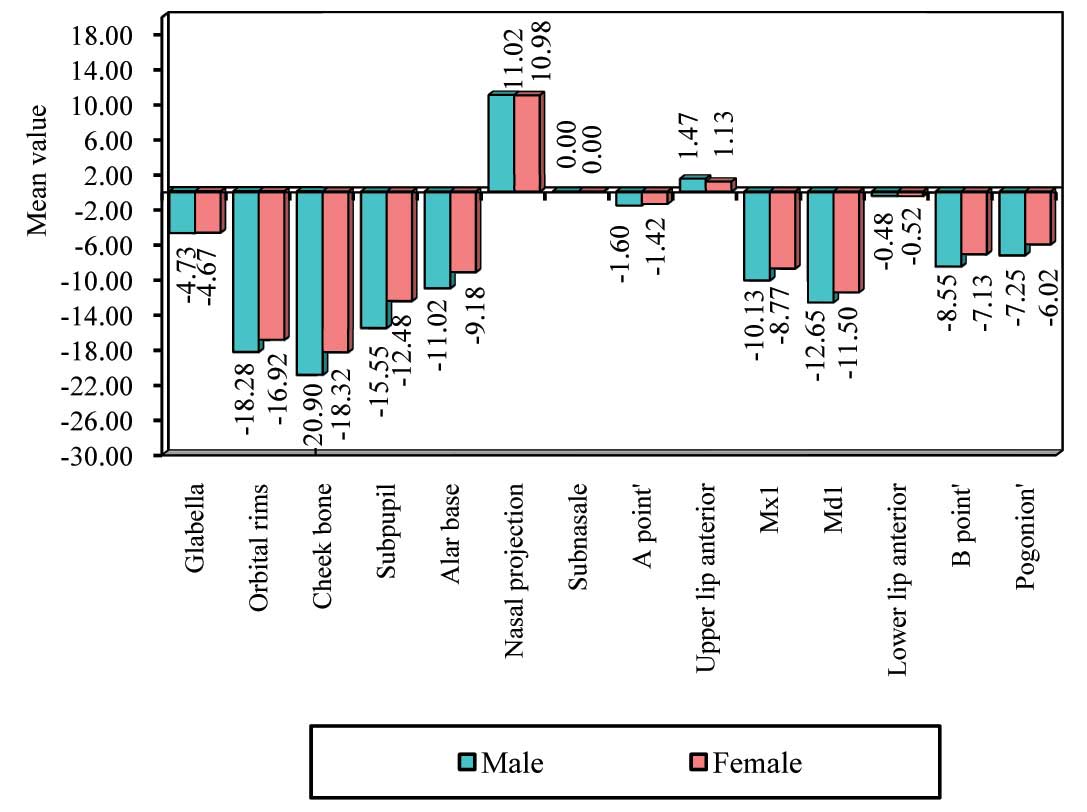
In the lower third of the face, males had more protrusive lips as shown by upper-lip and lower-lip anterior to TVL (ULA: Males 1.47±.19 Females 1.13±0.89 LLA: Males –0.48±1.86 Females: –0.52±1.64). This can be mainly because of the thicker soft-tissue structures in the males. Females had more proclined maxillary and mandibular anterior teeth as shown by Mx1 and Md1 to TVL. The projection value for the nose was slightly increased in males than females. This might as well contribute to the increased facial convexity in Mahabubnagar males.
The Harmony values were obtained to measure the balance and harmony of facial structures. Harmony is the position of each landmark relative to other landmarks that determines facial balance. These values represent the horizontal distance between two landmarks measured perpendicular to the TVL. These measurements basically examine four areas: intramandibular relations, interjaw relations, orbits to jaw and total face.
In Intramandibular relationships, the mandibular central incisor to soft-tissue pogonion and soft-tissue B’-point to soft tissue pogonion’ showed mild statistically significant difference between males and females. There was mild increase in mean values for mandibular central incisor to soft-tissue pogonion and soft-tissue B’-point to soft tissue pogonion’ in females suggest slightly more upright mandibular incisors than in males of Mahabubnagar population [Table/Fig-7]. Moreover, the mean values of the mandibular central incisor to soft-tissue pogonion and soft-tissue B’-point to soft tissue pogonion’ were lower in the present subjects compared with the mean STCA value (p-value = <0.0001), suggesting proclined mandibular incisor in Mahabubnagar samples. Increased values in STCA also suggests hard tissue pogonion enlargement, or increased thickness of the soft tissue pogonion.
Comparison of male and females with respect to Facial harmony-Intramandibular relations factors
Interjaw relations directly controls the lower one third of facial esthetics. Values indicate the interrelationship between the base of the maxilla (Sn) to chin (Pog’), soft tissue B’ to soft tissue A’ and upper to lower lips. Interjaw relations showed slight mandibular retrusion or recessive lower face in males compared to females (increased subnasale-pogonion’, A point’– B point’ and ULA – LLA values) which might be the reason for increased convexity in males [Table/Fig-8]. On comparison to standard STCA norms Subnasale-Pogonion’ and A point’– B point’ showed statistically decreased values in both males and females indicating decreased recessive lower face in white population which was also supported by increased facial angle.
Comparison of male and females with respect to Inter jaw relations factors
Measurements of the orbital rim to the jaw also showed a statistically significant gender difference (p-value = <0.0001), with males having a more retruded orbital rim in relation to the 2 jaws than females within the population [Table/Fig-9]. Deficient orbital rims according to norms dictate maxillary advancement when all the other factors are normal. On comparing with Arnett et al., norms, both males and females of Mahabubnagar population showed highly significant difference (p-value = <0.0001) with decreased value suggesting more midface deficiency in white population.
Comparison of male and females with respect to Orbit to jaws factors
The last part of the facial harmony evaluation assesses the upper face, midface, and chin which are related via the facial angle (G’-Sn-Pog’). The forehead is compared to two specific points, the upper jaw (G’-A’) and chin (G’-Pog’). Arnett et al., [7] indicated that these three measurements give the broad picture of facial balance. The parameter of full facial balance i.e facial angle shown mildly statistically difference between the sexes. The mean facial angle of the females (168.63°±4.83), was higher than that of males (167.73°±3.51) suggesting that males have more convex profiles within the population [Table/Fig-10]. On comparison with standard STCA norms both males and females of local population showed increased convex profiles.
Comparison of male and females with respect to Full facial balance factors *p<0.05
Conclusion
From this study the following observations were apparent: The most of the measurements of Mahabubnagar population were different to that of Arnett et al., norms and within the Mahabubnagar population males had thicker soft tissue structures, acute nasolabial angle, increased facial lengths and heights, increased midface deficiency, recessive lower face, more convex profile and less upright mandibular incisors than females. The norms established can be used for diagnosing the soft tissues for this particular population.