According to WHO 2002, an estimated 10% of the world’s population, some 600 million people, experience some form of impairment or disability [1]. About 80% of the people with disabilities live in developing countries. The majority of disabled persons are poor and experience difficulties in accessing basic health services, including rehabilitation services. In India, total population of persons with disabilities is pegged around 2.1% of the total population by the Census (2001). Recently in 2011, the United Nation estimated that 10% of the population has a disability; there are about 120 million people with disabilities in India [2].
Various comparative studies between different handicapping conditions have reported that mentally challenged children have high prevalence of oral co-morbidity, especially caries attributed to their difficulty in maintaining good oral hygiene, poor muscular co-ordination, muscle weakness, food consistency, sugared beverages and long-term oral medications interfering with routine hygiene procedures [3,4]. Despite the fact that many children are handicapped in India, very little work has been done in relation to prevention and treatment of dental caries in this deprived population.
Mentally challenged and visually impaired individuals should be considered as a high risk group which warrants “high risk strategy for prevention”. Provision of early and intense preventive interventions for dental caries can avoid the complex treatment and complications of the advanced disease state. This is cost effective and ethical too.
Caries risk assessment is a key element in the comprehensive management of the disease and consequently, has gained a great deal of attention in the recent literature. As dental caries has a multifactorial etiology, the procedure requires that information on demographic, social, behavior, and biological factors is taken together to form a caries risk profile or risk category. Cariogram is the only such model which can evaluate several factors such as host response, pathogens and cariogenicity of the diet involved in the development of caries and can give an individual interpretation of caries risk. Cariogram is an interactive computer programme conceptualized by Dr. Bratthall in 1997. It can help in the following way: Firstly, in this, various risk factors can be identified systematically; secondly, these factors are analysed and in doing so, the most important risk factors for the particular individual are singled out. Thus, it is useful in assessing caries risk and identifying high risk individuals and prescribing appropriate preventive program based on the risk [5].
As against this background a study has been conducted to assess the risk of caries among mentally challenged and visually impaired individuals in comparison to the normal individuals of Udaipur (India) using the Cariogram model and also to assess the contribution of diet, bacteria, circumstances and susceptibility sectors towards caries risk in the Cariogram model.
Methodology
Study Design, Study Setting and Study Population
A cross sectional study was conducted among mentally challenged (n=40) and visually impaired (n=60) subjects attending a special school (Prayas Sansthan Residential School) in comparison to the normal individuals (n=60) accompanying the patients attending the Outpatient Department of Pacific Dental College and Hospital, Udaipur city, India, during March-April 2012. The participants were aged 7-36 years (mean 22.52±6.42). Subjects on antibiotic therapy were excluded from the study.
Ethical Considerations
The study protocol was reviewed by the Institutional Ethical Committee (PDC/123/2011-12 Dated 31.10.2011). An official permission to conduct the study, among the mentally challenged and visually impaired individuals, was obtained from the school authority and an informed consent from their parents/ guardians/ caretakers/ individuals themselves before the start of the examination.
Training and Calibration
Before the commencement of the study, the examiner was trained and calibrated by the experienced professor in the Department of Public Health Dentistry to ensure uniform interpretations, understanding application of the codes, the criteria for the disease to be observed and recorded and to ensure consistent examination. The intra examiner reliability for Decayed Missing Filled Teeth (DMFT) index [6] and Modified Plaque index [7] using Kappa statistics was found to be 89% and 86% respectively.
Pilot Survey
A pilot study was conducted on 10 subjects from each group to determine the feasibility of the study, the time required for examination of each subject, to get acquainted with the laboratory procedure of salivary analysis and for sample size calculation. On an average it took 7-10 minutes for the interview and examination and 5-8 minutes for saliva collection (normal children took lesser time). Depending on the prevalence obtained in the pilot study (71% - mentally challenged; 66% - visually impaired and 40% - normal), 95% confidence level, 5% allowable error and 80% power, the sample size was estimated at 39 and 60 for mentally challenged and normal group respectively.
Sampling Technique
Udaipur has three special schools, one mentally challenged (n=51) and two blind schools (n=103) out of which one blind school was randomly selected along with the mentally challenged school. The study subjects in the mentally challenged, visually impaired and normal groups were selected using the random sampling procedure.
Methodology
Data on variables of Cariogram model were congregated by means of an interviewer-administered questionnaire, clinical examination, collection of saliva and microbiological analysis. Interview was used to gather information on socio-demographic data (name, age, sex and medical history), diet frequency (number of intakes per day) and fluoride exposure (brand of their toothpaste and any other oral hygiene aids used). Clinical examination included caries experience and plaque measurement using DMFT index [6] and Modified Plaque index [7].
Saliva collection was scheduled in the morning hours (between 10.00 - 11.30 AM) to maintain circadian rhythm. All the participants were refrained from eating for one hour before collection of saliva. Since the participants of mentally challenged group had lower Intelligent Quotient (IQ) than normal, understanding the instructions and performing the procedure of collecting stimulated saliva was difficult. The simplest method for stimulating saliva was followed which involved tongue, cheek or lip movements without the use of an external stimulus [8]. The participants were made to spit in a funnel connected to the test-tube held near the mouth. Flow rate was calculated by dividing the volume of saliva in millilitres by the duration of collection period and was expressed as ml/min. Colorimetric method using Indikrom pH paper was used to estimate the buffer capacity of saliva.
Microbiological Analysis
Using an inoculation loop, salivary sample was streaked on MSB agar and Rogosa SL agar which are selective for mutans streptococci and lactobacilli respectively. The MSB agar plates were incubated in an autoclave for 48 hours at 37 degree Celsius. Similar procedures were followed for Rogosa SL plates, except that they were incubated in an anaerobic jar for 96 hours. Plates were opened after 48 and 96 hours, respectively and the colony count were assessed using electron microscope to evaluate the growth of mutans streptococci and lactobacilli which were expressed as number of CFU (Colony Forming Units) per ml of saliva.
Assessment of Caries Risk Profile Using Cariogram Model
For each participant, the Cariogram parameters were given a score according to the pre-determined scales for each factor. High risk was entered under country, as India is a developing country and individuals are more prone to caries. Similarly for group, high risk was entered for special group and low risk for normal group. These scores were then entered into the Cariogram computer program to obtain the individual caries risk profile. According to weighted formula, the computer program presents the pie diagram in which bacteria (based on amount of plaque and mutans streptococci), diet (based on diet content and frequency), susceptibility (based on fluoride programme, saliva secretion and saliva buffer capacity) and circumstances (based on past caries experience and general disease) as factors are represented by the sectors with percentages. In addition, there is a sector which represents the chance of avoiding caries and if this sector is large the caries risk is low and vice versa.
Statistical Analysis
The recorded data was exported to SPSS version 15.0 (SPSS Inc., Chicago, Illinois, USA) and was statistically analysed. The score for related general disease was standardized as ‘1’, among mentally challenged subjects, which indicated that the participants of this group had systemic illness that contributes moderately to caries risk. Descriptive statistics included computation of percentages. Chi-square (χ2) was used to compare proportions for categorical data. Fisher’s exact test was used when the expected number of subjects within a category was sufficiently small for comparison between the groups. This analysis was followed by Marascuilo procedure for within group comparison. Stepwise multiple linear regression for each group adjusted by age was applied to estimate the relationship between caries risk as dependent variable and other factors as independent variables. For all tests, confidence interval and p value were set at 95% and ≤0.05 respectively.
Results
The comparative assessment of study participants based on parameters used in Cariogram model is as shown in [Table/Fig-1]. Majority of the participants (32.5%) in mentally challenged showed moderate caries experience whereas maximum percentage of visually impaired (38.4%) showed low caries experience. The results of these 2 groups were significantly different (p=0.002) from normal group among which majority showed very low (43.3%) caries experience. Mentally challenged group had high lactobacilli count among most of the participants (37.5%). The proportion of participants in mentally challenged group with very low, low and moderate, lactobacilli count were 10%, 27.5%, and 25%, respectively. Moderate (31.7%) lactobacilli count was present in majority of the participants of visually impaired group. The proportion of participants with lowest lactobacilli count was significantly high (61.7%) in the normal group (p=0.001) compared to the other 2 groups (mentally challenged and visually impaired). Statistically non significant difference (p=0.799) was observed between the groups. However, the highest proportion of participants had 3 meals/day among all the 3 groups [mentally challenged: (n=29; 72.5%), visually impaired: (n=44; 73.3%) and normal: (n=40; 66.7%). None of the participants had more than 7 meals/day. Half of the participants (50%) in mentally challenged group had high plaque amount score followed by the visually impaired (25%) and normal (15%) subjects. The results showed that all the 3 groups were significantly different (p=0.013) from each other with normal group eliciting the least plaque amount score. Maximum number of participants among mentally challenged [n=11(27.5%)], visually impaired [n=17 (28.3%)] and normal [n=31 (51.7%)] had very low mutans count. Statistically significant difference (p=0.018) evidenced a greater proportion of normal individuals (51.7%) with very low mutans streptococci count. The proportion of participants with high mutans streptococci count was lowest among all the groups. Most of the participants (80% in mentally challenged, 71.7% in visually impaired and 78.3% in normal group) were exposed to fluoride in the form of toothpastes only. Additional fluorides were used by very few participants but there was no statistically significant difference between the groups (p=0.672). Most of the participants (32.5% in mentally challenged, 38.4% in visually impaired and 48.4% in normal group) had normal amount of saliva secretion. Only few participants showed saliva secretion of less than 0.5 ml. Intergroup comparison revealed statistically non significant differences (p=0.769). Reduced buffer capacity was observed among majority of study participants (42.5% in mentally challenged, 53.3% visually impaired and 50% in normal group). A significantly higher proportion of mentally challenged subjects (n= 17; 42.5%) revealed adequate buffer capacity.
Comparative assessment of study participants based on parameters used in Cariogram model.
| Scores | Mentally challenged n (%) | Visually impaired n (%) | Normal n (%) | p-value |
|---|
| Caries experience Score | | | | |
| 0=very low | 6 (15)a | 8 (13.3)a | 26 (43.3)ab | |
| 1=low | 10 (25) | 23 (38.4) | 18 (30) | |
| 2=moderate | 13 (32.5) | 15 (25) | 9 (15) | 0.002* |
| 3=high | 11 (27.5) | 14 (23.3) | 7 (11.7) | |
| Diet contents (lactobacillus count) Score | | | | |
| 0=very low | 4 (10)a | 14 (23.3)a | 37 (61.7)ab | |
| 1=low | 11 (27.5) | 16 (26.7) | 8 (13.3) | |
| 2=moderate | 10 (25) | 19 (31.7) | 7 (11.7) | 0.001* |
| 3=high | 15 (37.5) | 11 (18.3) | 8 (13.3) | |
| Diet frequency | | | | |
| 0=3 meals/day | 29 (72.5) | 44 (73.3) | 40 (66.7) | |
| 1=maximum 5 meals/ day | 9 (22.5) | 14 (23.3) | 15 (25) | |
| 2=maximum 7 meals/ day | 2 (5) | 2 (3.4) | 5 (8.3) | 0.779 |
| 3=more than 7 meals/ day | 0 | 0 | 0 | |
| Plaque amount score | | | | |
| 0=very low | 3 (7.5)a | 10 (16.6)b | 11 (18.3)c | |
| 1=low | 8 (20) | 16 (26.7) | 22 (36.7) | |
| 2=moderate | 9 (22.5) | 19 (31.7) | 18 (30) | 0.013* |
| 3=high | 20 (50) | 15 (25) | 9 (15) | |
| Mutans streptococci score | | | | |
| 0=very low | 11 (27.5)a | 17 (28.3)a | 31 (51.7)ab | |
| 1=low | 8 (20) | 13 (21.7) | 16 (26.7) | |
| 2=moderate | 15 (37.5) | 19 (31.7) | 7 (11.6) | 0.018* |
| 3=high | 6 (15) | 11 (18.3) | 6 (10) | |
| Fluoride program | | | | |
| 0=maximum use of fluorides | 2 (5) | 6 (10) | 2 (3.4) | |
| 1=additional fluorides | 5 (12.5) | 8 (13.3) | 10 (16.6) | |
| 2=fluorides in toothpaste only | 32 (80) | 43 (71.7) | 47 (78.3) | 0.672 |
| 3=no fluorides | 1 (2.5) | 3 (5) | 1 (1.7) | |
| Saliva secretion amount | | | | |
| 0=normal | 13 (32.5) | 23 (38.4) | 29 (48.4) | |
| 1=low (more than 0.9 to 1.1 ml) | 11 (27.5) | 17 (28.3) | 14 (23.3) | |
| 2=low (0.5 to 0.9 ml) | 9 (22.5) | 13 (21.7) | 11 (18.3) | 0.769 |
| 3=less than 0.5 ml | 7 (17.5) | 7 (11.6) | 6 (10) | |
| Saliva buffer capacity | | | | |
| 0=adequate | 17 (42.5)ab | 10 (16.7)a | 12 (20)a | |
| 1=reduced | 17 (42.5) | 32 (53.3) | 33 (50) | 0.035* |
| 2=low | 6 (15) | 18 (30) | 15 (25) | |
Test applied: Chi- square/ Fischer’s exact test followed by Marascuilo procedure; *p≤0.05 (statistically significant)
Marascuilo procedure: Groups with same superscripted letter showed statistically non significant difference
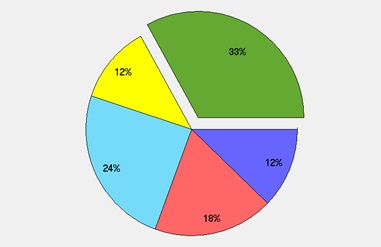
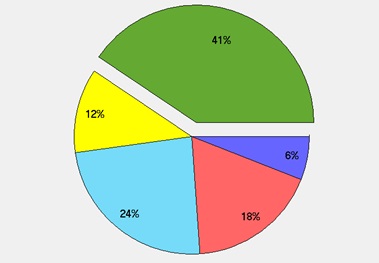
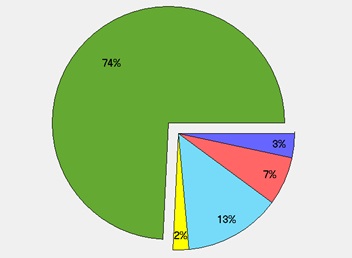
[Table/Fig-2,3&4] indicates that the most dominant sector in average caries risk profile was susceptibility (24%, 24% and 13% in mentally challenged, visually impaired and normal group respectively) followed by bacteria sector (18% in mentally challenged and visually impaired and 7% in normal group). The mean percentage of diet sector was least; 12% in mentally challenged, 6% in visually impaired and 3% in normal group and for circumstances sector, it was 12% in mentally challenged and visually impaired and 5% in normal group. Actual chance to avoid new caries was maximum in normal group (74%) followed by visually impaired (41%) and mentally challenged (33%) group.
Mean percentage of individual sector in cariogram contributing to caries risk among mentally challenged group
Mean percentage of individual sector in cariogram contributing to caries risk among visually impaired group
Mean percentage of individual sector in cariogram contributing to caries risk among normal group
[Table/Fig-5] shows stepwise multiple linear regression analysis which was executed to estimate the relationship between Caries risk as dependent variable and various independent variables. The best predictors in the descending order for Caries risk were group, DMFT, streptococci count, plaque amount, lactobacilli count and buffer capacity with the variances 43.5%, 51.9%, 58.1%, 64%, 67.5% and 70.4%, respectively.
Stepwise multiple linear regression analysis with caries risk as dependent variable
| Model | R | R2 | f-value | p-value |
|---|
| Caries risk | | | | |
| 1 | 0.660a | 0.435 | 121.683 | 0.000a |
| 2 | 0.720b | 0.519 | 84.588 | 0.000b |
| 3 | 0.762c | 0.581 | 72.073 | 0.000c |
| 4 | 0.800d | 0.640 | 68.779 | 0.000d |
| 5 | 0.822e | 0.675 | 64.101 | 0.000e |
| 6 | 0.839f | 0.704 | 60.560 | 0.000f |
| a. Predictors: (Constant), group |
| b. Predictors: (Constant), group, DMFT |
| c. Predictors: (Constant), group, DMFT, streptococci count |
| d. Predictors: (Constant), group, DMFT, streptococci count, plaque amount |
| e. Predictors: (Constant), group, DMFT, streptococci count, plaque amount, lactobacilli count |
| f. Predictors: (Constant), group, DMFT, streptococci count, plaque amount, lactobacilli count, buffer capacity |
R2= Coefficient of determination, R= Correlation coefficient; p≤0.05 (statistically significant)
Discussion
Dental caries affects individuals differently, which makes it essential to identify high-risk patients so that preventive strategies can be undertaken. The concept of caries-risk assessment is simple and straightforward. The idea is to identify patients who are most likely to develop caries [9]. In the present study, mentally challenged and visually impaired showed significantly higher caries experience. These results were in agreement with the results obtained by Gizani et al., [10], among handicapped children in Belgium and by Reddy and Sharma [11], among visually impaired individuals in Chennai. However, higher mean DMFT (7.68) were reported by Tanaka and Pieper (17.4) among mentally challenged and visually impaired subjects respectively [12,13]. In collaboration with the previous studies, the present study revealed maximum contribution for DMFT index from D and M components which is probably might be due to their handicapping condition being a hindrance for taking regular dental care [14,15].
Although there are many risk factors for dental caries, the post eruptive local effect of dietary sugar is one of the principle factors in development of caries [16]. Least score for diet frequency was recorded among 70% of the participants. There was no statistically significant difference between the groups based on diet frequency. This may be due to the fact that mentally challenged and visually impaired participants were institutionalized so, they might follow “typical” weekly record of the foods served at each school. Our finding was in contrast with the previous studies reported in the literature which showed that the higher frequency of sugar intake was the main behavioural covariate associated with the outcome of untreated caries [17,18].
In the present study, half of the mentally challenged and one- fourth of the visually impaired group had significantly higher amount of plaque than normal group. This was in harmony with a survey of dental health status among Greek children and teenagers with cerebral palsy, mental retardation and visual disorders in which it was found that the individuals with problems of vision had better oral hygiene than the other handicapped children because they can comprehend the oral hygiene instructions better than others and also have higher kinetic skills [19].
Mutans streptococci and lactobacilli are shown to play a major aetiological role in the initiation and progression of dental caries. They produce intracellular and extracellular polysaccharides which facilitates their adherence to tooth surface [20]. According to the Cariogram model, lactobacilli count is the indicator of diet content measure. In the present study, normal individuals had significantly lower mutans streptococci and lactobacilli counts. High microbial count in mentally challenged and visually impaired groups can be explained by their inability to perform adequate oral hygiene practices [21].
With more than 50 years of clinical success, fluoride serves as the gold standard agent for preventing tooth decay [22]. Majority of the participants were exposed to fluoride in the form of toothpaste only. Infrequent fluoride administration was observed in the form of professional applications, fluoride rinses, tablets and lozenges among the rest of the study participants. It was also suggested by Cochrane and Reynolds [23] that additional remineralization by extrinsic calcium, phosphate, and fluoride ions is required to augment the natural remineralization ability of saliva.
Salivary flow rate regulates oral health by accomplishing mechanical cleaning and protective functions. Most of the participants (n=65) in our study had normal salivary flow rate. The few reports that have been published on studies of saliva from mentally challenged persons are conflicting. While Davis [24] described a reduction in the saliva flow rate of about 74%, Tahmassebi and Curzon [25] reported no differences in the flow rate and buffer capacity of saliva between a mentally challenged group and a control group.
In the present study, most of the participants had reduced buffer capacity but mentally challenged group had significantly higher proportion of subjects with adequate buffer capacity than visually impaired and normal groups which is in accordance with the study conducted by Winer et al., [26]. This may be due to the alteration in the metabolism of the duct and/or acinar cells of the parotid glands in mentally challenged subjects which might have resulted in greater concentrations of sodium, calcium, and bicarbonate in the parotid saliva. However, inspite of high buffer capacity, mentally challenged group had high caries risk. Featherstone [27] proposed the concept of caries balance in 1999. Patients in whom pathological factors outweighted protective factors are likely assessed as being at high risk for future caries lesions.
In this study, highest contributor was susceptibility sector followed by bacteria, circumstances and diet. Susceptibility sector comprised of fluoridation program, salivary secretion and buffer capacity suggesting that the high caries risk in the study participants may be attributed to infrequent fluoride exposure, reduced salivary secretion and low buffer capacity. This result was in accordance with the earlier study [28] unlike the study conducted by Amila et al., [29] where diet was the dominant sector.
The results of stepwise multiple linear regression depicted that the group was the strongest predictor for caries risk followed by DMFT, streptococci count, plaque amount, lactobacilli count and buffer capacity. Among all the three groups, mentally challenged showed higher caries risk. Uncoordinated and uncontrolled movements of jaws, lips and tongue among the disabled individuals reflect difficulties encountered in maintaining an adequate level of oral hygiene due to reduced manual dexterity and their grip on toothbrushes. Visually impaired children have difficulties in performing oral health care measures because visual ability plays an important role in oral health care [11]. This could explain the lower percentage of caries free children in mentally challenged and visually impaired groups.
The main strength of this survey is the oral health examination among mentally challenged and visually impaired children; it can be difficult to work with blind children, because some of them defend themselves by not opening their mouths. This study possesses the following methodological limitations that should be taken into consideration on generalizing its results:
The special children who participated in the study were all institutionalized residents that possessed a weekly diet schedule. Thus, generalization of the results to populations with different backgrounds may be limited.
Data regarding few parameters collected in this study was reported by parents/ caretakers who may contribute to the response bias.
The cross-sectional design of the study confined us from drawing the causal inferences in relation to dental caries.
Overcoming the limitations, the results of the present study can serve as a baseline data for future studies. Furthermore, it would be appreciable to conduct longitudinal studies in the future to check the caries increment and the effectiveness of risk based prevention program such as oral health promotion programmes for special groups.
Test applied: Chi- square/ Fischer’s exact test followed by Marascuilo procedure; *p≤0.05 (statistically significant)
Marascuilo procedure: Groups with same superscripted letter showed statistically non significant difference
R2= Coefficient of determination, R= Correlation coefficient; p≤0.05 (statistically significant)