Treatment of a patient’s disease often hinges on its initial identification. Scientists have developed a wide variety of tests for the detection of various diseases entities. After the benefits of a test have been demonstrated, it may become adopted as a standard diagnostic method for identifying disease entities in patients. Newer more sensitive methods must prove themselves through rigorous scientific analysis in order to compete with the established detection method and perhaps become part of the standard screening process. Experimental techniques are evaluated by having them examine a cross-section of the population and are compared with the performance of the mainstream detection method. Scientists then look to see whether any test improvements are obtained with the new disease detection method. If this type of experiment proves promising, longer-term and typically more expensive longitudinal studies are performed where both the original method and the new testing method are used to monitor two groups for a particular disease over many years.
A common technique for evaluating a detection method involves comparing its disease detection rate after years in a longitudinal study with the long-term disease detection rate produced by standard screening methods. If a substantial improvement in the long-term detection rate is observed, then scientists can be confidant in the improved performance of the new screening method over the existing technique. However, it is possible for scientists to conclude that a new detection method provides little to no benefit if its long-term disease detection rates are similar to the long-term detection rates of the pre-existing established screening method, a conclusion that is not necessarily valid and could lead to the dismissal of new beneficial disease detection technologies.
This paper presents simulation data that demonstrates why the disease detection rate is not an appropriate mechanism for evaluating a disease detection method after years in a longitudinal study. Correctly analyzing the results of a screening test is critical to selecting the most appropriate disease detection method.
Material and Methods
A simulation study was performed in order to compare the performance of disease screening tests of widely varying sensitivities over the course of a 10-year longitudinal study. The resultant prevalence of disease in the population and the number of cases of disease caught in each year of a 10-year longitudinal analysis is tracked with changes in the test sensitivity. The cumulative number of cases of disease caught is also tracked along with the cumulative disease detection rate for each year of a 10-year longitudinal analysis. This study assigns the initial prevalence of disease in the population being screened. The amount of disease caught in a given year is defined by the following equation:

Where,
Dc is the amount of disease caught in a given year.
S is the sensitivity of the test (varied from 50 to 100%).
t is the time of screening in years (varied from 1 to 10).
Dp (t) is the disease prevalent in the population, defined as:
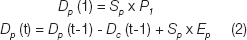
Where,
Sp is the size of the population being screened.
P1 is the initial prevalence of disease in the population screened (%).
Ep is the annual rate of new cases of disease (%).
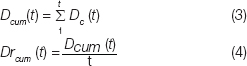
The cumulative disease caught, Dcum (t) is computed as in equation 3 and the cumulative disease detection rate is computed as in equation 4.
For this simulation study, the size of the population being screened (Sp) by a test with any given sensitivity was set to 10,000 patients. The initial disease prevalence (P1) was set to 5%. The annual rate of new disease cases was set to 1% per year. Rates of disease prevalence and incidence vary greatly between disease entities and populations studied, however, these example rates were selected to provide simple values that are realistic in the context of screening high-risk breast cancer patients. Women with BRCA mutations have a 50-85% lifetime risk of developing breast cancer, making a 1% annualized rate a plausible value for this simulation study. Studies that have screened a population of women at elevated risk have reported finding cancer in 3-9% of patients as part of Magnetic Resonance Imaging (MRI) clinical studies [1–4]. For this simulation study an initial disease prevalence of 5% was selected as a potentially realistic value, however, the effects of varying the number of patients, the initial disease prevalence and the rate at which disease enters the population is addressed in the discussion. This simulation study compares the results of enacting a disease screening program on this population with disease detection methods at a variety of sensitivities (50, 60, 70, 80, 90 and 100%). The sensitivities used in this study are ideal in that the assigned test sensitivity is applied uniformly to the diseased population regardless of disease progression. In reality, screening tests tend to have higher sensitivities for disease in a more advanced state of progression and lower sensitivities for earlier stage disease entities. This study shortcoming is addressed in more detail in the Discussion.
Results
The prevalence of disease in the population analyzed is provided in [Table/Fig-1]. Note that with a rate of new disease of 1% per year, the population of 10,000 produces 100 new cases of disease each year. The prevalence of disease in the population is provided for each of 50, 60, 70, 80, 90 and 100% sensitivities. The number of cases of disease detected is tracked over the 10-year period with changes to the test sensitivities and the results are provided in [Table/Fig-2]. The cumulative cases of disease caught is provided in [Table/Fig-3]. The disease detection rate based on the cumulative cases of disease from [Table/Fig-3], normalized by the length of time of the analysis is provided in [Table/Fig-4]. The cumulative disease detection rate for a second simulation with a very high rate of new disease entering the population (30% annually) is provided in [Table/Fig-5].
Prevalence of Disease in Simulation Study over a 10-year Longitudinal Analysis

Disease Detected in Simulation Study over a 10-year Longitudinal Analysis

Cumulative Disease Caught over a 10-year Longitudinal Analysis

Cumulative Disease Detection Rate over a 10-year Longitudinal Analysis

Cumulative Disease Detection Rate over a 10-year Longitudinal Analysis (rate at which new disease enters the population: 30%)

Discussion
The results presented demonstrate that after years in a longitudinal analysis, the disease detection rates are nearly the same regardless of test sensitivity. However, higher sensitivities are associated with decreases in the prevalence of disease in the population screened. The implication is that a test with an improved sensitivity will reduce the prevalence of the disease in a screened population, however, it should not be expected to substantially increase the disease detection rate after years in a longitudinal analysis. Thus, comparing disease detection rates after years in a longitudinal analysis can be an unacceptable method for evaluating a new disease detection technology. [Table/Fig-2] and 4 demonstrate that even at low sensitivities (50%), it is possible for the total tumours detected to approach the results produced by a perfect test (100% sensitivity) after years in a longitudinal analysis. [Table/Fig-2] demonstrates that regardless of sensitivity variations from 50 to 100%, each test converges to be detecting the same number of cases of disease in a given year (the rate at which the disease enters the population). [Table/Fig-3] illustrates why after years in a longitudinal analysis, the disease detection rate would make a poor measure for the performance of a screening test. When we compare a perfect test (100% sensitivity) with a poor test (50% sensitivity) we can see on [Table/Fig-3] that in the first year of screening the poor test has only half the disease detection rate of the perfect test. However, by the 10th year of screening, the poor test with only 50% sensitivity has caught 92.8% of the disease caught by the perfect test. When we evaluate a test based on the disease detection rate, the apparent performance difference between a great test and a poor one narrows as the years of longitudinal analysis progress [Table/Fig-4].
If a pre-existing imperfect test is in place which produces long-term disease detection rates close to the rate at which the disease enters the population, then a newer perfect test will not substantially improve the long-term disease detection rates as measured in a longitudinal analysis. Evaluating a screening technology based on its long-term disease detection rate could lead scientists to dismiss the benefits of a higher performing test, simply because a newer test with an improved sensitivity cannot substantially outperform the old test in terms of the long-term disease detection rate.
Consider a pre-existing test with a true sensitivity of 80% (this is an oversimplification for demonstrative purposes as real tests tend to have a variable sensitivity based on the state of progression of the disease in the patient). The odds of this idealized test missing a given instance of disease in one round of screening is 20%. The probability of missing that particular instance of disease 3 years in a row is 0.23=0.008. This corresponds to a 0.8% chance of missing the disease 3 years in a row. Thus, it is almost guaranteed that a test with a true sensitivity of 80% will catch a given instance of disease within 3 years-a period of time that is much shorter than the length of a typical longitudinal analysis. As such, it is possible for an under-performing test to reach a disease detection rate close to the rate at which the disease enters the population which is well illustrated in [Table/Fig-2and4]. Over the course of a longitudinal analysis, a test with a true sensitivity of 80% is liable to catch the vast majority of the disease prevalent in the population, however, it will often catch that disease later on in its development than the perfect test would have. Even if we are introducing a perfect test, substantial improvements in the long-term disease detection rate over established screening methods may be impossible to obtain.
It should be noted that the sensitivities of disease detection methods quoted in the literature typically are not true sensitivities in the strictest sense of the word. We typically don’t know how much undetected disease is prevalent in the population screened and thus don’t typically know the true sensitivity of any given test. Since, an imperfect test can produce disease detection rates close to the rate at which the disease enters the population, the introduction of a new perfect screening method may produce no noticeable improvement in the test’s long-term disease detection rates as measured in a longitudinal analysis. This does not mean that the perfect test is not providing any benefit over the pre-existing imperfect test: in its first year of use, the perfect test catches all instances of the disease that would have otherwise been missed by the pre-existing screening methodology. Thus, the new perfect test eliminates missed disease and thus lowers the prevalence of the disease in the population being monitored, as is illustrated in [Table/Fig-1]. The new perfect test is also liable to catch disease earlier on in its development, which hopefully translates into easier and more successful treatments for the patient.
A lack of improved long-term disease detection rates via a new more sensitive screening method can be used as justification to limit research on technologies used in longitudinal studies that actually reduced the amount of undetected disease in the population. A lack of appropriate interpretation of the longitudinally measured disease detection rate can prevent the introduction of new more sensitive testing methods and thus be a barrier for patients receiving the highest quality care.
Dr. Nishikawa and Lorenzo Pesce previously presented the idea that long-term detection rates in longitudinal studies are not necessarily a good way to compare detection methods in the context of performing screening for breast cancer via X-ray mammography with and without the help of computer-aided detection technologies [5]. Multiple longitudinal studies comparing screening with and without computer-aided detection technologies reported a lack of a substantial increase in the long-term detection rate of cancers [6–8], however, cross-sectional studies comparing screening with and without computer-aided detection technologies showed substantial increases in the detection rate (from 5 to 20%) [9–14]. This implies that the computer-aided detection methods are effective in removing undetected cancers from the population being monitored even though long-term cancer detection rates are largely unchanged.
It has been pointed out more recently that this effect might apply to the screening of breast cancer in the contralateral breast with MRI after an initial diagnosis of cancer [15, 16]. Solin et al., also reported equal long-term cancer detection rates when comparing MRI based screening of the contralateral breast with traditional X-ray mammography after a longitudinal analysis of 8 years [17]. This has been used as an argument that MRI is providing little benefit [18], even though it is known to be sensitive to cancers that are occult (not visible) on X-ray mammography [2–4]. Catching disease earlier often leads to easier treatments on the patient and higher survival rates, improvements that are potentially obtainable with new screening technologies that do not increase the long-term detection rate for the disease over pre-existing methods.
Varying the number of patients included in the study has no real effect other than to scale the numbers of disease cases detected. Increasing or decreasing the initial prevalence of the disease does not affect this paper’s conclusions regarding the longitudinally measured disease detection rate being an inappropriate mechanism to evaluate a screening technique. Decreasing the rate at which the disease enters the population increases the effects described regarding the long-term disease detection rate (poor tests and perfect tests have nearly identical detection rates). Increasing the rate at which the disease enters the population helps decrease the effects described regarding the long-term disease detection rate. However, it should be noted that even at the epidemic level of 30% of the population acquiring a disease annually, after 10 years in a longitudinal analysis, a test with a sensitivity of 50% will yield a cumulative disease detection rate of 90% that produced by a perfect test. This is demonstrated in [Table/Fig-5] in which the simulation was repeated with an initial prevalence of 30% and 30% of the population acquiring the disease each year. The conclusion that the longitudinally measured disease detection rate is a potentially misleading evaluative metric appears to hold regardless of variations in the initial disease prevalence or the rate at which the disease enters the population.
Metrics that are recommended for the evaluation of disease screening methods include the resultant mortality rate from the disease. An additional appropriate evaluative metric is to look for an increase in the rate of detection of earlier stages of disease when comparing screening methods. Screening techniques can also be compared based on patient outcomes after the first round of screening (so as to eliminate disease entities caught in the first round of screening that could/would have been caught had the screening method being evaluated been applied to the patient earlier).
This study’s main shortcoming is the assumption of having tests with a fixed sensitivity that does not change with the state of disease progression. Normally a disease detection method’s sensitivity will vary with the state of disease progression, providing a higher sensitivity for advanced states of breast cancer and a much lower sensitivity for very early stage tumours. Future work will look at modeling this effect and demonstrating that this study’s conclusions are valid even in situations where the test’s sensitivity is variable based on the state of the disease.
Conclusion
In this study, it was demonstrated that the longitudinally measured disease detection rate can be an inappropriate metric for the evaluation of a disease screening method. This paper presented a longitudinal simulation study of disease screening at a variety of different test sensitivities. It was demonstrated that the difference between the longitudinally measured disease detection rates of a high quality test with 100% sensitivity and a poor quality test with 50% sensitivity are relatively small. A simulation study was performed to evaluate the potential effects of screening a high-risk breast cancer population. This simulation analysis clearly demonstrates that the longitudinally measured disease detection rate can be an unreliable mechanism for evaluating a disease screening technology.