A change in demographics with increased life expectancy has resulted in nearly one third of women’s life being spent postmenopausally [1]. However, being a relatively neglected group, menopausal problems often go unrecognised. Biological and psychosocial changes during this period may lead to social impairment and work related difficulties that significantly decrease the overall quality of life [1]. The psychological problems commonly reported include physical or mental exhaustion, irritability, depressed mood and decreased sleep and libido [2]. Despite a reported prevalence of psychological distress to be 24%, physicians may fail to recognize up to 30%–50% of women with such problems particularly when they present with somatic symptoms [3–6]. Therefore, primary care physicians should have a proactive and holistic approach to identify women with psychological problems, especially those with risk factors, for better assessment and optimal outcome [6]. It is important to identify factors that can serve as “flags” or predictors for a potential increased risk for psychological problems, of which depression and anxiety are most common.
Social stressors, excessive vasomotor symptoms and past history of depression are the major predictors of depression. Psychosocial stressors that predispose to depression include stress, major life events, daily hassles and negative expectations of menopause [3,7,8]. Other less consistently identified factors predicting depression are lack of exercise, health status and a low socioeconomic status [9].
A review of data from 1970-2008 concluded that routine screening of menopausal women, followed by careful assessment can help to identify the presence of depressive disorders [10]. In India not much attention is paid to psychological symptoms and they are taken as part of normal menopause, which leads to poor quality of life. Hence, for optimal mental health of menopausal women, it is important that they are screened for mental health issues. The present study was planned to analyse the spectrum of psychological disorders in postmenopausal women and to identify risk factors for these disorders.
Material and Methods
This study was a prospective observational study carried out at a North India tertiary care hospital, in the Department of Obstetrics and Gynaecology. It included a cross-section of postmenopausal females attending the Gynaecology OPD and Menopause Clinic over a period of six months. Women with pre-existing coronary heart disease, osteoporosis, psychological disorders, breast and genital malignancies, surgical/premature menopause (<40 yrs) and noncompliant patients unable to adhere to study protocol were excluded from the study.
All the enrolled women were evaluated regarding age, parity, obstetric history, menstrual history, duration of menopause, vasomotor symptoms, urogynecological problems and social stressors. A detailed personal, past and present medical and family history was taken with a view to assess the risk for psychological disorders. A thorough general physical, systemic and pelvic examination was carried out.
Risk assessment for depression was done using Centre for Epidemiologic studies depression scale (CES-D Scale) (APPENDIX 1). The CES-D scale has 20 questions. Patients were instructed to circle the number for each statement that best described how often they felt or behaved this way during the past week. The possible range of scores for the scale is 0-60. Patients were categorized according to the score into 4 categories (0-9 - none or minimal depression, 10-16 - mild, 17-24 - moderate and >24 - moderate to severe depression).
Statistics
The data was analysed using student t- test, chi-square and co-relation coefficient analysis. A logistic regression was performed to assess the impact of the factors known to be important in the prevalence of the psychological depression. A p-value < 0.05 was considered significant.
Results
A total of 200 postmenopausal patients (> 40 years) willing to comply with the study protocol were included. The mean presenting age of the women in the study was 57.9 ± 9.4 years and the mean age at menopause was 46.8 ± 2.9 years.
The distribution of gynaecological symptoms is depicted in [Table/Fig-1]. The commonest gynaecological presenting symptom was vaginal dryness, while the commonest vasomotor symptom was hot flashes. Fatigability/lack of energy was the most frequently encountered psychological symptom.
Distribution of various symptoms*
| Symptoms | n (=200) | Percentage (%) |
|---|
| GYNAECOLOGICAL |
| Post-menopausal bleeding | 19 | 9.5 |
| Prolapse | 22 | 11 |
| Discharge | 33 | 16.5 |
| Pain/ Burning sensation in vulva | 26 | 13 |
| Vaginal Dryness | 44 | 22 |
| URINARY |
| Burning micturation | 49 | 24.5 |
| Frequency | 53 | 26.5 |
| Incontinence | 47 | 23.5 |
| CLIMACTERIC- Vasomotor |
| Hot flashes | 72 | 36 |
| Night Sweats | 43 | 21.5 |
| Palpitations | 39 | 19.5 |
| Psychological |
| Feeling tense/ nervous | 57 | 28.5 |
| Loss of interest | 29 | 14.5 |
| Crying spells | 6 | 3 |
| Depression | 47 | 23.5 |
| Irritability | 63 | 31.5 |
| Fatigue/ lack of energy | 110 | 55 |
| Sleep disturbance | 69 | 34.5 |
| Decrease concentration | 68 | 34 |
| Decrease Memory | 26 | 13 |
| Psychosomatic |
| Joint pain | 83 | 45.5 |
| Backache | 69 | 34.5 |
| SEXUAL | 109 | 54.5 |
*Many patients had more than one symptom; hence the total may not match.
Amongst the risk factors for psychological disorders, a history of excessive vasomotor symptoms and psychosocial stressors was present in 27% and 14.0% women respectively [Table/Fig-2]. There was a strong association between vasomotor symptoms and depression (p=0.000). A significant association was also observed between past history of depression and depression (p=0.048), and between psychosocial stressors and depression (p=0.000) [Table/Fig-2]. Poor general health was found in 13% of women.
Distribution of various risk factors for psychological disorders
| Risk Factors | No. (n=200) | Women without Depression (n=111) | Women with depression (n=89) | p-value |
|---|
| History of excessive vasomotor symptoms | 54 (27%) | 14 | 40 | 0.000 |
| Past history of depression* | 3(1.5%) | 0 | 3 | 0.048 |
| Psychosocial stressors/daily hassles/major life events | 28 (14%) | 9 | 19 | 0.000 |
| Poor physical health | 26(13%) | 14 | 12 | 0.059 |
*past history of depression- postpartum psychosis, premenstrual syndrome etc.
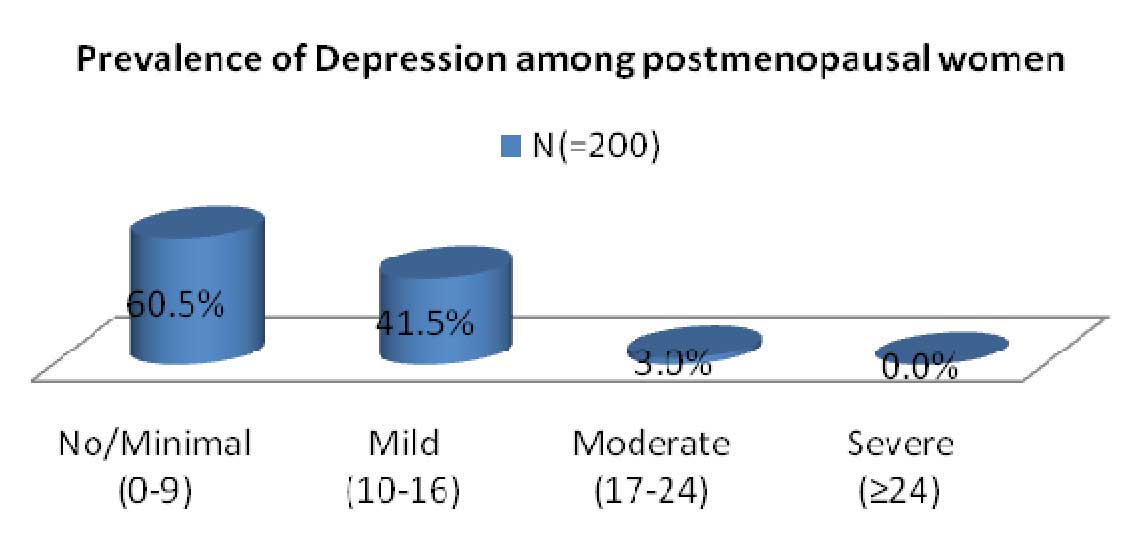
More than 50% women (111) had no or minimal depression as per CES-D Score for depression [Table/Fig-3]. Mild depression was present in 41.5% and Clinical (Moderate to severe) depression was present in 3% women [Table/Fig-3]. Mean age of women with depression was 50.61 ± 7.3 years and without depression was 56.6 ± 5.9 years. This difference was statistically nonsignificant (p=0.373).
CES-D scoring for Assessment of Depression
Discussion
In North Indian postmenopausal women, the prevalence of psychological symptoms is reported to increase with increasing age and mean duration since menopause (MDSM). Sharma et al observed forgetfulness and anxiety in 50% and 10% postmenopausal women respectively, while depression and sleep disturbances were reported in 45% women [11]. Similar observations were made by Sueblingvong, who reported an overall prevalence of psychological symptoms as 32.2 to 38.7% [12]. In the present study also the overall prevalence of psychological symptoms was 32%. Sleep disturbance and decreased concentration were reported by 34% women. Irritability, nervousness and depression were observed in 31.5%, 28.5% and 23.5% women respectively.
Screening for depression and its severity can be assessed by using different scales. Instruments available to assess depression are Beck Depression Scale [13], Zung Depression Scale [14], Centre for Epidemiologic Studies Depression Scale CES-D scale [15] and the Primary Care Evaluation of Mental Disorders [16]. The Geriatrics Depression Scale (GDS) is an efficient tool with good reliability and validity devised for population aged 65 years or older [17], but Centre for Epidemiologic studies depression scale is being widely used (Appendix-I).
In the present study, according to CES-D scale, mild and moderate depression was diagnosed in 41.5% and 3% respectively. Hunter has also reported a small but significant increase in depressed mood in postmenopausal women [18]. In a systematic review of nine cohort studies, on the influence of menopause on mood, Vesco et al., reported that in three community based studies, women entering or completing the menopausal transition were more likely to be depressed than premenopausal women [19].
The American geriatric society has reported the prevalence of major and subclinical depression in older women as 15% [20]. However, in the present study no woman was diagnosed with major depression, whereas 44.5% women had mild to moderate depression. The difference in observation is probably due to a larger study group and a different social pattern.
Risk Factors: Dennerstein observed that women with negative attitude to the menopausal changes are at increased risk of depression [21]. Amongst factors predisposing to psychological problems and depression, vasomotor symptoms have been reported to affect quality of life resulting in psychosocial implications; women with hot flashes are more likely to experience depressive symptoms than asymptomatic women [22]. In the present study, excessive vasomotor symptoms were the significant risk factor for depression, observed in 27% women. Nocturnal hot flashes are often more distressing to women because of sleep disturbance and its effect on bed partners [23].
Psychosocial stressors and prior history of depression have also been reported as strong predictors of depression during the menopausal transition [22, 24]. Prospective cohort studies have consistently identified psychosocial factors that predicted depression or depressed mood. These social stressors can be major life events like death of a partner, daily hassles and negative expectations of the menopause [8]. Midlife women with significant psychosocial stressors or history of depression are vulnerable to depressed mood. Mc Cormick reported that psychosocial factors like death of a child or spouse and a family history of depression are correlated with depression [25]. In the present study, psychosocial stressors were associated with depression in 15.5% women, and consistent with previous reports, a strong association was seen with past history of depression [26].
Low physical activity could be a cause or effect of depression. It has been seen that, high levels of physical activity were related to lower levels of stress during menopause. In addition, levels of anxiety, stress, and depression were lowest among physically active postmenopausal women compared with inactive women in the same menopausal group [26]. In the present study also, 25% women with depression reported low level of activity.
Limitations of Study
This is a hospital based study, so results may not be applicable to general postmenopausal population. The sample size is also small compared to the population based studies.
Conclusion
Risk factor assessment for psychological disorders is a useful tool to predict depression in postmenopausal women. A thorough understanding of these mental health issues, the associated risk factors and appropriate screening is important in improving the mental health of postmenopausal women.
Appendix
| Center for Epidemiologic Studies: Depression Scale |
|---|
| Circle the number of each statement which best describes how often you felt or behaved this way – DURING THE PAST WEK. |
|---|
| | Rarely or none of the time (less than 1 day) | Some or a little of the time (1-2 days) | Occasionally or a moderate amount of the time (3-4 days) | Most or all of the time (5-7 days) |
|---|
| During the past week: | 0 | 1 | 2 | 3 |
| 1. | I was bothered by things that usually don’t bother me | 0 | 1 | 2 | 3 |
| 2. | I did not feel like eating; my appetite was poor | 0 | 1 | 3 |
| 3. | I felt that I could not shake off the blues even with help from my family and friends | 0 | 1 | 2 | 3 |
| 4. | I felt that I was just as good as other people | 0 | 1 | 2 | 3 |
| 5. | I had trouble keeping my mind on what I was doing | 0 | 1 | 2 | 3 |
| 6. | I felt depressed | 0 | 1 | 2 | 3 |
| 7. | I felt that everything I did was an effort | 0 | 1 | 2 | 3 |
| 8. | I felt hopeful about the future | 0 | 1 | 2 | 3 |
| 9. | I thought my life had been a failure | 0 | 1 | 2 | 3 |
| 10. | I felt fearful | 0 | 1 | 2 | 3 |
| 11. | My sleep was restless | 0 | 1 | 2 | 3 |
| 12. | I was happy | 0 | 1 | 2 | 3 |
| 13. | I talked less than usual | 0 | 1 | 2 | 3 |
| 14. | I felt lonely | 0 | 1 | 2 | 3 |
| 15. | People were unfriendly | 0 | 1 | 2 | 3 |
| 16. | I enjoyed life | 0 | 1 | 2 | 3 |
| 17. | I had crying spells | 0 | 1 | 2 | 3 |
| 18. | I felt sad | 0 | 1 | 2 | 3 |
| 19. | I felt that people disliked me | 0 | 1 | 2 | 3 |
| 20 | I could not get “going” | 0 | 1 | 2 | 3 |
*Many patients had more than one symptom; hence the total may not match.
*past history of depression- postpartum psychosis, premenstrual syndrome etc.