Simvastatin is cholesterol-lowering drug which competitively inhibits the cholesterol biosynthesis by HMG-CoA reductase [1]. Simvastatin is chemically modified 2,2-dimethyll butyrate analogue of lovastatin [2]. Simvastatin is orally administered as inactive prodrug in the lactone form which is converted in the liver into its active metabolite β-hydroxy acid [3]. Recently, numerous methods for analysis of simvastatin and its metabolites determination in human plasma by HPLC methods with difference detectors (ultraviolet, fluorescence and mass spectrometry) have been published [4–9]. In addition, some methods of gas chromatography with mass spectrometry for determination of simvastatin and its metabolites have also been published [10–11]. However, most of these methods are tedious and time consuming, which also considered costly for routine analysis work. Method by HPLC-UV is not sensitive enough to detect the low concentration of simvastatin and can only detect as low as 20 ng/mL of simvastatin. Since plasma concentrations of simvastatin is expected to be between 0.1 and 15 ng/mL [12]. However, method by HPLC-UV is suitable for determining simvastatin in pharmaceutical formulations and preparations [13], but is not suitable for pharmacokinetic study. Therefore, sensitive and selective methods for the determination of simvastatin are required for therapeutic drug level monitoring. A more sensitive method using LC/MS/MS, can be achieved, but the operation and clean up procedure prior to analysis seems to be so complicated and is too expensive to be used for routine measurements in the clinical laboratory [6,8,9]. Electrospray ionization mass spectrometry (ESI-MS) coupled with LC-MS method developed by Yang et al., (2003) was simple, rapid and sensitive. In this study, develop more sensitive and specific liquid chromatography tandem mass spectrometric (LC-MS-MS) method which can simultaneously quantitate simvastatin in human plasma to the required level. Also in this study, sample sizes 0.2 mL was used to achieve the desired limit of quantification at 0.25 ng/mL of simvastatin in human plasma.
Material and Methods
Chemicals
Simvastatin with molecular weight 418.57 and its internal standard lovastatin with molecular weight 404.54 were supplied by Ranbaxy (Sungai Petani, Malaysia). HPLC grade acetonitrile was obtained from Merck Darmstadt Germany. Hexane (analytical grade) was obtained from Merck Darmstadt Germany. Ethyl acetate and formic acid (analytical grade) were obtained from Fisher scientific international company UK. Water was purified and deionized using a Milli-Q ion exchange filtration system. Water was filtered through WCN 0.45 um filters Whatman Ltd, UK. The analytical HPLC column used was Symmetry C18 column, 5 μm (3.9 mm, i.d x 50 mm) from Waters.
Chromatographic conditions
Chromatographic and mass detection system was performed using Finnigan LCQ-DUO system, comprising a quaternary pump, mobile phase vacuum degassing unit, UV-visible diode array detector, mass spectrometry detector and an auto-sampler. The system was controlled using Excalibur software (Finnigan) that runs under Windows NT operating system. The separation was performed in C18 analytical column, 5 μm (3.9 mm, i.d x 50 mm) at room temperature. The mobile phase consisted of a mixture of 3 mm formic acid and acetonitrile (25/75%, v/v) and was prepared daily. The LC system was operated isocratically at 500 μL/min. The heated capillary temperature was set to 230°C. Nitrogen was used as the sheath gas and helium as auxiliary gas and set to 100 ± 20 psi and 40 ± 10 psi respectively. The collision energy at beginning was set to 40 eV for responses of simvastatin and lovastatin.
The mass spectrometer was operated in positive ion electrospray spectrometry with a mass between 200-500 m/z. The full scan single mass spectra and product ion mass spectra of analyte and internal standard were obtained by infusion of each test sample in a solution into spectrometer. The selected reaction monitoring (SRM) scheme employed involved transitions of the M+H+ ions to selected product ions for simvastatin and lovastatin.
Preparation of stock solution and calibration standard
Standard stock solutions of simvastatin 1 mg/mL and of lovastatin 1 mg/mL were stored at -20°C. The working solutions for simvastatin (500 ng – 2.5 ng/mL) were prepared by diluting from the stock standard with acetonitrile and water (80:20%, v/v) and stored at 4°C. The working solutions for internal standard lovastatin (200 ng/mL) was prepared by diluting certain amount of the stock standard with acetonitrile and water (80:20%, v/v) and stored at 4°C. Calibration curves were prepared by spiking drug free plasma samples (0.2 mL) with standard solutions (0.25 – 50 ng; 100 μL) of simvastatin and the internal standard (10 ng/mL; 50 μL) to give concentrations in the range of 0.25 – 50 ng/mL. The peak area of the drug was plotted against the corresponding concentrations of the standard solution. Linear regression of the peak area ratio versus the drug concentration was performed in order to estimate the slope, intercept and correlation coefficient.
Assay validation
The within-day precision was evaluated by undertaking repeated analysis of plasma samples spiked at three different concentrations of simvastatin, at 3,12, and 30 ng/mL. The concentration of the internal standard (I.S) was fixed at 10 ng/mL, for each concentration, six replicate were analysed and the coefficient of variation (CV) was calculated. Day-to-day precision was evaluated by undertaking repeated analysis of plasma samples spiked with three different concentrations of simvastatin, at 3, 12, and 30 ng/mL. The concentration of the internal standard was fixed at 10 ng/mL, for each concentration. Experiments were repeatedly analysed over five consecutive days and the coefficient of variation (CV) was calculated.
Extraction procedure
Aliquots of spiked samples of human plasma (0.2 mL) containing both simvastatin in various concentrations and internal standard (10 ng/mL in 50 μL) were extracted by adding 3 mL of ethyl acetate and hexane (90/10%, v/v). The sample was vortex mixed for 30 second followed by a 10 min centrifugation at 4000 rpm. The supernatant organic layer was transferred into another test tube, and evaporated under a stream of nitrogen at 40°C. The residue was reconstituted in 200 μL of acetonitrile and 3mM formic acid (30:70%, v/v), vortexed for 15 second, followed by a 5 min centrifugation at 12000 rpm and 20 μL was injected on the column.
Extraction efficiency
The extraction efficiency of the analytical method was assessed. The recoveries of the extraction procedure for simvastatin and lovastatin were determined at three quality control concentrations (3, 12, and 30 ng/mL). The peak areas obtained from the extracted samples were compared with those of standard solutions.
Results and Discussion
Mass spectrometric conditions in LC-MS-MS
The first step in developing the detection method was to select the parent ion to be fragmented. As both simvastatin and lovastatin are lactone based compounds, and positive ion mode is appropriate for lactone compounds, thus both were monitored in a positive ion mode. Therefore, positive ion mode would be preferable for both the acidic and lactone compounds within the class of statins.
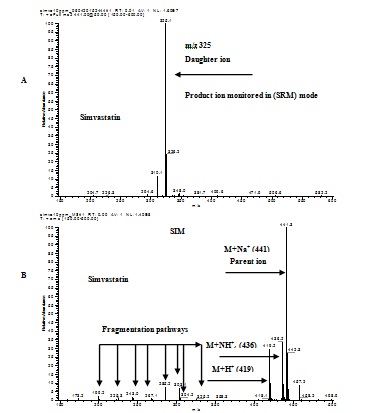
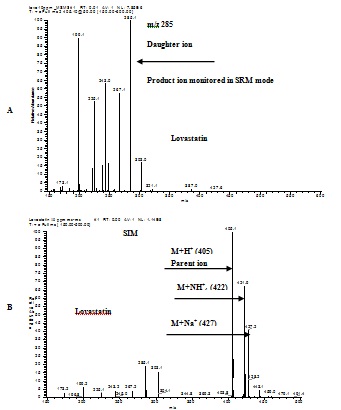
As M+Na+ of simvastatin with m/z 441.3 and M+H+ of lovastatin with m/z 405.1 had the most intense signal in positive ion mode, therefore they were chosen as the parent ions for the determination of simvastatin and lovastatin. The adduct ion predominated in the positive ion mode for simvastatin at m/z 441.3 but is not in the case for lovastatin as M+H+ m/z 405.1 is predominant. Since no sodium was deliberately added to the sample, while the mobile phase contained no known sources of the sodium ions or may be due to reaction with heated capillary in the ion source. The adducts ionization condition in this method is similar to others LC-MS and LC-MS-MS methods conducted by Yang et al., (2003); Barrett et al., (2006), simvastatin was M+Na+ with m/z 441, also LC-MS-MS method reported by Jemal et al., (2000), the adducts ionization for simvastatin was M+NH4+ with m/z 436, likewise LC-MS-MS method reported by Yang et al., (2005) the adducts ionization for simvastatin was M+ CH3+NH+3 with m/z 450.
The product ion spectra (daughter ion) of simvastatin and its internal standard lovastatin were obtained after optimization of these parameters. The base peaks of product ions were observed at m/z 325 and 285 for simvastatin and lovastatin in positive ion mode, respectively.
The fragmentor voltage is especially important during developing method, as it affects the transmission of the ions and also the dissociation of molecules into fragments. Various different collision energies were tested during method development, from 15 eV to 75 eV in order to minimize undesirable fragmentation and to achieve highest response. The 30 eV could achieve both minimal undesirable fragmentation and highest response. Detector response of simvastatin when tested using a solution of 20 ng/mL is shown in [Table/Fig-1,2]. [Table/Fig-3,4] show the corresponding spectra for simvastatin and lovastatin.
Response of simvastatin at different fragmentor voltage
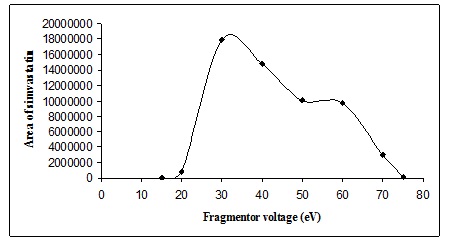
Response of simvastatin at different fragmentor voltage
| Fragmentor voltage (eV) | Area of simvastatin m/z 325 |
|---|
| 15 | 0 |
| 20 | 800217 |
| 30 | 17941551 |
| 40 | 14810928 |
| 50 | 10062319 |
| 60 | 9750794 |
| 70 | 3025045 |
| 75 | 100591 |
Full-scan product ion spectra of simvastatin (A) was daughter ion at m/z 325 (B) was parent ion at m/z 441
Full-scan product ion spectra of lovastatin (A) was daughter ion at m/z 285 (B) was parent ion at m/z 405
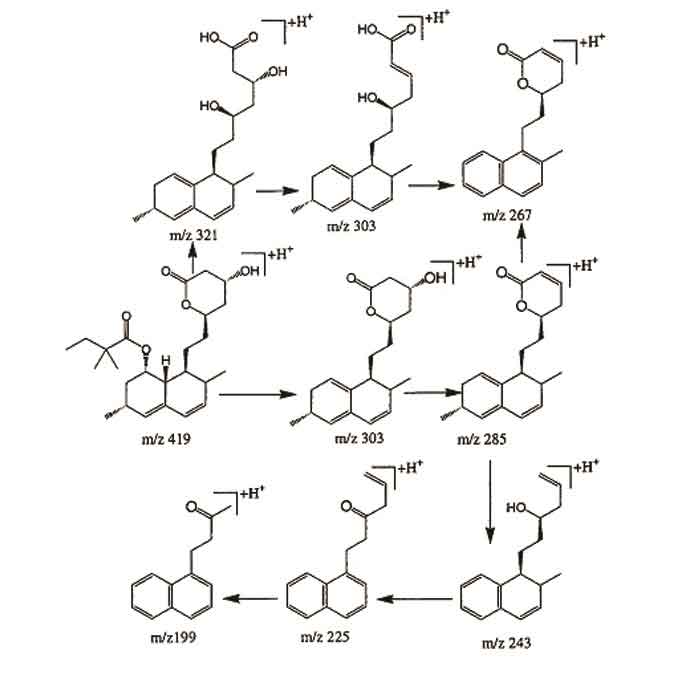
The proposed collision induced dissociation path way for simvastatin to the prominent product ions are presented in [Table/Fig-5]. The proposed pathway is very similar to the spectrum shown in [Table/Fig-6]. Ions at m/z 199, 225, 243, 267, 285, 303, 304 and 325 were detected in this spectrum and are consistent with report from Jemal et al., [6].
Fragmentation behaviour pathways for simvastatin to produce the prominent product ions (Jemal et al., 2000)
Intra-day coefficient of variation and accuracy of measurement of simvastatin in human plasma of individual samples (n=6) The value of found concentration represents mean ±S.D.
| Spike concentration (ng/mL) | Found concentration (ng/mL) | Coefficient of variation (CV) (%) | Accuracy (%) |
|---|
| 3 | 3.28 ± 0.21 | 6.40 | 109.33 |
| 12 | 10.80 ± 1.45 | 13.40 | 90.00 |
| 30 | 28.48 ± 3.53 | 12.40 | 94.50 |
Detector linearity, calibration curves, coefficient of variations and accuracy
The linearity was improved by setting the collision energy at 30 eV as it achieves both minimal undesirable fragmentation and highest response. As the matrix can also influence the extent of fragmentation of the analyte ions, [14], a proper choice of a liquid matrix is very crucial to obtain a good quality mass spectrum and to optimize the sample ion current. In this study, the residue was dissolved in 200 μL of acetonitrile and 3mM formic acid (30:70%, v/v) (liquid matrix) and this solvent mixture play a significant role in the analysis. The results indicated that the detector response towards simvastatin was linear over the range of 0.25 - 50 ng/mL.
Simvastatin in plasma was linear over the concentration range between 0.25 to 50 ng/mL. The peak area versus the amount of the drug injected was plotted to determine the linearity.
The validation results for within day and day-to-day are presented in [Table/Fig-7] and [Table/Fig-8] respectively. The variation of the assay method is acceptable as reflected by the small CV values (CV < 14%). The coefficient of variation for the within day ranges from 6.40 to 13.40%, while the coefficient of variation for day-to-day ranges from 8.30 to 9.89%.
Inter-day coefficient of variation and accuracy of measurement of simvastatin in human plasma of individual samples (n=5). The value of found concentration represents mean ±S.D.
| Spike concentration (ng/mL) | Found concentration (ng/mL) | Coefficient of variation (CV) (%) | Accuracy (%) |
|---|
| 3 | 3.16 ± 0.31 | 9.89 | 105.33 |
| 12 | 11.72 ± 0.99 | 8.50 | 97.70 |
| 30 | 31.98 ± 2.70 | 8.30 | 106.60 |
Extraction efficiency of simvastatin (n=3)
| Sample concentration (ng/mL) | 3 | 12 | 30 |
|---|
| Extracted Concentration Mean (CV%) | 3.20 (8.21) | 11.80 (10.20) | 31.40 (5.50) |
| Non-extracted Concentration Mean (CV%) | 3.90 (6.40) | 13.30 (4.14) | 35.70 (6.60) |
| Recovery % | 82.00 | 88.70 | 87.90 |
The lower limit of quantification is defined as the lowest concentration on the calibration curve for which an acceptable accuracy of 100 ± 20% and a precision of 20% was obtained. The current assay has an LOQ of 0.25 ng/mL in human plasma for simvastatin based on 0.2 mL plasma with single to noise ratio of [6]. The LOQ in this method was better than what have been reported with LC-MS-MS methods previously reported, while the LOQ in this method less sensitive with other LC-MS-MS methods previously reported, but this method the volume of plasma sample used in the assay is only 200 μL, which is significantly less than previously published method, lower detection level is possible when higher volume of sample is used. As well as, the extraction procedure of liquid-liquid extraction in this method is simpler and less expensive than other previously published method which the operation and clean up procedure prior to analysis seems to be complicated and expensive. The limit of detection in this study is 0.125 ng/mL. Detection limit or detector sensitivity is generally taken as the concentration or mass of solute entering the detector per unit time that provides a signal-to-noise ratio of 3, and this is usually considered the minimum concentration or mass of solute that can be adequately detected. Usually, the limit of detection is dependent on the chromatographic system, thus detector sensitivity, baseline stability and linearity are important specifications for quantitative analysis and these parameters must be maintained stable for best analytical precision. Detector response must be linear throughout the concentrations range to be used in calibration curve otherwise errors may affect the linearity.
Recovery
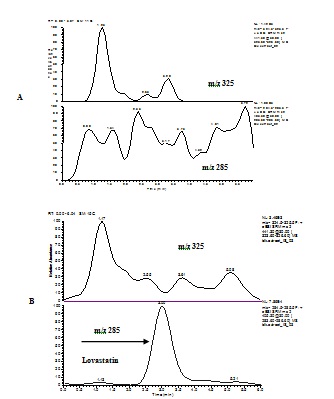
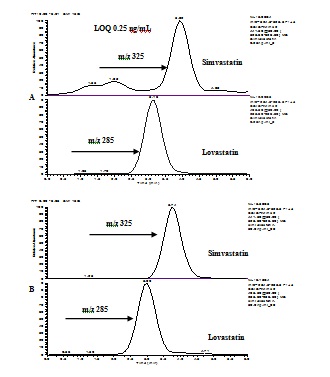
The extraction efficiency of the analytical method was assessed by recovery experiments. The recoveries for simvastatin in human plasma are summarized in [Table/Fig-9]. Mean recoveries for 3, 12, and 30 ng/mL in plasma were recorded as 82.00, 88.70, and 87.90% respectively. The precision of recovery was less than 11% which indicates a good reproducibility for the assay. [Table/Fig-10] show the chromatograms after extraction from free drug plasma, free drug plasma with internal standard and simvastatin after extraction from plasma at low (0.25 ng/mL) and high (50 ng/mL) concentration with its internal standard lovastatin at 10 ng/mL.
Chromatograms of drug free plasma at m/z 325 of simvastatin and m/z 285 of lovastatin (A) and blank free plasma at m/z 325 and 10 ng/ml lovastatin at m/z 285 (B)
Chromatograms of the limit of quantification 0.25 ng/mL at m/z 325 of simvastatin and m/z 285 of lovastatin (A) and 50 ng/mL at m/z 325 of simvastatin and m/z 285 of lovastatin (B)
Take the application to clinical samples
This method was applied to determination the effect of fasting group on the pharmacokinetic of single oral dose of 40 mg simvastatin tablet in healthy adult male Malaysian volunteers. Mean pharmacokinetic parameters of simvastatin after a single oral dose of 40 mg simvastatin are depicted in [Table/Fig-10].
Conclusion
The extraction procedure of liquid-liquid extraction in this method is simpler and less expensive than other previously published methods which the operation and clean up procedure prior to analysis seems to be complicated and expensive for routine measurements in the clinical laboratory. The LC-MS-MS detection is sensitive due to its capability to eliminate interferences from endogenous components. Furthermore, the simplicity of our method and the rapidity of sample preparation since it produced clearer chromatograms with less interfering peak near simvastatin and internal standard (lovastatin).