Vitamin D has sparked widespread interest in the pathogenesis and prevention of diabetes. Vitamin D has been shown to stimulate insulin production [1]. Association between low vitamin D levels and decreased insulin sensitivity has been reported [2].
Low vitamin D concentrations are associated with a higher likelihood of the occurrence of diabetic complications, such as cardiovascular disease [3], renal impairment [4] and peripheral arterial disease [5]. In addition, diabetic patients are a high risk category for developing vitamin D deficiency, which may potentially lead to diabetic complications.
Studies done on the administration of vitamin D supplements in vitamin D-sufficient patients with DM type 2 have yielded conflicting results. Some have reported an improvement of glycaemic control [6]; others have reported no effect [7], while others have shown that the restoration of vitamin D reserves in vitamin D-deficient patients improved glucose tolerance [8].
This study aimed to investigate vitamin D status among patients with type 2 diabetes, and to ascertain the relationship between low 25(OH) D levels and the marker of glycaemic control, HbA1c.
Material and Methods
A cross-sectional study was carried out during the period from May 2012 to February 2013. Four hundred and eighty three Kurds were included (337 with and 146 without type 2 DM). All these individuals were selected from among adult patients attending the Diabetic Center of Azadi Teaching Hospital, Duhok, Kurdistan Region, Iraq, during the period of the study. Selection of cases and healthy controls was carried out by using a systematic random sampling technique. Patients with acute illnesses, a history of chronic liver or renal disease, and those who were taking medication that altered vitamin D metabolism and status were excluded from the study. None of the females was pregnant. All individuals completed a pre-tested questionnaire which included anthropometric data and a diabetic record. Body mass index was calculated for each subject. Biochemical blood measurements were determined by a standard laboratory procedure using Cobas 6000, Roche/Hitachi. Serum concentration of 25(OH) D was measured by enzyme linked immunosorbent assay (ELISA) method.
The vitamin D status was assessed according to the following criteria: Severe deficiency- below10 ng/ml, insufficiency-10-25 ng/ml and sufficiency ->25-150 ng/ml. A cutoff point of <25 ng/ml of 25(OH) D was used to classify patients as on low vitamin D status. All data were analyzed using the Statistical Package for Social Sciences (SPSS), version 21.0.Independent t-test was used to assess differences in serum analytes among groups. The statistical significance, direction and strength of linear correlation between 2 quantitative variables were measured by using Pearson’s correlation coefficient test. Categorical variables were compared by Chi-square test.
Results
The general characteristics of the individuals have been described in [Table/Fig-1]. Of the 337 patients, 58% had low vitamin D levels (25(OH) D<25ng/ml) as compared to 44/146 of the controls (30.1%).
Individuals Characteristics
| Parameters | Diabetics | Controls | p-value |
|---|
| (n=337) | (n=146) | |
|---|
| Age (years)* | 49.7± 9.7 | 48.3 ±11.4 | NS |
| Male sex [n(%)] | 145 ± (43.1) | 69 ± (47.2) | NS |
| BMI (Kg/m2)* | 30.6 ± 5.4 | 29.8 ± 5.0 | NS |
| Diabetes duration (years) | 8.7± 5.1 | ___ | ___ |
| FBS (mg/dl)* | 224 ± 99.1 | 95 ± 8.9 | <0.001 |
| HbA1c (%)* | 10.1 ± 2.3 | 5.1± 0.4 | <0.001 |
| 25(OH) D ( ng/ml)* | 25.6 ± 12. 6 | 34.1 ±14.7 | <0.001 |
| Prevalence of vitamin D |
| insufficiency [n (%)] | 181 (53.7) | 43 (29.4) | <0.001 |
| Prevalence of severe vitamin D |
| Deficiency [n (%)] | 15 (4.4) | 1 (0.68) | <0.001 |
*Results are mean +SD, NS: p>0.05
The mean ± SD of serum 25(OH) D levels with respect to some variables, has been shown in [Table/Fig-2]. The mean serum 25(OH) D level was significantly lower (p<0.01) for patients with poor glycaemic control as compared to that for fair and good glycaemic control diabetics, respectively. A significant difference was also noticed between mean ± SD values for serum 25(OH) D level of patients with a diabetes duration of more than 5 years and of those with a duration less than 5 years (p<0.05). No statistically significant difference was found in the mean values of serum 25(OH)D, using a p-value of 0.05 for age, sex and body mass index of diabetic patients.
Serum 25(OH) D levels in diabetic patients
| Serum 25(OH)D level(ng/ml) |
|---|
| n | Mean ±SD | p-value |
|---|
| Age(years) |
| <40 | 53 | 25.0 ±13.6 | NS |
| > 40 | 284 | 25.7 ± 12.4 | |
| Gender | | | |
| Male | 150 | 26.6 ±13.3 | NS |
| Female | 187 | 24.8 ± 12.0 | |
| Body mass index(Kg/m2) |
| Normal weight | 30 | 27.2 ±10.9 | <25 |
| Over weight 25-29.9 | 124 | 25.6 ± 13.3 | |
| Obese >30 | 183 | 25.3 ± 12.0 | |
| Glycemic control (hbA1c%) |
| Good <6.5% | 26 | 31.5 ± 12.9 | <0.01 |
| Fair <7.5% | 29 | 29.6 ±14.2 | ≥6.5 |
| Poor | 282 | 24.7± 12.0 | ≥7.5 |
| Diabetes Duration |
| <5 years | 182 | 27.4 ±13.0 | <0.05 |
| >5 years | 155 | 23.6 ± 11.5 | |
The distribution of patients with low and sufficient vitamin D levels has been shown in [Table/Fig-3]. Among the different age groups, gender and different BMI groups, the prevalence of low vitamin D levels was not significant as compared to that of sufficient levels. Patients with poor glycaemic control had a higher prevalence of low vitamin D status (90%) than those with sufficient vitamin D (76%). Similarly, patients with disease duration of more than 5 years had a higher prevalence of low vitamin D status as compared to vitamin D sufficient group (51% vs. 40% 0).
Distribution of patients with low and sufficient vitamin D levels
| Characteristics | Serum 25(OH)D levels | p-value |
|---|
| <25 ug/ml (n=181) | ≥25 ug/ml (n=156) |
|---|
| Age(years) |
| <40 | 33 (18) | 20(13) | NS |
| >40 | 148(82) | 136(87) | NS |
| Gender |
| Males [n(%)] | 79(44)** | 71(46) | NS |
| Females [n(%)] | 102(56) | 85(54) | NS |
| Body mass index(Kg/m2) |
| Normal weight <25, [n(%)] | 19(10) | 11(7) | NS |
| Over weight 25-29.9, [n(%)] | 63(35) | 61(39) | NS |
| Obese >30([n(%)] | 99( 55) | 84( 54) | NS |
| Glycemic control(HbA1c%) |
| Good <6.5% [n(%)] | 7(4) | 19(12) | <0.05 |
| Fair >6.5- <7.5% [n(%)] | 12(7) | 17(11) | <0.05 |
| Poor >7.5% [n(%)] | 162(89) | 120 (77) | <0.01 |
| Diabetes Duration |
| <5 years, [n%)] | 88(49) | 94(60) | <0.01 |
| ≥5 years, [n(%)] | 93(51) | 62(40) | <0.01 |
* t-test, ** Chi-square test, NS: p>0.05
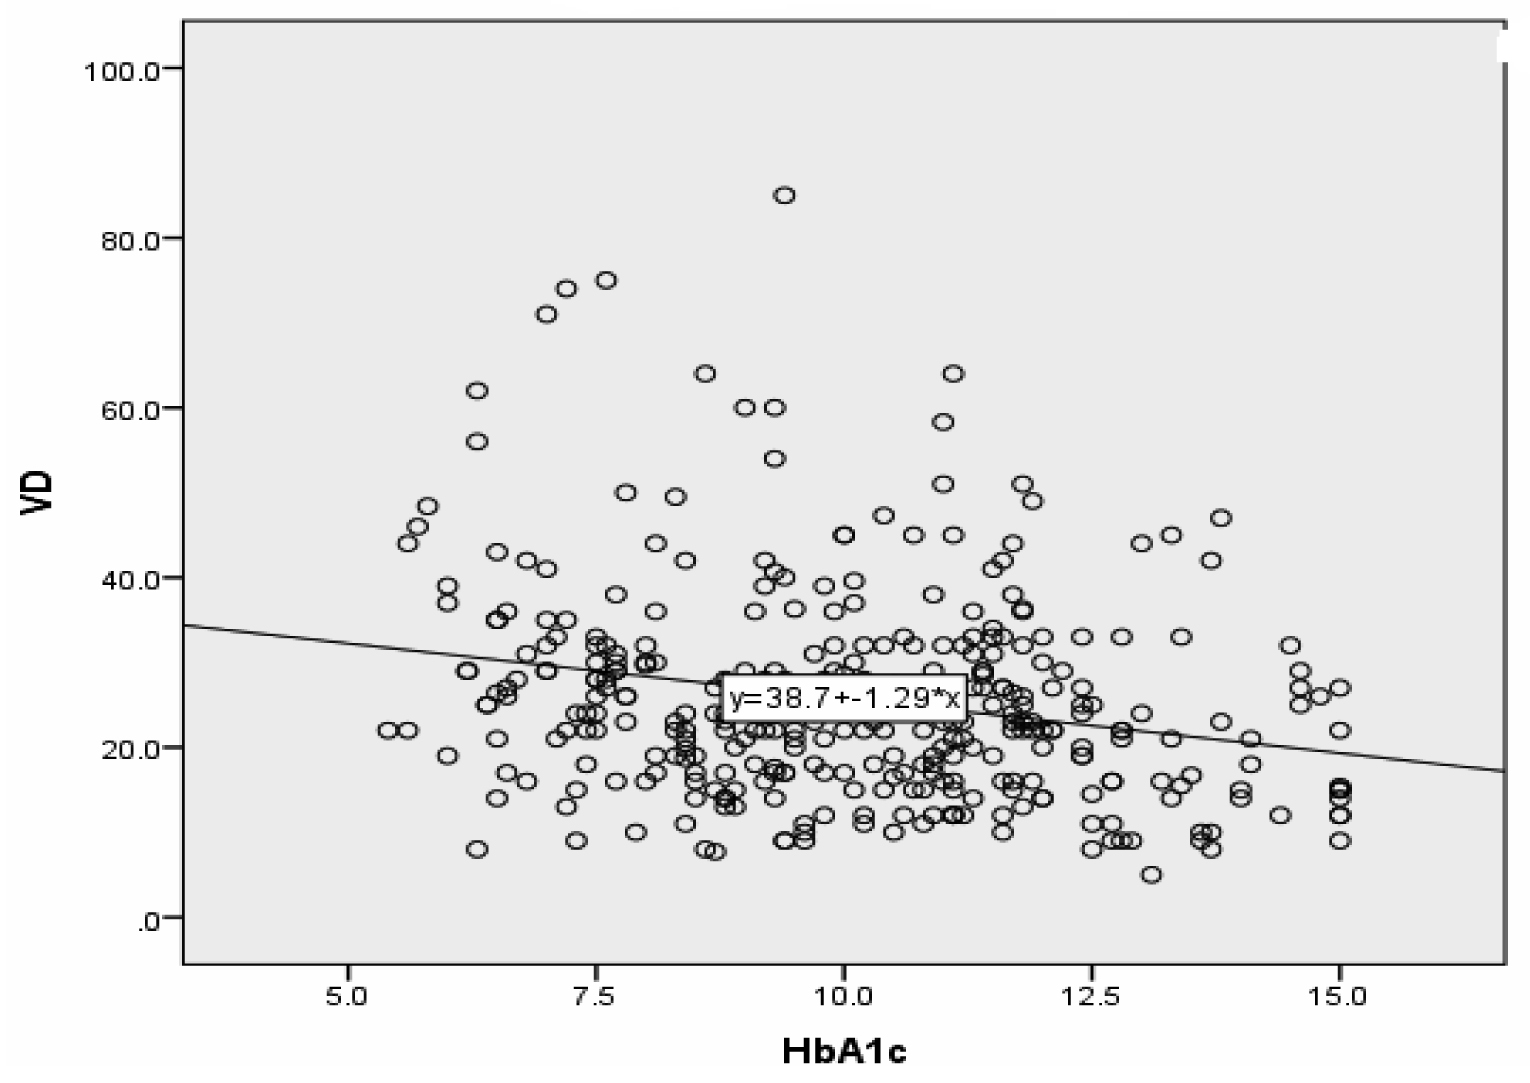
On using the Pearson’s correlation coefficient (r), the results showed a significant inverse relationship between serum 25 (OH) D concentrations and HbA1c %( r=-0.238, p<0.01) [Table/Fig 4]. The correlations between serum 25 (OH) D concentrations and age, BMI, and duration of disease were not statistically significant (r=0.04, r=0.03, and r= -0.153), respectively.
Relation of 25(OH) D with HbA1c
Discussion
In several cross-sectional studies, patients with Type 2 DM or glucose intolerance were found to have lower serum vitamin D concentrations as compared to individuals without diabetes [9,10]. In this study, we found that around two thirds of the patients and that about one third of the controls had low vitamin D status (25(OH) D concentration <25 ng/ml). Such a high prevalence of low vitamin D status is worth mentioning. It is favourably comparable to values from the developing countries [11], but it is markedly higher than values of diabetic and normal populations in western countries [12,13]. The discrepancy of our results as compared to those of other studies may be related partly to the nutritional status. However, several factors are known to make a negative impact on vitamin D status, particularly in diabetic patients. Of these, glycaemic control and diabetes duration are the factors which cause the most marked negative effects on serum 25(OH) D concentrations. There was a trend towards an inverse 25(OH)D-HbA1c association. Patients with poor glycaemic control (as was assessed by HbA1c%) had lower mean serum 25(OH) D concentrations and a higher prevalence of low vitamin D status as compared to those with fair and good glycaemic control. This observation reflects the additive effect of glycaemic control on vitamin D status.
It was difficult to find a high prevalence of low vitamin D status among the studied Kurdish diabetics and in those without diabetes; since vitamin D deficiency has been associated with elevated insulin resistance. We could attribute the high prevalence of low vitamin D status to long duration of diabetes which was found in a large proportion of the studied sample.
The association between vitamin D status and chronic hyperglycaemia seems to reflect the diabetic complications which lead to low vitamin D status. Chronic hyperglycaemia is known to play a role in diabetic nephropathy by decreasing the rate of vitamin D3 hydroxylation in the kidney, which favours a decrease in the synthesis of this vitamin [14].
An alternative aspect was ruled out, as age, sex and BMI, the impacts of these factors on vitamin D status, were less significant. The reason for this remains unclear, although there were a high number of patients with low vitamin D levels and these were females and they were older and obese.
However, the finding of low levels of 25(OH) D in individuals with and without diabetes could then be explained by the insufficient synthesis in the skin and inadequate intake or absorption of vitamin D. Limited exposure to sun light and low sea food intake may affect vitamin D status in these groups. Despite this high prevalence, no studies had been carried previously on vitamin D status in our population.
Limitations
Firstly, sampling in this present study done at Diabetes Center, which is a health facility and health facility, was more likely to be biased than those in population based randomized studies. Secondly, our study was a cross-sectional analysis which had limitations, as it followed research methodology. It lacks follow up, so the data presented are less likely to be representative of the actual data of general population. Thus, this also applies to the same diabetic patients at other times. Despite these limitations, our descriptive study, interpreted with suitable caution, can offer some useful insight, to complement the data from the forthcoming studies using randomization and follow up.
Conclusion
This study indicated that low vitamin D status was present in two thirds of patients with type 2 diabetes, particularly among patients with poor glycaemic control and in those with longer diabetes durations. Therefore, we recommend the routine screening of vitamin D status in patients with DM type 2. Vitamin D supplementation may be an effective public health intervention means, to improve the vitamin D status of the population.
*Results are mean +SD, NS: p>0.05
* t-test, ** Chi-square test, NS: p>0.05