The increased cell proliferation in the odontogenic epithelium can result from perturbations in cell cycle regulators, mutations tumour supressor genes and genetic mutations [4]. Investigating cell kinetics of epithelial lining of these cystic lesions may be helpful in asessing their biological behaviour [5].
Proliferating Cell Nuclear Antigen (PCNA) is a 36kDa acidic non histone nuclear protein important for DNA synthesis. In the presence of replicating factor C, a multi sub unit complex, PCNA allows DNA polymerase to initiate leading strand for DNA synthesis [6]. PCNA expression may be used as a marker of cell proliferation because cells remain longer time in G1 – S phase when proliferating. An increase in PCNA levels may be induced by growth factors or as a result of DNA damage in absence of cell cycle [7].
The aim of the present immunohistochemical study is to investigate the role of PCNA in the epithelial linings of these selected odontogenic lesions to predict their biological behaviour.
To compare and evaluate PCNA labelling index 4 different odontogenic lesions of (n=15) radicular cyst, (n=15) OKC, (n=15) dentigerous cyst and (n=15) ameloblastoma.
Material and Methods
A retrospective study was done to evaluate the expression of PCNA using immunohistochemistry in formalin fixed, paraffin embedded tissue specimens (archival tissues). The study was conducted in the Department of Oral and Maxillofacial Pathology, Ragas Dental College and Hospital, Chennai, India and was approved by Institutional Review Board (IRB).
The study material comprised of 60 formalin fixed, paraffin embedded tissue specimens archival blocks randomly selected from department of oral pathology with adequate clinically, radiographically and histologically confirmed cases of dentigerous cyst (Group I, n=15), radicular cyst (Group II, n=15) odontogenic keratocyst (Group III, n=15) and ameloblastoma (Group IV, n=15).
Immunohistochemistry (IHC) Procedure
A 5μ sections from paraffin embedded blocks were made and transferred onto the amino propyl epoxy silane (APES) coated slides. The slides with tissue sections were treated with three changes of xylene to remove paraffin wax, followed by descending grades of alcohol and rehydration with water. The slides were then transferred to citrate buffer and autoclaved for antigen retrieval at 15 lbs pressure for 15 minutes. The slides were allowed to cool and washed in phosphate buffer solution (PBS) (pH 7.2) for 5 minutes. Peroxidase and protein blocking were done using 3% hydrogen peroxide and protein block reagent respectively for 10 minutes each. The slides were incubated with primary antibodies (Anti–Human PCNA, PC10 Prediluted in PBS (Biogenex, USA) at room temperature for overnight and for 2 hours. The secondary antibody used was an enhancer followed by streptavidin solution for 20 and 30 minutes respectively from the secondary polymer kit (Biogenex). A drop of freshly prepared DAB (3’ Diaminobenzidine Tetrahydrochloride - a substrate chromogen) was added. Three changes of PBS washes were performed after every step during the immunostaining procedure. The sections were counter stained with hematoxylin and mounted with DPX®.
Criteria for evaluation of PCNA staining
The following parameters were used to evaluate PCNA staining
The cellular localization of stain in the nucleus.
Nuclei with brown color regardless of staining intensity were regarded as positive.
Tissue localization of stain – basal layer or suprabasal layer of the epithelium
Labelling index (LI)
PCNA positivity was calculated by dividing the number of positive cells by the total number of cells counted in the slide and expressed as percentage for PCNA. The percentage of PCNA was evaluated from a minimum of 1000 nuclei per case. A minimum of thousand cells was counted for each slide (LI = Number of positive cells /Total number of cells counted x100).
Results and Observations
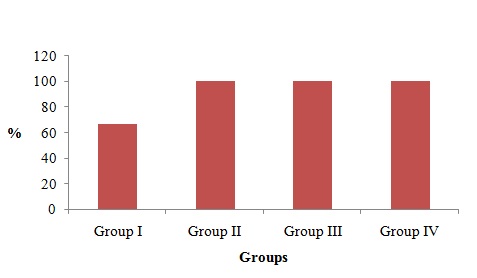
Distribution of PCNA staining among 4 groups in the epithelium
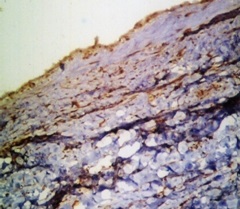
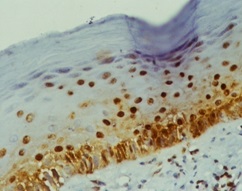
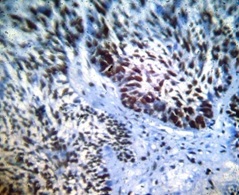
PCNA revealed positivity in all the Groups I, II, III and IV. In Group I 66.6% n=10) showed positivity [Table/Fig-1] and (n=5) 33.3% showed negative staining. In Group III 80% (n=12) showed positive staining in the epithelium [Table/Fig-2], and Group II [Table/Fig-3] and Group IV [Table/Fig-4], the cases showed 100% staining. There was significant difference (P=0.001) in the staining pattern. [Table/Fig-5 and 6].
PCNA staining in dentigerous cyst
PCNA staining in radicular cyst)
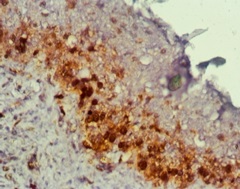
PCNA staining in odontogenic keratocyst)
PCNA staining Ameloblastoma
PCNA positive staining among study groups
| Group I | Group II | Group III | Group IV | p-value |
|---|
| n | % | n | % | n | % | n | % | 0.001* |
| 10 | 66.6 | 15 | 100 | 15 | 100 | 15 | 100 |
PCNA positive staining among study groups
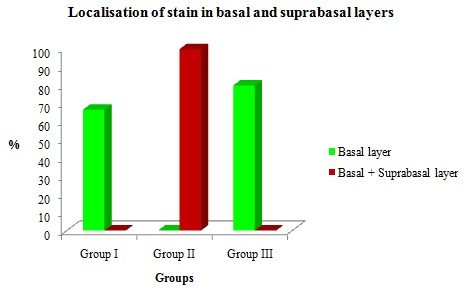
Distribution of expression in the basal layer and suprabasal layers among the cyst.
PCNA staining was present in the basal layer among three study groups. In Group II (n=15)100% of cases showed staining in both basal and suprabasal layer. In Group I and II none of the cases have shown suprabasal positivity. There was no significant difference in the basal and suprabasal layers among the study groups [Table/Fig-7 and 8].
Localization of stain in basal and suprabasal layers among odontogenic cysts
| Groups | Localization | p-value |
|---|
| Basal Layer | Basal and Supra-basal | No stain | 0.131 |
| n | % | n | % | n | % |
| Group I | 10 | 66.6 | 0 | 0 | 5 | 33.3 |
| Group II | 0 | 0 | 15 | 100 | 0 | 0 |
| Group III | 12 | 80 | 0 | 0 | 3 | 20 |
Localization of stain in basal and suprabasal layers in odontogenic cysts. (Pearson Chi–square value test)
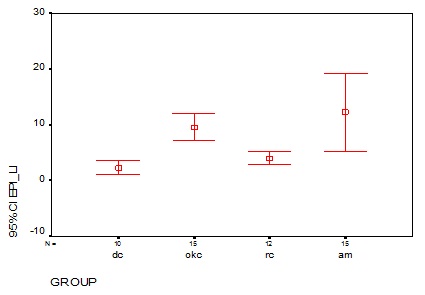
Comparison of mean labelling index among the study groups
In Group I, 10/15 cases showed nuclear staining and their mean labelling index were 2.3 ± 1.6. In Group II, 15/15 cases showed nuclear staining which had the mean labelling index of 9.5 ± 4.4. In Group III, 12/15 case showed nuclear staining and its mean labeling index is 3.9 ± 1.8. The mean labelling index for ameloblastoma were 12.2 ± 12.6. There was significant difference in the mean labeling index among the groups (p=0.00) [Table/Fig-9 and 10].
PCNA labelling index in the odontogenic epithelium among the study groups. (Mann-Whitney U–Test)
| Groups | s | p-value |
|---|
| Mean | SD | Median | 0.000* |
| Group I (n=10) | 2.31 | 1.63 | 1.75 |
| Group II (n=15) | 9.58 | 4.42 | 9.30 |
| Group III (n=12) | 3.99 | 1.86 | 3.80 |
| Group IV (n=15) | 12.25 | 12.64 | 4.30 |
PCNA labelling index in the odontogenic epithelium among the study groups
Discussion
Various studies on molecular alterations are now proposed to be responsible for the development and biological behavior of these cyst in particular the OKC [2,3]. The role of PCNA is a marker of normal cellular proliferation, and its overexpression suggests deregulated DNA synthesis and genomic instability [7]. Cell proliferation in odontogenic lining epithelium may be induced in response to various growth factors, cells tress [8].
In the present study, our results are consistent with the studies of A. Patelli et al., Browne et al., [1,9], which shows lower PCNA expression in radicular and dentigerous cyst although they have different origin. Marcia Gaiger et al., [10], suggested the plausible cause of minimal PCNA positivity in dentigerous cyst is because of the inflammatory stimuli as a result of eruptive process, this may make cells to proliferate, but may be inconstant and present only for a short time.
Bando et al., [11], suggested that in radicular cyst the inflammatory stimulus (cytokines) increases cell proliferation from the continous aggression caused by the bacterial contamination of the root canal, which may inhibit degradation of p53 protein and increase the level of PCNA in the absence of cell cycling, in contrast to which the stimuli is only for short periods in dentigerous cyst.
Distribution of PCNA positive cells within OKC linings differed significantly from that in other odontogenic cyst, with greater than 95% of stained cells located in suprabasal layers, this could probably suggest increased growth factors (Efgr) in OKC [12,13], and higher level of cytokines(IL-1) stimulates epithelial cell proliferation directly and/or indirectly by inducing the secretion of some factors like keratinocyte growth factor with increased activity of keratin layers [14], which may contribute to the higher thickness of the epithelium in OKC.
In our study, PCNA staining was 100% in both OKC and ameloblastoma. In amelobastoma cases our results were consistent with other studies in which cells at the periphery stained intensely than the central cells, which could be because these cells may be similar to ameloblast of enamel organ which are metabolically active (increased PCNA), in comparision to central stellate reticulum like cells [15,16].
In our study comparing PCNA indices among the OKC and ameloblastoma, the OKC had no higher labelling index (mean 9.58) than ameloblastoma (mean12.25), but had higher labelling indices than DC (mean 2.31) and RC (mean 3.99). Our results were not in accordance with findings of Takahashi and Fujita [17], wich suggests that OKC has higher labelling indices than Ameloblastoma.
Conclusion
The results of this study shows that although these cyst are classified as lesions of different origin, the cellular proliferation is governed by many molecular factors (growth factors, P53) which influences the PCNA expression. Among the cyst OKC has higher cellular kinetics in comparision to DC and RC, which suggest that OKC has intrinsic growth potential, similar to ameloblastoma and hence it has been reinforced as KCOT (Keratocystic odontogenic tumour) in the recent classification. However larger sample size and further studies are needed using DNA assays to analyse if any cell cycle perturbations or gene mutations play a role in pathogenesis of these tumours.