HbA1C is widely used for the assessment of glycemic status of the diabetic patients and the American Diabetes Association (ADA) recommended its use for diagnosing diabetes [1]. Studies have shown variation in HbA1C levels in different conditions like Haemoglobinopathies, chronic kidney diseases, pregnancy even in the absence of diabetes mellitus [2]. Conditions that can affect erythrocyte turnover or survival may falsely elevate or lower the A1C levels [3–6]. Recent studies have shown its spurious elevation in hypothyroidism in the absence of diabetes [7].
Material and Methods
Study Population
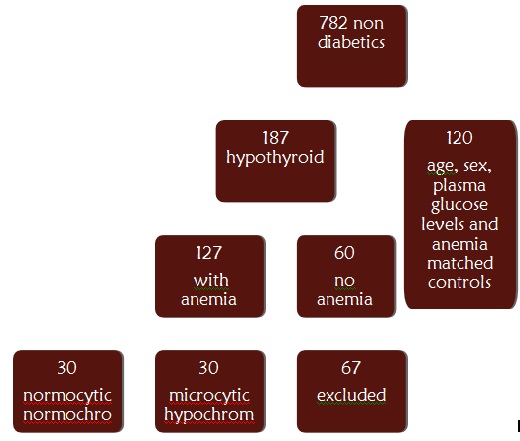
The data of the patients attending Kasturba Medical College Hospital, Ambedkar circle between January 2011 to August 2012 was collected. The study was approved by institutional research and ethics committee. The study participants [Table/Fig-1] were residents of Southern India mainly from in and around Mangalore, India. We collected the data of 782 subjects aged 18 years and above who had HbA1C, peripheral smear, Haemoglobin, mean corpuscular Haemoglobin (MCH), mean corpuscular volume (MCV), mean corpuscular Haemoglobin concentration (MCHC), serum ferritin, serum TSH and plasma glucose levels estimated. A total of 187 were found to be non-diabetic who were diagnosed as having Hypothyroidism based on their TSH levels. It was made sure that the patients were non-diabetic (Fasting Plasma Glucose <100 mg/dl) and HbA1C estimation was carried out as a part of our laboratory package in an attempt to investigate the endocrinological disorders in detail. Of these 60 non anemic subjects and 123 anemic subjects were selected. Out of the anemic cases 30 subjects with hypochromic microcytic anaemia and 30 subjects with normocytic normochromic anaemia were selected and 63 were excluded based on exclusion criteria. Similarly 30 microcytic hypochromic anemic, 30 normocytic normochromic anemic and 60 non anemic euthyroid controls matched for sex and plasma glucose levels were included in our study [Table/Fig-1]. Microcytic hypochromic anaemia was defined as microcytic hypochromic picture on peripheral smear, low Hb levels( <12g% in males, <11g% in female), predominantly microcytic indices (MCV<76 fL) and hypochromic indices (MCH<27 pg/cell). Normocytic normochromic anaemia was defined as low Hb levels, normocytic normochromic red cell indices and peripheral smear picture. Ferritin levels were used to further define the possible etiology of anaemia. Males with ferritin levels <29ng/ml and females with ferritin levels <20 ng/ml with microcytic hypochromic anaemia were considered as having iron deficiency anaemia, those with normal ferritin levels were considered as having anaemia due to endocrine disorder. Pregnant patients, patients having haemolytic anaemia, other Haemoglobinopathies, anaemia due to other chronic illnesses and abnormal renal function test (Serum Urea, Creatinine and eGFR) were excluded from our study.
Nasal septum of rat: OM-olfactory mucosa, RM-respiratory mucosa, A-arc of perpendicular plate, B-cribriform plate, C-ceiling of oral cavity
Measurements
High performance liquid chromatography (HPLC) method was used to measure HbA1C levels(The Bio-Rad D-10™ Haemoglobin A1c Program, Bio-Rad Laboratories, Inc., Hercules, CA). Method of estimation and analyser used to perform it were same throughout the period of study.
Haemoglobin and red cell indices were estimated using Beckman Coulter LH780 automated counter. Serum Ferritin (Elecsys Ferritin immunoassay kit) and Serum TSH (Elecsys TSH immunoassay kit), were estimated by Electrochemiluminescence method using Roche Hitachi cobas e411 analyser(Roche Diagnostics GmbH, Mannheim). Plasma glucose estimation was done by glucose oxidase peroxidase method ( Agappe diagnostic kits, Ernakulam, Kerala) using Roche hitachi P800 analyser (Roche Diagnostics GmbH, Mannheim).
Statistical Analysis
Data was analysed using IBM SPSS Statistics 20. The data are presented as Mean ± SD. Anova with Tukey’s test was applied for comparison of group means. Pearson’s coefficient of correlation was calculated to determine the correlation between two variables. Categorical data was analysed by χ2 test. Odds ratio and 95% confidence intervals (CIs) were obtained by the use of logistic regression analyses. P value less than 0.05 was considered statistically significant.
Results
Subject characteristic are as shown in [Table/Fig-2]. Females showed more predisposition towards being hypothyroid and anemic than males.
| Type | Microcytic Hypochromic | Normocytic Normochromic | Non-anemic |
|---|
| Haemoglobin (g/dl) | 9.45 ± 1.28 | 9.97 ± 0.87 | 13.8 ± 1.13 |
| Ferritin (ng/ml) | 7.72 ± 4.93 | 175.4 ± 34.41 | 208.5 ± 21.6 |
| MCV (fL) | 57.2 ± 6.11 | 79.12 ± 9.92 | 85.1 ± 4.2 |
| MCH (pg/cell) | 15.9 ± 4.7 | 31.7 ± 6.3 | 33.5 ± 2.33 |
| Plasma Glucose (mg/dl) | 84.8 ± 9.1 | 87.1 ± 6.3 | 86.3 ± 7.7 |
| TSH (μIU/ml) | 34.12 ± 13.6 | 30.32 ± 11.5 | 35.65 ± 14.9 |
| Female: Male ratio | 28:2 | 24:6 | 45:15 |
HbA1C was around 6.57 ± 0.69 in anemic cases as compared to 5.91 ± 0.41 of non anemic cases. HbA1C levels in different types of anaemia are as shown in [Table/Fig-3]. According to the table HbA1C levels in normocytic normochromic anaemia were lower (6.32 ± 0.75) as compared to the microcytic hypochromic anaemia (6.82 ± 0.71) and differences between their respective control groups were statistically significant.
Distribution of HbA1C (%)in hypothyroid cases and controls according to type of anaemia *p <0.05, **p <0.001, ***p<0.0001
| Hypothyroid | Euthyroid |
|---|
| Group | Total | Female | Male | Total | Female | Male |
| Microcytic hypochromic | 6.82 ± 0.71** | 6.87 ± 0.75*** | 6.55 ± 0.43* | 6.43 ± 1.07 | 6.47 ± 1.19 | 6.36 ± 0.88 |
| Normocytic normochromic | 6.32 ± 0.75* | 6.46 ± 0.45*** | 5.93 ± 0.31* | 5.87 ± 0.46 | 6.01 ± 0.46 | 5.70 ± 0.21 |
| Non-anemic | 5.91 ± 0.41 | 5.99 ± 0.36* | 5.80 ± 0.26 | 5.46 ± 0.62 | 5.61 ± 0.58 | 5.45 ± 0.67 |
As shown in [Table/Fig-4], odds of anemic patients having HbA1C >6.5 were 3.163 (1.426-7.016). Patients with overt hypothyroidism did not show significant odds ratio (0.998 [0.113-2.017]).
Odds ratio of A1C>6.5 for anaemia and degree of hypothyroidism *p <0.05
| Female (A1C >6.5) | Male(A1C >6.5) | Total (A1C>6.5) |
|---|
| Odds ratio | 95% C.I. | Odds ratio | 95% C.I. | Odds ratio | 95% C.I. |
|---|
| Anaemia | 3.312* | 1.118-6.987 | 3.001 | 0.987-6.512 | 3.163* | 1.426-7.016 |
| TSH>14 | 1.001 | 0.227-1.247 | 0.789 | 0.333-4.321 | 0.998 | 0.113-2.017 |
While calculating pearson’s coefficient of correlation, no correlation was found between TSH and plasma glucose levels in cases. No significant correlation was found between TSH and HbA1C in cases.
There was weak and borderline significant negative correlation found between HbA1C and erythrocyte indices in microcytic hypochromic anaemia. (MCV, r= -0.23, p=0.06 & MCH, r=-0.58, p= 0.05). While in case of normocytic normochromic anaemia no such correlation was found.
Discussion
Our results showed elevation of HbA1C in microcytic hypochromic and normocytic normochromic anaemia patients. Elevation was more in microcytic hypochromic anaemia. Etiology of microcytic anaemia may be iron deficiency, early stages of anaemia due to endocrine diseases, thalassemia and anaemia of chronic diseases. Because we had excluded anaemia due to other Haemoglobinopathies and chronic diseases, based on the ferritin levels we could ascertain that those with iron deficiency anaemia had higher levels of HbA1C when compared to anaemia of endocrine diseases. There was no significant correlation found between HbA1C and TSH & Plasma glucose levels and TSH.
Hypothyroidism and diabetes are the most common endocrine disorders found in Indian population. Both the diseases co-exist. The prevalence of thyroid disease in patients with diabetes mellitus is approximately 10-15% [13,14]. Studies done in hypothyroid patients showed elevated HbA1C not only in the presence of diabetes but also in non-diabetic subjects. Hence the role of HbA1C as a marker of diabetes was questioned in such conditions especially when American Diabetes Association has endorsed it as diagnostic criteria for diabetes mellitus. When studies were done to evaluate the cause of these elevated HbA1C, Kim et al., [7] found in their study that they were attributed to anaemia associated with it. A number of studies have shown that iron deficiency anaemia is mostly associated with elevated HbA1C levels [2]. Other conditions where iron deficiency anaemia play a pivotal role in elevating HbA1C levels are chronic kidney diseases and pregnancy [15,16]. Hypothyroidism is mainly complicated by normocytic normochromic anaemia which may be early iron deficiency anaemia due to nutritional deficiency or it may be secondary to hypothyroidism itself.
Incidence of hypothyroidism and anaemia is more in females. Hence, this group is more vulnerable to have elevated HbA1C even in the absence of diabetes mellitus. Our study group also had more female subjects than the males.
Odds ratio for HbA1C above 6.5% is more in anemic patients. Hence anemic patients have more odds of being misdiagnosed as having diabetes when compared to non anemic subjects. No significant linear correlation was found between TSH and HbA1C levels in our study and Odds of Patients with overt hypothyroidism had non significant odds ratio for HbA1C > 6.5%. Hence effect of severity of hypothyroidism on HbA1C levels could not be explained by this study. Kim et al., [7] found elevated A1C in overt hypothyroid patients which were lowered after thyroid hormone therapy. Since we could not obtain the post therapy data of the patients, our study could not explain the effect of thyroid hormone therapy on HbA1C levels.
There was no significant correlation found between HbA1c and erythrocyte indices in case of normocytic normochromic anaemia but significant negative correlation was found between HbA1C and hypochromic index in microcytic hypochromic anaemia (MCH, r=-0.58, p= 0.05). Kim et al., [7] found improvement in red cell indices after thyroid hormone therapy and pallavi et al., [17] found in their study that MCH, MCHC and RDW were lower in prediabetic and diabetic group classified on the basis of HbA1C levels when compared to normoglycemic group. Previous studies have found association between red cell survival and elevated A1c levels [18,19]. Hence, red cell morphology alone may not completely explain the elevated A1C levels, rather red cell survival time gives a better explanation of it. We did not measure the erythrocyte lifespan, which was one of the limitations of our study.
There was no significant correlation found between HbA1C and TSH. Overt hypothyroid patients did not show significant odds ratio for HbA1C>6.5. In a study done on diabetic subjects, amela et al[20] found significant positive correlation between TSH and HbA1C. Our subjects were non-diabetic, hence presence of diabetes could be a criteria for HbA1C to be associated with TSH [20].
There was no significant correlation found between plasma glucose levels and TSH. Patients suffering from diabetes showed association in previous studies. Our study subjects were non-diabetic, hence presence of diabetes could be a criteria for plasma glucose levels to be associated with TSH.
All the cases are non-diabetic and most of the factors which can interfere with glycation of Haemoglobin like chronic kidney diseases, Haemoglobinopathies, pregnancy and Haemolytic anaemia were excluded, which strengthen our study.
The limitations however include inability to measure the RBC life span & also the lack of knowledge of treatment. The findings of the study also need to be validated in larger cohort.
Conclusion
Elevated HbA1C in hypothyroidism can be attributed to anaemia. Hence it is recommended to consider it before diagnosing diabetes solely on the basis of HbA1C. Still a RBC life span study is needed to prove the exact pathology behind this elevation.