History
In 1909 Lawrence Henderson at Harvard described how the neutral reaction of blood is determined by carbonic and organic acids being in equilibrium with an excess of mineral bases over mineral acids [1]. He set down his now familiar mass action equation stating that the hydrogen ion concentration is proportional to the ratio of carbonic acid to bicarbonate, placing bicarbonate at the centre of the acid base stage.
Between 1914 and 1930, Donald Van Slyke and others at the Rockefeller Institute elegantly established our acid base fundamentals [2]. These pioneers recognised that carbonic acid converts into bicarbonate all non volatile mineral bases not bound by mineral acids and determined therefore that bicarbonate represents the alkaline reserve of the body [3]. They advocated that bicarbonate, measured at standard pCO2, should be a physiological constant, and showed how well this measures acidosis caused by increased production or decreased elimination of organic acids, i.e. diabetic ketoacidosis and nephritis respectively [4].
However, they noted that bicarbonate given to diabetic patients improved their low plasma bicarbonate, but not their high urine acid excretion, measured as urine titratable acid plus ammonia [5]. They also recognised that increasing pCO2 caused chloride to shift into cells increasing plasma titratable alkali [6]. Despite these indications that changing mineral base influences pH, their theory based on the assumption that mineral base is fixed, has become our dogma.
Standard acid base teaching uses the Henderson-Hasselbalch equation to interpret blood gases, identifying acidosis or alkalosis caused by abnormalities in carbonic acid, measured from pCO2 and referred to as the respiratory component, or by abnormalities in bicarbonate, calculated in the blood gas analyser and referred to as the metabolic component.
Most clinicians consider bicarbonate to be the base that buffers carbonic and organic acids in the body, particularly since sodium bicarbonate is used to treat metabolic acidosis. As a weak acid controlled by respiration, carbonic acid is the most important buffer diminishing pH change in response to acid/alkaline load, but bicarbonate cannot be the base that actually neutralizes organic and carbonic acids, accounting for the slightly alkaline blood pH of 7.4.
In 1978 Kildeberg and Winters presented the theory of net base balance describing how carbonic acid and organic acids, such as lactic acid, produced by metabolism are instead neutralised in the body by mineral base, measured as the excess of mineral cations over anions [7]. This allows the metabolic components of acid base balance to be identified. Metabolic acidosis with low bicarbonate may be an organic acidosis caused by high organic acid levels (lactic acidosis) or a mineral acidosis caused by low mineral base levels (hyperchloraemic acidosis), whereas metabolic alkalosis with high bicarbonate can only be caused by a mineral alkalosis with high mineral base levels (hypochloraemic alkalosis), because organic acid levels are normally low.
The Henderson-Hasselbalch equation no longer takes centre stage and instead of considering bicarbonate to be a base, it is used as a measure of the amount of carbonic acid that has dissociated to release hydrogen ions, in the same way that sodium measures the sodium hydroxide concentration, chloride the hydrochloric acid concentration and lactate the lactic acid concentration. Sodium bicarbonate corrects a mineral acidosis, but not an organic acidosis, by allowing a strong base, sodium hydroxide, to be given with a weak acid, carbonic acid, that is eliminated by respiration.
The theory of net base balance had in fact been recognised much earlier by Shohl and Sato, while working with Gamble at Johns Hopkins in 1921, when they investigated the effect of adding hydrochloric acid or sodium bicarbonate to the normal diet of three male infants, by meticulously performing 3 day mineral base balance studies [8]. In 1945 Darrow et al reported that healthy preterm infants develop hyperchloraemic metabolic acidosis when fed Protein Milk Powder, providing 5.7 mmol of chloride compared to 2.0 mmol of sodium per 100 kcal. Balance studies confirmed that the acidosis was caused by the retention of more chloride than sodium [9].
In 1970 urine net hydrogen ion excretion in preterm infants was reported to be low in the first 3 days compared to term infants [10] and then to increase with postnatal age from 1 to 4 weeks following the time course of their metabolic acidosis [11]. In one of these studies, metabolic acidosis was clearly shown to be due to the retention of chloride in excess of sodium for the first 14 days, but this finding was not recognised at the time or later [12]. Reports of metabolic acidosis in infants given Total Parenteral Nutrition (TPN) showed that the tendency to cause acidosis was related to how much more chloride than sodium TPN regimens contain, but once again this finding was not recognised at the time or later [13,14].
This article describes how mineral base balances carbonic and organic acids. The following article presents 3 prospective cohort studies of mineral balance and arterial blood gases in preterm infants receiving TPN which show that the composition of parenteral fluids, renal function and the rate of protein catabolism affect mineral base and organic acid, thereby accounting for the acid base status of these infants.
The Theory of Acid Base Balance
Change in blood pH depends on change in the concentrations in mmol/L of three categories of acids and bases in plasma and extracellular fluid (ECF).
1. Carbonic Acid

Carbon dioxide, produced by aerobic metabolism and eliminated via the lungs, circulates in blood at a concentration controlled by the respiratory system, where it reacts with water to form carbonic acid. Blood gas analysers measure pH, PCO2 and PO2 and calculate bicarbonate from the Henderson-Hasselbalch equation:
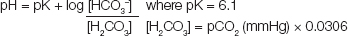
The respiratory component of acid base balance is determined by PCO2. Bicarbonate measures the amount of carbonic acid that has dissociated to release hydrogen ions with negligible amounts of carbonate formed at blood pH.
The metabolic component is measured by base excess, defined as the amount of acid or base needed to restore pH to 7.4 at a normal pCO2 of 40mmHg and temperature 37°C. The measurement least influenced by acute changes in pCO2 is extracellular fluid base excess, which blood gas analysers calculate from pH and bicarbonate using experimentally determined formulae, describing the buffering capacity of blood and ECF, given in the Siggaard-Andersen Curve Nomogram [15].
2. Mineral Base

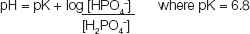
Mineral base is measured as the excess of mineral cations over anions. Phosphate has an average negative charge of 1.8 at pH of 7.4 determined from the equation:
The measurement of mineral base has an inherently large standard error, ± 2.3 mmol/L, mainly due to the ± 1 mmol/L error in measuring sodium and chloride.
The mineral base concentration of plasma reflects that of ECF, which is determined by the ECF content of mineral base divided by the ECF volume.
Change in the ECF content of mineral base depends on the balance of mineral base, measured as intake – urine + stool + sweat output in mmol/kg/day, and on the retention of mineral base in cells or bone.
Change in ECF volume depends on change in water balance, measured simply as change in weight, and on change in the fraction of body weight made up by ECF (ECF fraction).
A model has been described to analyse these changes in preterm babies given TPN, from measurements of plasma mineral concentrations and weight at the beginning and end of balance periods, during which the external balance of minerals was measured as intake minus urine output, ignoring stool and sweat losses as insignificant [16].
Calcium, phosphate, potassium and magnesium are largely present in bones and cells. Virtually all calcium is in bone, which contains calcium and phosphate in a molar ratio of 10:6 [17].
Under stable conditions, with no change in plasma K, Ca, Mg or PO4, the rates at which these minerals enter and leave ECF are equal and so they do not contribute to change in ECF mineral base content. Instead they contribute to bone mineral base retention and soft tissue mineral base retention. These may be measured as follows, if the small amounts of intracellular sodium and chloride are ignored.
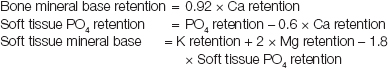
Sodium and chloride are largely confined to ECF in the body and change in their plasma concentrations are determined by changes in weight, ECF fraction and external balance. Therefore, under stable conditions, change in the ECF content of mineral base can be measured simply as follows:

3. Organic Acid
Metabolisable acid makes up the anion gap and, from the law of electroneutrality, plasma metabolisable acid can be measured as follows:

Under normal circumstances, protein anion makes up more than half of metabolisable acid in plasma, where it provides colloid osmotic pressure necessary to balance hydrostatic pressure in tissue circulation. Because the protein concentration of interstitial fluid is very low, change in protein anion contributes little to change in metabolisable acid in ECF, which instead is determined by change in plasma non-protein metabolisable acid, or more simply organic acid, measured as follows:

The equation for measuring protein anion assumes an albumin: globulin ratio in plasma of 1.6:1 [18]. In fact the ratio in preterm babies is around 2:1, but this difference changes the calculation of protein anion very little. When measuring organic acid, the charge on phosphate should in principle be corrected for the actual pH rather than 7.4, just as the charge on bicarbonate and protein anion are calculated according to the actual pH. However once again this changes organic acid little, much less than the error of measuring mineral base.
The organic acids in plasma are normally produced in small amounts by body tissues. Some of these are the intermediary products of metabolism, such as lactate, pyruvate, free fatty acids and ketones. These are cleared from plasma partly by being taken up and metabolised by other tissues particularly the liver, and partly by being excreted by the kidneys. Other organic acids are the end products of protein or purine catabolism, such as sulphate and urate respectively, and these must be eliminated in the urine since they cannot be metabolised further. As a rule organic acids are freely filtered through the glomeruli and not reabsorbed by the renal tubules.
The normal plasma concentrations of these organic acids during the first week after birth in healthy term infants, well preterm and small for gestational age babies are shown in [Table/Fig-1]. There is little data regarding sulphate. In preterm babies 3-10 days old, urine sulphate excretion is about 0.15mmol/kg/day [31], which would give a plasma sulphate concentration of 0.15mmol/L at a normal glomerular filtration rate of 1.0 L/kg/day. Other organic acids, such as acetate, citrate, gluconate, oxalate, nitrate, bile acids and conjugated bilirubin, are normally present in trace concentrations below 0.1mmol/L, similar to the concentrations of trace cations, such as iron, zinc and copper [32]. Ignoring trace anions, plasma organic acid levels in healthy term infants, calculated as the sum of measured values corrected for anion charge, is 5.3 mmol/L at 1-6 hours, falling to 4.9 mmol/L at 24-48 hours and 3.5 mmol/L at 7 days, with somewhat higher concentrations in well preterm babies, as shown in [Table/Fig-1].
Normal plasma concentrations in mmol/L of organic acids in healthy term, preterm and small for gestational age (SGA) newborns during the first week. Total organic acid takes into account negative charge of 2 on sulphate and 3 on urate
| Organic acid mmol/L | 1-6 hours | 24-48 hours | 7 days | Infants | Ref |
|---|
| Lactate (arterial) | 1.50 ± 0.50 2.40 ± 0.70 | 1.00 ± 0.15 1.70 ± 0.50 | 0.90 ± 0.25 | Term Preterm | [19, 20] |
| Pyruvate | 0.15 ± 0.03 | 0.13 ± 0.02 | 0.12 ± 0.03 | All | [19, 21] |
| Free fatty acids | 1.41 ± 0.34 1.23 ± 0.51 1.52 ± 0.37 | 1.00 ± 0.32 1.36 ± 0.68 0.50 ± 0.20 | 0.86 ± 0.22 | Term Preterm SGA | [21, 22, 23, 24] |
| Ketones | 0.43 ± 0.33 0.15 ± 0.15 | 0.90 ± 0.40 0.10 ± 0.06 | 0.44 ± 0.21 | Term SGA | [22, 25, 26] |
| β-OH butyrate | 0.29 ± 0.20 0.17 ± 0.12 0.26 ± 0.19 | | | Term Preterm SGA | [21] |
| Acetoacetate | 0.05 ± 0.05 0.03 ± 0.03 0.04 ± 0.03 | | | Term Preterm SGA | [21] |
| Urate | 0.31 ± 0.09 0.36 ± 0.13 0.46 ± 0.16 | 0.32 0.16-0.57 0.41 ± 0.14 | 0.20 0.14-0.34 0.17 ± 0.05 | Term 34-37wk 29-33wk | [27, 28, 29] |
| Sulphate | 0.47 0.29-0.95 | | 0.15 | Term Preterm | [30, 31] |
| Acetate citrate gluconate others | Trace | | | | [32] |
| TOTAL | 5.27 ± 1.59 6.30 ± 2.07 | 4.93 ± 1.33 | 3.46 ± 1.06 | Term Preterm | |
The standard error of organic acid calculated by the difference between mineral base and bicarbonate is large, like that of mineral base. However whatever the error in measuring mineral base, the base excess is mathematically equivalent to subtracting the deviation in calculated organic acid from normal from the deviation in measured mineral base from normal.
Normal Acid Base Balance
Acid base balance is regulated by the respiratory system, which controls the rate of CO2 elimination to match varying rates of CO2 production thereby keeping PCO2 normal, and by the kidneys, which control the rate of mineral base excretion to maintain the appropriate plasma mineral base concentration to keep bicarbonate normal. The appropriate plasma mineral base to achieve normal bicarbonate of 24.5 mmol/L, at normal pH of 7.4 and PCO2 of 40 mmHg, and at normal organic acid of 3.5 mmol/L, depends on the protein level and is given by the following equation:

The degree of abnormality of a particular mineral base concentration is measured as follows:

The factors determining urine mineral base excretion are readily appreciated by applying the law of electroneutrality to urine cations and anions as follows:
In urine Mineral base = Organic acid + Bicarbonate – Ammonium.
When measuring urine mineral base, the charge on phosphate should be corrected for urine pH, which varies over a wide range. In this equation organic acid is the excess of organic acids over organic bases, normally present only as creatinine, which is corrected for when titrating urine organic acid [33,34].
Plasma organic acid affects the rate of mineral base excretion, because filtered organic acids are not reabsorbed and must be accompanied by cations in the urine. The kidneys control the rate of mineral base excretion, to accommodate to varying rates of carbonic or organic acid production, by varying the rate of hydrogen ion secretion, formed from carbonic acid in renal tubular cells. High rates of hydrogen ion secretion completely reabsorb filtered bicarbonate and increase ammonium excretion, formed by the reaction of hydrogen ions with glycine and glutamine in renal tubular cells. This decreases mineral base excretion and makes urine acid. Low rates of hydrogen ion secretion do not fully reabsorb filtered bicarbonate, which is therefore excreted with little ammonium. This increases mineral base excretion and makes urine alkaline.
Acid Base Abnormalities
The cell membrane anion exchange mechanism allows bicarbonate, chloride, phosphate and organic anions to interchange across cell membranes according to the Gibbs-Donnan law of equilibrium [6,35–39]. An increase in any of these anions results in a reciprocal fall in the other anions. By this mechanism, cell proteins and organic acids, which are weak acids, participate as buffers diminishing change in extracellular pH resulting from acid base abnormalities.
Carbonic and lactic acidosis both produce cell chloride uptake, which increases extracellular mineral base reducing pH change. Furthermore changes in carbonic acid cause inverse changes in lactic and organic acids, which again reduce pH change. While high carbonic acid protects intracellular pH by producing low lactic and organic acids, the converse, low carbonic acid exposes the cells to the risks of high lactic and organic acids. Replacing carbonic acid, a very weak acid with lactic acid, a stronger acid with a pK of 3.86, or sulphuric acid, a very strong acid, may adversely affect cell function.
The cell membrane Na/K and other ion exchange mechanisms do not alter acid base balance [16,36].
Accumulation of carbon dioxide and lack of oxygen are the two most important causes of acid base disturbance in clinical practice. These two processes affect the distribution of the major acids and bases in the body differently, because of different effects on cell adenosine tri-phosphate (ATP) supplies.
Accumulation of Carbon Dioxide
When lung abnormalities interfere with the elimination of carbon dioxide, carbonic acid accumulates in cells and extracellular fluid. Tissue oxygen delivery is maintained by oxygen and ventilator therapy with preserved cardiac function assisted by vasodilation caused by hypercapnoea. Cell ATP levels are sustained, allowing lactic and organic acids to fall to very low levels, which, together with the increase in extracellular mineral base caused by cell chloride uptake, reduces the fall in pH as carbon dioxide accumulates. The kidneys increase renal tubular hydrogen ion secretion, and over a few days extracellular mineral base rises further, partly correcting the respiratory acidosis.
Lack of Oxygen
By contrast impaired cardiac function or loss of blood volume may decrease oxygen delivery to tissues causing shock, which prevents aerobic metabolism. Cell ATP levels diminish despite the modest contribution from anaerobic metabolism, which generates lactic acid in increasing amounts in cells and extracellular fluid [40]. Bicarbonate falls as it is converted to carbonic acid, which is eliminated by hyperventilation, and cell chloride uptake increases extracellular mineral base, both reducing the drop in pH.
As cells consume ATP they release inorganic phosphate into extracellular fluid. Cell protein catabolism and blood glucose increase in an effort to maintain energy production [41–43] and this releases potassium from cells often in excess of phosphate [16], thereby further increasing extracellular mineral base. This rises even more when sodium bicarbonate or blood products containing sodium citrate are given to the patient. Whilst high mineral base diminishes the fall in blood pH caused by lactic acidosis, it does not improve tissue oxygenation. Shock impairs kidney function, preventing any compensatory increase in renal hydrogen ion secretion as well as the elimination of organic acids.
[1]. Henderson LJ, Das Gleichgewicht zwischen Basen und Säuren im Tierischen OrganismusErgebn physiol 1909 8:254 [Google Scholar]
[2]. Van Slyke DD, Studies of acidosis II. A method for the determination of carbon dioxide and carbonates in solutionJ Biol Chem 1917 30:347-68. [Google Scholar]
[3]. Van Slyke DD, Studies of acidosis I. The bicarbonate concentration of the blood plasma; its significance, and its determination as a measure of acidosisJ Biol Chem 1917 30:289-46. [Google Scholar]
[4]. Stillman E, Van Slyke DD, Cullen GE, Fitz R, Studies of acidosis VI. The blood, urine and alveolar air in diabetic acidosisJ Biol Chem 1917 30:405-56. [Google Scholar]
[5]. Fitz R, Van Slyke DD, Studies of acidosis IV. The relationship between alkaline reserve and acid excretionJ Biol Chem 1917 30:389-400. [Google Scholar]
[6]. Van Slyke DD, Wu H, McLean FC, Studies of gas and electrolyte equilibria in the blood V. Factors controlling the electrolyte and water distribution in the bloodJ Biol Chem 1923 56:765-849. [Google Scholar]
[7]. Kildeberg P, Winters RW, Balance of net acid: Concept, measurement and applicationAdvs in Pediatrics 1978 25:349-81. [Google Scholar]
[8]. Shohl AT, Sato A, Acid base metabolism I. Determination of base balanceJ Biol Chem 1923 58:235-55. [Google Scholar]
[9]. Darrow DC, Da Silva NM, Stevenson SS, Production of acidosis in premature infants by protein milkJ Pediatr 1945 27:43-58. [Google Scholar]
[10]. Allen AC, Usher R, Renal acid excretion in infants with the respiratory distress syndromePediatr Res 1971 5:345-55. [Google Scholar]
[11]. Kerpel-Fronius E, Heim T, Sulyok E, The development of the renal acidifying processes and their relation to acidosis in low-birth-weight infantsBiol Neonat 1970 15:156-68. [Google Scholar]
[12]. Sulyok E, The relationship between electrolyte and acid-base balance in the premature infant during early postnatal lifeBiol Neonate 1971 17:227-37. [Google Scholar]
[13]. Heird WC, Dell RB, Driscoll JM, Grebin B, Winters RW, Metabolic acidosis resulting from intravenous alimentation mixtures containing synthetic amino acidsN Engl J Med 1972 287:943-48. [Google Scholar]
[14]. Chan JCM, Asch MJ, Lin S, Hays DM, Hyperalimentation with amino acid and case in hydrolysate solutions. Mechanisms of acidosisJAMA 1972 220:1700-05. [Google Scholar]
[15]. Siggaard-Andersen O, The acid-base status of the blood 1964 BaltimoreWilliams & Wilkins [Google Scholar]
[16]. Aiken CGA, Sherwood RA, Kenney IJ, Furnell M, Lenney W, Mineral balance studies in sick preterm intravenously fed infants during the first week after birth. A guide to fluid therapyActa Paediatr Scand 1989 Suppl 355 [Google Scholar]
[17]. Harrison HE, The sodium content of bone and other calcified materialJ Biol Chem 1937 120:457-62. [Google Scholar]
[18]. Van Slyke DD, Hastings AB, Alma Hiller A, Sendroy J, Studies of gas and electrolyte equilibria in the blood XIV. The amounts of alkali bound by serum albumin and globulinJ Biol Chem 1928 79:769-80. [Google Scholar]
[19]. Koch G, Wendel H, Adjustment of arterial blood gases and acid base balance in the normal newborn infant during the first week of lifeBiol Neonat 1968 12:136-61. [Google Scholar]
[20]. Yu J, Payne WW, Ifekwunigwe A, Stevens J, Biochemical status of healthy premature infants in the first 48 hours of lifeArch Dis Child 1965 40:516-25. [Google Scholar]
[21]. Stanley CA, Anday EK, Baker L, Delivoria-Papadopolous M, Metabolic fuel and hormone responses to fasting in newborn infantsPediatrics 1979 64:613-19. [Google Scholar]
[22]. Persson B, Gentz J, The pattern of blood lipids, glycerol and ketone bodies during the neonatal period, infancy and childhoodActa Paediatr Scand 1966 55:353-62. [Google Scholar]
[23]. Soltesz G, Mestyan J, Jarai I, Fekete M, Schultz K, Glucose utilization and the changes in plasma nutrients after intravenously injected glucose in premature infants kept at or below the neutral temperatureBiol Neonat 1971 19:241-52. [Google Scholar]
[24]. Soltesz G, Metsyan J, Schultz K, Rubecz I, Glucose disappearance rate and changes in plasma nutrients after intravenously injected glucose in normoglycaemic and hypoglycaemic underweight newbornsBiol Neonat 1972 21:184-98. [Google Scholar]
[25]. Aynsley-Green A, Bloom SR, Williamson DH, Turner RC, Endocrine and metabolic response in the human newborn to first feed of breast milkArch Dis Child 1977 52:291-95. [Google Scholar]
[26]. Haymond MW, Karl IE, Pagliara AS, Increased gluconeogenic substrates in the small for gestational age infantN Engl J Med 1974 291:322-28. [Google Scholar]
[27]. Wharton BA, Bassi U, Gough G, Williams A, Clinical value of plasma creatine kinase and uric acid levels during the first week of lifeArch Dis Child 1971 46:356-62. [Google Scholar]
[28]. Marks JF, Kay J, Baum J, Curry L, Uric acid levels in full term and low birth weight infantsJ Pediatr 1968 73:609-11. [Google Scholar]
[29]. Stapleton FB, Renal uric acid clearance in human neonatesJ Pediatr 1983 103:290-94. [Google Scholar]
[30]. Cole DEC, Scriver CR, Age dependent serum sulfate levels in children and adolescentsClin Chim Acta 1980 107:135-39. [Google Scholar]
[31]. Scott PH, Wharton BA, Biochemical values in the newbornTextbook of Neonatology. Ed Roberton NRC2nd EditionChurchill Livingstone [Google Scholar]
[32]. Eastham RD, Biochemical values in clinical medicine 1985 7th EditionWright Bristol [Google Scholar]
[33]. Van Slyke DD, Palmer WW, Studies of acidosis XVI. The titration of organic acids in urineJ Biol Chem 1920 41:567-85. [Google Scholar]
[34]. Palmer WW, The titration of organic acids in urineJ Biol Chem 1926 68:245-49. [Google Scholar]
[35]. Collip JB, The acid-base exchange between the plasma and the red blood cellsJ Biol Chem 1921 46:61-72. [Google Scholar]
[36]. Doisy EA, Eaton EP, The relation of the migration of ions between cells and plasma to the transport of carbon dioxideJ Biol Chem 1921 47:377-93. [Google Scholar]
[37]. Van Slyke DD, Hastings AB, Murray CD, Sendroy J, Studies of gas and electrolyte equilibria in blood. VIII The distribution of hydrogen, chloride and bicarbonate ions in oxygenated and reduced bloodJ Biol Chem 1925 65:701-28. [Google Scholar]
[38]. Hastings AB, Sendroy J, McIntosh JF, Van Slyke DD, Studies of gas and electrolyte equilibria in blood. XIII The distribution of chloride and bicarbonate in the blood of normal and pathological human subjectsJ Biol Chem 1928 79:193-209. [Google Scholar]
[39]. Riegel C, The rate of disappearance of sodium lactate injected intravenously and its effect upon sugar and inorganic phosphate of the bloodJ Biol Chem 1927 74:135-48. [Google Scholar]
[40]. Riegel C, Formation of lactic acid in the body after severe haemorrhageJ Biol Chem 1927 74:123-34. [Google Scholar]
[41]. Buell MV, Studies of blood regeneration. 2 Effect of hemorrhage on nitrogen metabolismJ Biol Chem 1919 40:63-77. [Google Scholar]
[42]. Brunquist EH, Schneller EJ, Loevenhart AS, The effects of anoxemia on nitrogen metabolismJ Biol Chem 1924 62:93-115. [Google Scholar]
[43]. Tatum AL, Alkaline reserve capacity of whole blood and carbohydrate mobilization as affected by hemorrhageJ Biol Chem 1920 41:59-73. [Google Scholar]