Evaluation of Glycated Albumin and Microalbuminuria as Early Risk Markers of Nephropathy in Type 2 Diabetes Mellitus
Suresh Babu Kondaveeti1, Kumaraswamy D2, Shishir Mishra3, Aravind Kumar R4, I Anand Shaker5
1 Lecturer, Department of Biochemistry, Melmaruvathur Adhiparasakthi Institute of Medical Science & Research, Melmaruvathur, Tamil Nadu, India.
2 Lecturer, Department of Pharmacology, SRM Medical College Hospital & Research Center, Kattankalathur, Chennai, Tamil Nadu, India.
3 Lecture, Department of Pharmacology, SRM Medical College Hospital & Research Center, Kattankalathur, Chennai, Tamil Nadu, India.
4 Lecturer, Department of Physiology, Melmaruvathur Adhiparasakthi Institute of Medical Science & Research, Melmaruvathur, Tamil Nadu, India.
5 Associate Professor, Department of Biochemistry Melmaruvathur Adhiparasakthi Institute of Medical Science, & Research, Melmaruvathur, Tamil Nadu, India.
Name, Address, E-Mail Id of The Corresponding Author: Dr Suresh Babu Kondaveeti, Department of Biochemistry, MAPIMS, Melmaruvathur – 603319, Tamil Nadu, India.
Phone: 09860286520
E-mail: suri.thedreamer@gmail.com
Introduction: Since Glycated Albumin (GA) reflects short term variations and glycated protein shows degrees of hyperglycaemia, the objective of this study was to find GA and microalbuminuria as a early risk markers along with the duration of Uncontrolled Diabetes Mellitus in type 2 diabetic nephropathy.
Material and Methods: The present cross-sectional study included randomly selected Uncontrolled Type 2DM (n = 75), controlled Type 2DM (n = 75) and healthy controls (n = 75). Their fasting venous blood samples were obtained for GA and serum creatinine, while their morning urine samples were obtained for detection of microalbuminuria. Statistical analysis was done by using SPSS, version 16.0. One-Way ANOVA was performed. All p-values which were ≤ 0.05 were considered as statistically significant.
Results: The mean GA, microalbuminuria and serum creatinine were the highest in Uncontrolled DM as compared to those in Controlled DM respectively. Microalbuminuria and GA had a significant correlation with the duration of diabetes (p<0.0001).
Conclusion: The present study identified that the risk of microalbuminuria increased with a poor glycaemic control. A persistent increase in GA and microalbuminuria may be considered as risk markers in diabetic nephropathy. Therefore, a regular screening for microalbuminuria and estimation of GA can help in the clinical management, to prevent complications.
Glycated albumin, Microalbuminuria, Diabetic nephropathy
Introduction
Metabolic derangement syndrome is one of the cause of Diabetes Mellitus (DM) and it is frequently associated with permanent and irreversible functional and structural changes in the cells of the body, particularly vascular system changes which lead in turn to the development of well defined clinical entities which are called the complications of diabetes mellitus, which affect the eye, kidney and the microvascular and nervous systems. During abnormal glucose homeostasis, body fails to produce insulin due to D.M, which is characterised by hyperglycaemia and impairement in all metabolisms due to a deficiency in insulin secretion [1]. In type 2 D.M, >80% of the patients were diagnosed the single most end stage renal disease. Some of the western studies have shown that out of 44% ESRD patients, >80% were suffering from Type 2 D.M [2]. Some of the Indian studies have shown that the prevalence of microalbuminuria ranged from 19.7% to 28.5% in type 2 D.M [3]. Diabetic nephropathy is a common consequence of prolonged D.M, which appears to result from the involvement and complex interaction between genetic and environmental factors [4]. The pathological basis of elevated urinary albumin excretion which is caused by protein glycosylation, with advanced glycated end products and their deposition, results in hypertrophy of glomerular and renal systems, which in turn, leads to the leakage of low molecular weight proteins (albumin) [5]. The continuous persistent leakage of these proteins into urine results in overt diabetic nephropathy, which results in the gradual development of ESRD and cardiovascular complications [6]. Testing for glycated albumin (GA) levels is slowly becoming an established practice in different labs. More and more scientific and clinical research which has been done, has pointed that GA is associated with diabetes, as a direct cause of several significant areas of diabetes complications. It has become clear that GA plays a dual role: as an indicator or a marker of intermediate glycation, and as a causative agent of the damage of diabetes complications. The present study was carried out to evaluate microalbuminuria in relation to GA and duration of diabetes. Microalbuminuria and GA were measured as risk markers of renal damage and glycaemic control respectively.
Materials
The objective of the present study was to determine the prevalence of microalbuminuria in relation to GA and associated risk factors among type 2 diabetic patients. Ethical clearance was obtained from the institutional ethical committee (Regd. No. MAPIMS /958/PO/ac/09/CPCSEA) as well as oral informed consents were obtained from the subjects. The present study was conducted from January 2009 to December 2011.
Inclusion Criteria
Among 345 diabetic patients who visited the diabetic out patients clinic of a tertiary hospital of Kancheepuram and MAPIMS and R, 225 subjects who were aged between 40-60 years, who were of either sex, with known histories of type 2 DM were chosen [based on the screening recommendations of the American Diabetes Association (ADA)]. The study had 3 groups: Group A consisted of patients who were on a default antidiabetic treatment [Uncontrolled DM (n=75)], Group B comprised of patients who were on a regular antidiabetic treatment [Controlled DM (n=75)] and Group C included age-matched healthy controls (n=75).
Exclusion Criteria
Diabetic patients who were suffering from any other medical problems such as infections, chronic kidney disease, hypertension, angina and acute coronary syndrome, coronary bypass surgery or precutaneous coronary interventions were excluded from the study.
Methodology
A purposive random sampling technique was used for the data collection. Venous blood samples were collected after 12 hours of fasting into two test tubes; one with no anticoagulant for serum creatinine, and the other with an anti coagulant for FBG, which were analyzed in an Olympus AU 400 auto analyser. Serum creatinine was analyzed by using alkaline picrate, by Jaffe’s Method (Biocon®Kit, Germany). Plasma GA levels were measured by an enzymatic method by using albumin specific protease, ketoamine oxidase and an albumin assay reagent on a Hitachi Auto analyser (Lucica GA-L, Asahi Kasei Pharma Corp, Tokyo, Japan) [7,8]. GA was hydrolyzed to amino acids by albumin specific proteinase and then, it was oxidised by ketoamine oxidase to produce hydrogen peroxide, which was measured quantitatively. The GA value was calculated as the percentage of GA which was relative to total albumin, which was measured by the bromocresol purple method. Twenty four hour urine samples were collected in containers (without preservatives) for analysis of albumin. Microalbuminuria was estimated by ion-exchange high performance liquid chromatography (HPLC, sigma Aldrich Ascentis® Chennai) India.
Statistical Analysis
The statistical analysis was done by using SPSS, version 16.0. One Way ANOVA method was applied to observe the association between microalbuminuria and GA and duration of diabetes. A p value of ≤ 0.0001 was considered as statistically significant.
Results
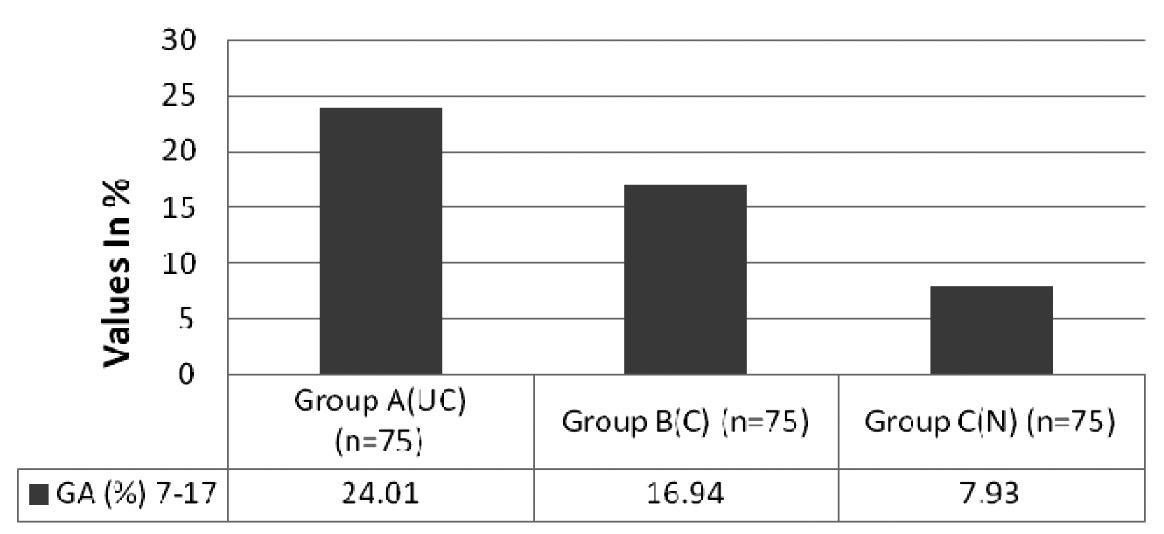
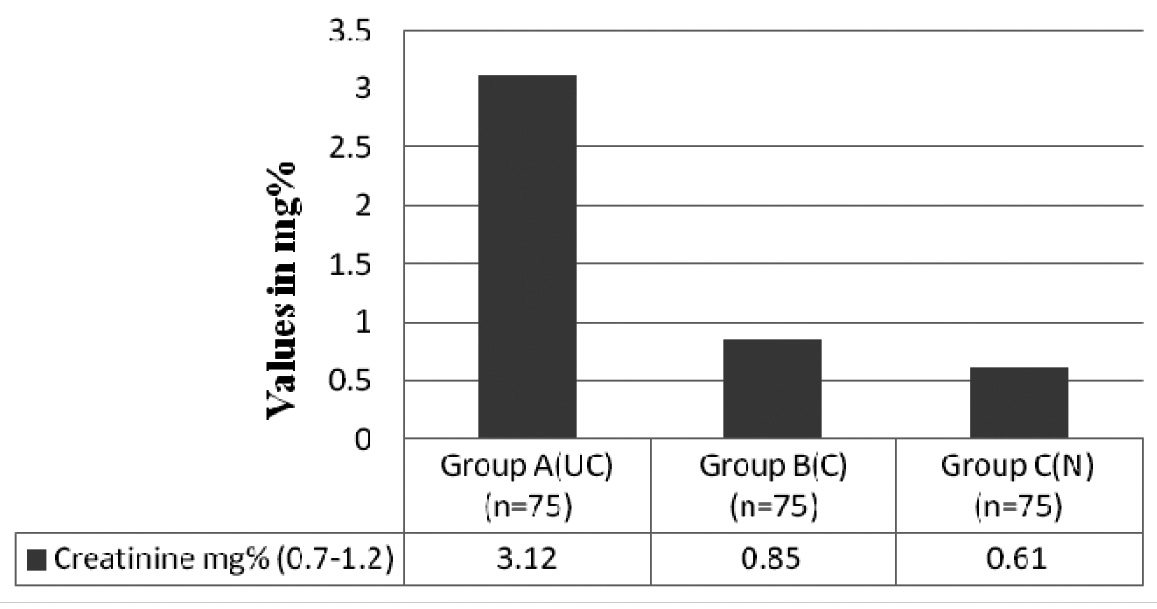
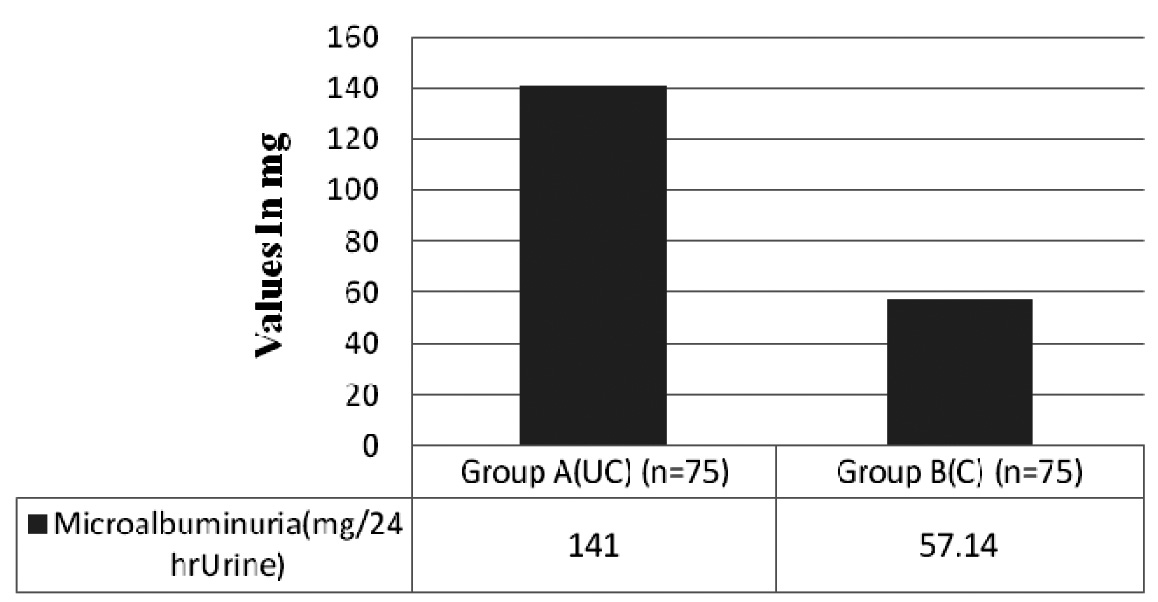
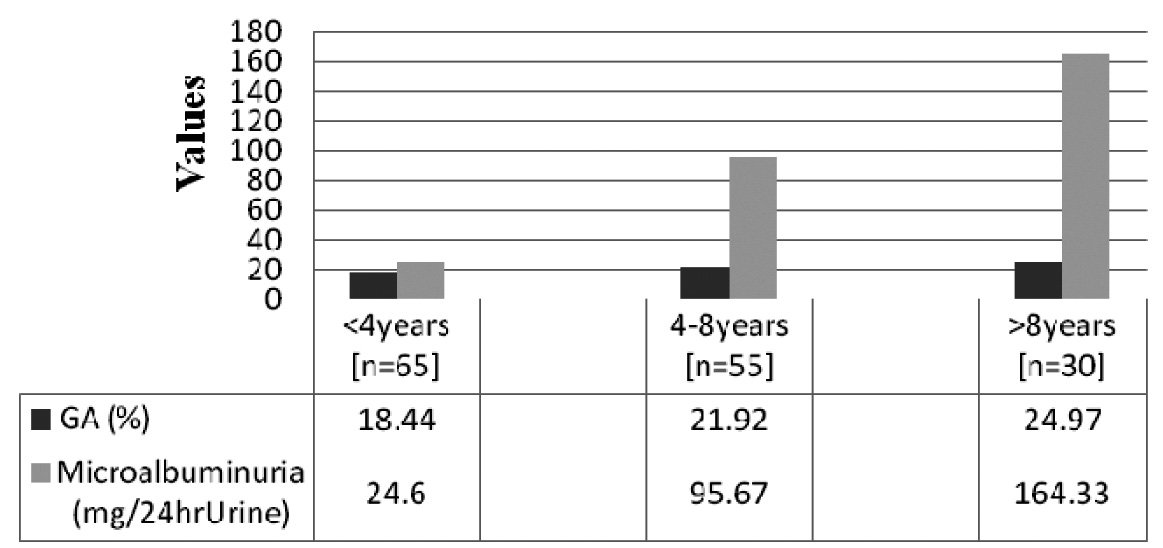
Among the 150 Type 2DM patients who were studied [controlled and uncontrolled groups], 45% had a family history of diabetes and the male:female ratio was 1.17:1. In [Table/Fig-1], the glycaemic control of Group A, Group B and Group C were compared between diabetic patients and healthy controls with serum creatinine levels [The reference level for glycated albumin which was recommended by the American Diabetes Association] [9]. Microalbuminuria was compared between controlled and uncontrolled diabetic patients, which has been shown in [Table/Fig-2]. According to [Table/Fig-1] and [Table/Fig-2], the Microalbuminuria increased significantly with a poor glycaemic control and it correlated with elevated serum creatinine levels, which indicated a renal damage (p<0.0001). The parameters of the studied groups according to duration of diabetes have been summarised in [Table/Fig-3]. In Type 2DM patients, microalbuminuria and glycaemic control showed a significant linear correlation with duration of diabetes (p<0.0001) [Table/Fig-4].
Comparison of Glycated Albumin levels between Group A, B and C GA: F ratio – 392.41, degree of freedom- 2, p value < 0.0001 Group A (UC) = uncontrolled blood sugar level in Type 2 D.M with increased GA levels Group B (C) = controlled blood sugar level in Type 2 D.M with moderate increase GA levels Group C (N) = normal subjects with Normal GA levels
Comparison of Serum Creatinine levels between Group A, B and C Serum Creatinine: F ratio – 65.19, degree of freedom - 2, p value < 0.0001. Group A (UC) = uncontrolled Type 2 D.M subjects with altered creatinine levels Group B (C) = controlled Type 2 D.M subjects with normal creatinine levels Group C (N) = normal subjects with creatinine levels with in the range
Comparison of Microalbuminuria between Group A (uncontrolled), Group B (controlled) Microalbuminuria: F ratio – 67.82, degree of freedom - 1, p value < 0.0001. Group A (UC) = un controlled Type 2 D.M subjects showing higher percentage of microalbuminuria Group B (C) = controlled Type 2 D.Msubjects showing microalbumunuria with in the range Group C – Microalbuminuria was not seen, they were normal subjects
Duration of uncontrolled Type 2 DM with Mibcoalbuminuria and Glycated Albumin F ratio – 408.50, degree of freedom– 2, p value < 0.0001. Group 1 =levels of GA and the prevalence of microalbuminuria in uncontrolled Type 2 D.M less than 4 years Group 2 = levels of GA and the prevalence of microalbuminuria in uncontrolled Type 2 D.M between 4-8 years Group 3 = nlevels of GA and the prevalence of microalbuminuria in uncontrolled Type 2 D.M more than 8 years
Discussion
Our study has presented data on prevalence and association of microalbuminuria with altered glycated albumin levels in type-2 diabetes mellitus. The prevalence of microalbuminuria in our study was 37%, which was higher in comparison to that in the study by Ghai et al., where the prevalence was reported to be 25% [10]. The prevalence of microalbuminuria in the present study was high, because of the fact that most of the patients were on irregular treatment, with a poor glycaemic control and because of the small sample size. It showed that the good glycaemic control was the strong influencing factor which played a key role in transition of normicroalbumunuric subjects to microalbuminuric. There was a statistically significant linear relationship between the degree of albuminuria and altered GA levels, because of factors like the duration of diabetes and glycaemic control. GA plays a double role in diabetes complications. In addition to being a marker for glycation, glycated albumin has been directly implicated to have a role in several major complications of diabetes, which include atherosclerosis, nephropathy, retinopathy and cognitive functions [11]. Several recent studies have confirmed that the point measurements of GA and glycated haemoglobin (HbA1c) are closely correlated, and that values for glycated albumin accurately represent the equivalent values for HbA1c. Levels of GA change more rapidly over time, in response to the changes in treatment (as are reflected by changes in fasting plasma glucose) than do the levels of HbA1c [12,13]. The normal cut off value for GA in our population was derived by using control group and it was 15% (range 7-17%). Our cut off value was within the range which was reported in the Japanese population. The reference interval of GA was 12.3–16.9% according to Japan Diabetes Society. The normal GA % range in US population (11.6% ± 1.6) was slightly lower than our cut off value [14]. Protein glycation is both a marker for diabetes complications and an underlying cause of those complications. The purpose of diabetes monitoring is to help diabetics in controlling glycation. Diabetes is currently monitored by a combination of daily testing of the Short Term Monitoring of Blood Glucose (SMBG) and long-term testing (HbA1c). A monthly diabetes monitoring test which is based on GA has the potential to provide better information for monitoring glycation [15].
Our study showed a negative correlation between microalbuminuria and creatinine clearance, which was insignificant statistically. And all the subjects in our study who were found to have normal creatinine clearance and serum creatinine levels which were dependent on the renal haemodynamics, systemic blood pressure, urinary findings, and susceptibility to therapeutic interventions which were made for diabetic nephropathy were categorised into different stages. There is elevated glomerulation with no albuminuria in the initial renal hyperfusion stage. In the second stage, which is called clinical latency stage, there is increased glomerular filtration with no albumin in the urine. The third stage which is called incipient nephropathy, shows normal glomerular filtration and presence of microalbuminuria which occur in patients who suffer from D.M for more than five years. There is a decrease in glomerular filtration, macroproteinuria and other clinical manifestations of nephropathy in the subsequent stage, which will finally end up in ESRD, with suppressed glomerular filtration and very high albumin levels in urine [6]. On the basis of the above discussion, we can conclude that microalbuminuria may not associated with abnormal creatinine or creatinine clearance.
Present study showed a positive correlation between microalbuminuria and the duration of diabetes mellitus, with altered GA levels, which was in accordance with many previous reports. There was a direct correlation between the duration of diabetes and the development of microalbuminuria, because of a prolonged exposure to hyper glycaemia as well as deposition of advanced glycated end products. The regular treatment which is given for controlling diabetes will also play a crucial role in the development of type 2 diabetic nephropathy [16–18].
Conclusion
Our study indicated that increased levels of GA and microalbuminuria reflected a quicker response to short – term changes in diabetes treatment and best glycaemic index in uncontrolled diabetes mellitus. This could be due to default treatment and therefore, a regular screening of GA and microalbuminuria should be performed every one month, in addition to the estimation of HbA1C.There is a demonstrated need for an intermediate glycation index for monitoring diabetes. A test which is based on GA can provide a stable monthly index of glycaemic control.
[1]. Report of the expert committee on the diagnosis and classification of diabetes mellitusDiabetes Care 2003 26(Suppl 1):5-20. [Google Scholar]
[2]. 1999 United States Renal Data System Annual Report: National Technical Information Service. US Department of Health and Human Services, Springfield, VA [Google Scholar]
[3]. Satchell S, Tooke JF, What is the mechanism of microalbuminuria in diabetes: a role for the glomerular endothelium?Diabetologia 2008 51:714-25. [Google Scholar]
[4]. Powers AC, Diabetes Mellitus. In: Jameson JL. (editor)Harrison’s Endocrinology 2006 1st edNew YorkMcGraw-Hill:303-04. [Google Scholar]
[5]. Mason RM, Wahab NA, Extracellular matrix metabolism in diabetic nephropathyJ Am Soc Nephrol 2003 14:1358-73. [Google Scholar]
[6]. Vergouwe Y, Soedamah-Muthu SS, Zgibor J, Chaturvedi N, Forsblom C, Snell-Bergeon JK, Progression to microalbuminuria in type 1diabetes: development and validation of a prediction ruleDiabetologia 2010 53:254-62. [Google Scholar]
[7]. Kouzuma T, Study of glycated amino acid elimination for an improved enzymatic glycated albumin measurement methodClin Chim Acta 2004 346:135-43. [Google Scholar]
[8]. Jacobs NJ, Van Denmark PJ, Enzymatic determinationof serum triglycerideBiochem. Biophys 1960 88:250-55. [Google Scholar]
[9]. >American Diabetes AssociationTesting in Asymptomatic PatientsDiabetes Care 2011 34(Suppl 1):13-14. [Google Scholar]
[10]. Ghai R, Verma ND, Goel A, Bhatnagar MK, Kapoor P, Vashishta A, Microalbuminuria in non insulin dependent diabetes and essential hypertension: A marker of severe diseaseJ Assoc Physicians India 1994 42:771-74. [Google Scholar]
[11]. Chujo K, Shima K, Tada H, Oohasi T, Minakuchi J, Kawashima S, Indicators for blood glucose control in diabetics with end-stage chronic renal disease: GHB vs glycated albumin (GA)J Med Invest 2006 53:223-28. [Google Scholar]
[12]. Chalew S, McCarter R, Thomas J, Thomson J, Hempe J, A comparison of the glycosylation gap and haemoglobin glycation index in patients with diabetesJournal of Diabetes and Its Complications 2005 19:218-22. [Google Scholar]
[13]. Hudson PR, Child DF, Jones H, Williams CP, Differences in rates of glycation (glycation index) may significantly affect individual HbA1c results in type 1 diabetesAnnals of Clinical Biochemistry 1999 36:451-59. [Google Scholar]
[14]. Peacock TP, Shihabi ZK, Bleyer AJ, Dolbare EL, Byers JR, Knovich MA, Comparison of glycated albumin and hemoglobin A1c levels in diabetic subjects on hemodialysisKidney Intern 2008 73:1062-68. [Google Scholar]
[15]. (HbA1c) in type 2 diabetic patients: usefulness of GA for evaluation of short-term changes in glycemic controlEndocrinology Journal 2007 1507:6-103. [Google Scholar]
[16]. Dinneen SF, Gerstein HC, The association of microalbuminuria and mortality in non-insulin-dependent diabetes mellitusArch Intern Med 1997 157:1413-18. [Google Scholar]
[17]. Jungmann E, Helling T, Jungmann G, Mertens C, Snelting U, Inetensified conventional insulin therapy in patients with type 2 diabetes mellitus: Positive long-term effects of insulin lispro on metabolic control and microalbuminuriaFortschr Med Orig 2001 118:141-46. [Google Scholar]
[18]. Mogensen CE, Neldam S, Tikkanen I, Oren S, Viskoper R, Watts RW, Randomized controlled trial of dual blockade of renin Angiotensin system in patients with hypertension, microalbuminuria and insulin dependent diabetes mellitus: The candesartan and lisinopril microalbuminuria (CALM) studyBMJ 2000 321:1440-44. [Google Scholar]