Glaucoma is an optic neuropathy with the characteristic appearance of an optic disc and a specific pattern of visual field defects, that is associated frequently but not invariably with a raised IOP. Even though factors other than the IOP are involved, the IOP is the most important risk factor, because it is the only risk factor which we can pharmacomodulate to date. Measurement of the accurate IOP is important not only for classification, but for the clinical management of the glaucoma patients. It is important therefore, to ensure that the IOP readings are taken by using a highly accurate method. Goldmann Applanation Tonometry (GAT) has been considered to be the gold standard for determining the IOP. The study of Ehlers and associates and several other studies have shown that the central corneal thickness affects the accuracy of the applanation tonometry. A reduced corneal thickness of 0.45mm could produce an underestimation of the IOP by up to 4.7mmHg, whereas an increased CCT of 0.59mm could cause an overestimation of 5.2mmHg when the actual IOP was 20mmHg [1]. Therefore, in individuals with thick corneas, the IOP measurement by using GAT may show falsely high readings and low readings for thin corneas.
CCT is an important factor which has to be evaluated when the target IOP levels for the management of the already diagnosed cases of glaucoma are assessed and also during the follow up. Shih CY et al., [2] observed measurement significant adjustments in 55.9% patients and the outcomes significant adjustments in 20.2% patients, based on which the alterations in the glaucoma treatment plan were noted. They concluded that the central corneal thickness had a significant effect on the clinical management of the patients with glaucoma and of the glaucoma suspects. The present study was undertaken to compare the CCT in normal tension glaucoma with that of primary open angle glaucoma, ocular hypertension and normal subjects in our population and to study its effect on the clinical management of the glaucoma patients.
To compare the CCT of Normal tension glaucoma with that of primary open angle glaucoma, ocular hypertension and normal subjects.
The effect of CCT on the diagnosis and management of glaucoma patients.
MATERIAL AND METHODS
This study which compared the CCT of NTG with those of POAG, OHT and the controls, was conducted at the Minto Ophthalmic Hospital, Regional Institute of Ophthalmology, Bangalore, India, from Jan 2004 to Jan 2006, after getting clearance from the institutional board. A total of 99 randomly selected patients who attended the Glaucoma clinic , the OPD and the IPD of the hospital were included in the study.
Inclusion criteria: Normal Tension Glaucoma (NTG) has an untreated IOP of 21mmHg or lower, with an evidence of optic nerve head damage and corresponding visual field loss. Primary open angle glaucoma( POAG) had untreated IOP of greater than 21mmHg, with an evidence of optic nerve head damage and corresponding visual field loss). Ocular Hypertension glaucoma- (OHT) had an untreated IOP of greater than 21mmHg, with a normal optic nerve head and normal visual fields . The controls had an IOP of 21mmHg or lower, with a normal optic nerve head and normal visual fields.
Exclusion Criteria: The eyes with corneal pathologies, previous intra ocular surgeries and secondary glaucoma.
After taking their informed consents, all the subjects were asked for detailed ocular and systemic histories and they underwent thorough ophthalmic examinations. The prelimnary eye examination included the visual acquity and slit lamp biomicroscopy of the anterior segment, to rule out any corneal pathology and refraction. The intraocular pressure was recorded by using Goldmann Applanation Onometry (GAT).Multiple measurements were taken during office hours, to rule out the diurnal variations in the NTG patients. Gonioscopy was done by using a single or a 3 mirror contact to see the type of the angle.The optic nerve head was examined by using a direct ophthalmoscope to look for any damage. Then, a detailed evaluation was done by using a 90D magnifying lens or a Gonio lens after mydriasis. Detailed drawings of the ONH was done, that included the area of cupping and pallor in all the quadrants, the position of kinking of the vessels, splinter haemorrhages and peripapillary changes. Indirect ophthalmoscopy was done to look for any peripheral retinal pathology. The visual fields were assessed by using the automated static perimetry of Octopus 500. Depending upon the degree of the ONH damage, either a G-1 or a M-1 programme was used, after making the necessary refractive corrections.
The central corneal thickness was measured by using an ultrasonic pachymeter on the next follow up visit. The speed of the sound was adjusted at 1640m/sec. After applying a drop of 4% xylocaine for local anaesthesia, the pachymeter tip was placed perpendicularly on the cornea and it was centered over an undilated pupil. The readings were taken when the pachymeter made a beep. From each eye, 3 readings were taken and the average was calculated.
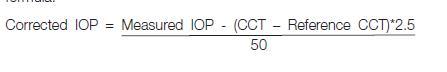
Correction of the IOP based on the CCT
The measured IOPs were corrected by using the linear correction formula.
The Early Manifest Glaucoma Trial observed a 30% reduction in the risk for every 3.0mmHg decrease in the initial IOP. Leske MC et al., [3], in the Early Manifest Glaucoma Trial, reported that each higher (or lower) millimetre of the mercury of the IOP, on follow-up, was associated with an approximate 10% increased (or decreased) risk of progression. With regards to the CCT adjusted IOP values, Shih CY et al., [2] defined the measurement-significant outcomes as IOP corrections of 1.5mmHg or greater (in either direction) and the out-comes significant results as IOP adjustments of 3.0mmHg or greater. In our study, we opted for the same cutoff value and the modification in the glaucoma treatment plan was then noted for the patients with the measurement and outcomes significant IOP adjustments. The changes in the therapy included the addition or discontinuation of the antiglaucoma medications and the recommendation or deferment of a glaucoma incisional surgery.
RESULTS
All the subjects were studied in terms of their ages, IOPs, CCTs and corrected IOPs. Although the observations were made in both the eyes of all the subjects, the right eye of each subject was used for the statistical analysis, so as to compare with other studies. The study population consisted of 64(64.65%) males and 35(35.35%) females, whose ages ranged from 40-79 years, with a mean age of 56.17±7.87 years. The mean age of females was 55.80±6.45 years, which ranged from 40 years to 70 years and the mean age (SD) of the males was 56.38±8.58 years, which ranged from 40 years to79 years. The difference which was observed in the mean age among males and females was not statistically significant (p> 0.05). The mean age of the normal controls was 56.22±8.14 years, that of the NTG group was 57.45±8.51 yrs, that of the POAG group was 57.50±7.45 years and that of the OHT group was 50.58±4.25 years. The difference which was observed in the mean ages among the groups was not statistically significant (p>0.05). The difference observed in mean IOP values among the group was statistically significant in (p<0.005) [Table/Fig-1.1 and 1.2].
| Study groups | N | Mean | SD | Min | Max | f value | p value |
|---|
| NORMAL | 37 | 16.70 | 1.90 | 12 | 20 | 45.26 | <.0001 |
| NTG | 22 | 17.00 | 2.60 | 12 | 20 |
| POAG | 28 | 29.61 | 8.55 | 16 | 54 |
| OHT | 12 | 24.5 | 1.51 | 22 | 26 |
Comparison of IOP b/w Study groups significant at the 0.05 level are indicated by ***
| Comparison | Difference Between Means | |
|---|
| POAG - OHT | 5.107 | *** |
| POAG - NTG | 12.607 | *** |
| POAG - NORMAL | 12.904 | *** |
| OHT - NTG | 7.500 | *** |
| OHT - NORMAL | 7.797 | *** |
| NTG - NORMAL | 0.297 | |
DISCUSSION
Several studies have revealed that the patients with NTG had central corneal thicknesses which were thinner than the normal and that those with OHT had thicker CCTs than the normal CCTs [4–7]. Accordingly, we designed this study for comparing the CCT of the NTG group with those of controls and the POAG and the OHT groups to check whether there was a difference in our population and also to evaluate the effect of CCT on the diagnosis (resultant reclassification) and the management of glaucoma patients because of its effect on the IOP measurement.
In the table [Table/Fig-2], it can be seen that the number of participants in the different studies ranged from 73 to 854 [Table/Fig-2]. The number of NTG patients in our study group was comparable to that of Copt RP et al., [6] and Emara BY et al., [5]. In our study, the CCT of the NTG patients was significantly lower than that of the POAG group, while the OHT patients had significantly higher central corneal thicknesses than those of the controls and the POAG and the NTG groups. No significant difference in the CCT was found between the controls and the POAG patients [Table/Fig-3.1,3.2 and 3.3].
Comparison of number of participants in different studies
| Study group | Number of participants |
|---|
| Normal | NTG | POAG | OHT | Entire sample |
|---|
| Present study | 37 | 22 | 28 | 12 | 99 |
| Morad et al., | 27 | 21 | 25 | - | 73 |
| Emara BY et al., [5] | 50 | 25 | 80 | 16 | 171 |
| Copt RP et al., [6] | 18 | 22 | 49 | 44 | 133 |
| Shah S et al. | 235 | 52 | 335 | 232 | 854 |
Mean CCT of the Entire study sample
| Numbers | RE CCT (μ) | LE CCT (μ) |
|---|
| Mean | SD | Min | Max | Mean | SD | Min | Max |
|---|
| Female(35) | 521.71 | 25.463 | 482 | 602 | 522.71 | 25.91 | 480 | 600 |
| Male(64) | 530.09 | 29.193 | 481 | 610 | 531.02 | 28.664 | 485 | 610 |
| Total(99) | 527.13 | 28.09 | 481 | 610 | 528.02 | 27.85 | 480 | 610 |
| 't' value | -1.43 | | | -1.42 | | |
| 'p' value | 0.1569 | | | 0.1597 | | |
Mean Central Corneal Thickness (CCT) in various study groups
| Study groups | Right Eye- CCT (μ) | Left Eye- CCT (μ) |
|---|
| N | Mean | SD | Min | Max | Mean | SD | Min | Max |
|---|
| Normal | 37 | 527.65 | 21.90 | 481.0 | 562.0 | 528.76 | 22.42 | 480.0 | 565.00 |
| NTG | 22 | 503.91 | 11.31 | 482.0 | 521.0 | 504.36 | 11.07 | 480.0 | 523.00 |
| POAG | 28 | 525.25 | 23.59 | 482.0 | 590.0 | 526.38 | 21.98 | 485.0 | 590.00 |
| OHT | 12 | 572.50 | 22.71 | 540.0 | 610.0 | 572.67 | 22.20 | 540.0 | 610.00 |
| 'f' value | 28.57 | | | | | |
| 'p' value | <.0001 | | | | | |
Comparisons of CCT b/w Study groups significant at the 0.05 level are indicated by ***
| Comparison | Difference Between Means | |
|---|
| OHT - Normal | 44.851 | *** |
| OH T - POAG | 47.250 | *** |
| OHT - NTG | 68.591 | *** |
| Normal - POAG | 2.399 | |
| Normal - NTG | 23.740 | *** |
| POAG - NTG | 21.341 | *** |
The relationship between Goldmann Applanation Tonometry and the central corneal thickness was investigated in several studies in the past and they have proved that the central corneal thickness affected the accuracy of the applanation tonometry [8]. Different formulas have been developed since then, to correct the IOP for the CCT. Ehlers and Hansen [1] calculated the error which was evoked by a thinner or a thicker cornea to be 0.7mmHg per 10μ deviation from the normal value of 520μ. Doughty's and Zaman's meta analysis study showed that a 10% difference in the CCT would result in a 3.4 +/- 0.9 mm Hg difference in the IOP (p<= 0.001, r = 0.419) [9]. Shih CY and Graff Zivin JS et al., in their study, used a linear correction formula which was based on an extensive literature review and 2.5 mmHg was added or subtracted for every 50 μ deviation in the CCT from the reference value. A correction factor (CF) of 2.5 mmHg was used. In our study, the same linear regression formula was used, where 2.5mmHg was added or subtracted for every 50μ deviation from the reference value of 527.6mmHg. The corrected IOP values for all the subjects were calculated and the measurement outcomes and the outcome significant changes were reported. [Table/Fig-4] shows the measurement significant change (>=1.5) after correcting the IOP for the CCT. It was observed that 32.258% of the total glaucoma patients had measurement significant changes. 27.3 % patients (6 out of 22) in the NTG group, 66.7 % patients ( 8 out of 12) in the OHT group and 21.4 % patients (6 out of 28) in the POAG group had measurement significant changes. The difference which was observed was statistically significant (p<0.05). The maximum change was observed in the OHT group.
Measurement significant changes(>=1.5) after correcting IOP for CCT among the study population in glaucoma patients
| Study groups | Measurement Significant Change(>=1.5) | Total |
|---|
| No | Yes |
|---|
| NTG | 16 | 6 | 22 |
| 72.3 | 27.7 | |
| POAG | 22 | 6 | 28 |
| 78.57 | 21.43 | |
| OHT | 4 | 8 | 12 |
| 33.33 | 66.67 | |
| Total | 42 | 20 | 62 |
| 67.74 | 32.26 | |
[Table/Fig-5] reveals the outcomes significant change (>=3.0), after correcting the IOP for the CCT. 6.45% of the total glaucoma patients had outcomes significant changes. It was observed that none of the patients with NTG showed outcomes significant changes, but that 3.57% patients (1 out of 28) in the POAG group and 25% patients ( 3 out of 12) in the OHT group showed changes. The difference which was observed was statistically significant (p<0.05). The maximum change was observed in the OHT group. The results which were observed were comparable with those of Ventura AC et al., [10].
Outcome significant changes (>=3.0) after correcting IOP for CCT in glaucoma patients
| Statistic | DF | Value | Prob |
|---|
| Chi-Square | 3 | 9.4131 | 0.0243 |
| Outcome Significant Change(>=3.0) | Total |
|---|
| No | Yes |
|---|
| NTG | 22 | 0 | 22 |
| 100 | 0.00 | |
| POAG | 27 | 1 | 28 |
| 96.43 | 3.57 | |
| OHT | 9 | 3 | 12 |
| 75.00 | 25.00 | |
| Total | 58 | 4 | 62 |
| 93.54 | 6.46 | |
Reclassification of study groups after correcting IOP for CCT
| Statistic | DF | Value | Prob |
|---|
| Chi-Square | 3 | 16.0968 | 0.0011 |
| Reclassification | Total |
|---|
| Normal | NTG | OTH | POAG |
|---|
| Normal | 37 | 0 | 0 | 0 | 37 |
| 100 | 0.00 | 0.00 | 0.00 | |
| NTG | 0 | 17 | 0 | 5 | 22 |
| 0.00 | 77.27 | 0.00 | 22.73 | |
| OHT | 3 | 0 | 9 | 0 | 12 |
| 25.0 | 0.00 | 75.00 | 0.00 | |
| POAG | 0 | 0 | 0 | 28 | 28 |
| 0.00 | 0.00 | 0.00 | 100.0 | |
| Total | 40 | 17 | 9 | 33 | 99 |
Reclassification of the groups was done after the correction of the IOP, based on the CCT. [Table/Fig-6] depicts that 22.73% (5 out of 22) of the NTG patients were reclassified as POAG patients after the correction of the IOP, based on the CCT, whereas 25% (3 out of 12) OHT patients were reclassified as normal after the correction of the IOP.
The Early Manifest Glaucoma Trial has concluded that each higher (lower) mmHg of IOP on follow up was associated with approximately about a 10% increased (or decreased) risk of progression. In our study, 8.06% of the glaucoma patients were recommended changes in the medical therapy, 3.22% were asked to discontinue their medications and 1.61% were advised surgery. The Early Manifest Glaucoma Trial treatment reduced the progression risk in half of the patients, thus demonstrating the value of the IOP lowering in early glaucoma. The limitation of this study is that no long term follow up was done to support the clinical implications of these changes which were made in their management, based on the CCT corrected IOP. Reclassification of the glaucoma patients was done after the correction of the IOP which was measured for the CCT. 5 (22.7%) NTG patients were reclassified as POAG patients and 3(25%) OHT patients were reclassified as normal individuals.
CONCLUSIONS
This study confirmed that the central corneal thickness was significantly lower in the normal tension glaucoma patients as compared to that in the controls and in the primary open angle glaucoma patients, while the ocular hypertension patients had significantly higher central corneal thicknesses than the controls and the primary open angle glaucoma patients. No significant difference was found between the primary open angle patients and the controls.
Due to the effect of the CCT on the measurement of the IOP with the use of an applanation tonometer, which is the main parameter in the diagnosis and the follow up of glaucoma patients, many POAG patients are misdiagnosed as NTG patients and the normals are misdiagnosed as OHT patients and they are then improperly managed. The inclusion of a CCT adjusted IOP during the management of glaucoma patients, will prevent the over or under treatment of the patients and the deferment of incisional surgeries in the patients. Measurement of the central corneal thickness aids the ophthalmologist in making a correct diagnosis and in a better management of glaucoma and the glaucoma suspects, especially when their corneal thicknesses differ markedly from the normal thickness.