The International Diabetes Federation (IDF) has estimated that currently, there are 150 million people with Diabetes Mellitus (DM) worldwide, which represents about 6% of the adult population. This is expected to reach 300 million by 2025. The glycated haemoglobin (HbA1c) most accurately reflects the glycaemic control, based on the preceding two to three months and it has been shown to predict the risk for the development of several chronic complications, as was observed in diabetes patients [1]. As per a recent report, about 97,752 diabetic patients live in the union territory of Puducherry, south India [2].
It was observed in a recent pathophysiological model, that during the periods when the lipid availability far exceeds the storage capacity, the adipocytes would expand. In parallel, the blood concentrations of certain lipids would also become chronically elevated, which would lead to an ectopic deposition of lipids in the non adipose tissues, where insulin resistance and other metabolic dysfunctions would arise [3, 4].
Although it has been recognized that insulin resistance is an important component of the metabolic syndrome [5], its measurement is not economically feasible in the clinical practice, whilst the central (abdominal) obesity is much easier to measure. The Waist Circumference (WC) provides an effective measure of the central obesity. Moreover, in the presence of an increased waist circumference, fasting hypertriacylglycerolemia may represent an early and sensitive marker, with the possibility that the increased girth is attributed to the visceral fat accumulation [6].
Several facts such as a gain in body weight, excess adipose Raghavandeposits, and intra-abdominal fat (visceral fat), have been linked to the risk for type 2 Diabetes mellitus, thus forming the basis of preventive medicine guidelines [7]. Recent reports have suggested that the waist circumference could prove to be a better indicator in comparison to the conventional waist-hip ratio, as the latter could give false negative results for centrally obese patients [6,8]. Most of the studies which have been done in the Indian subcontinent have been performed on type 2 diabetes patients. An association of Diabetes mellitus with the anthropometric measurements and dyslipedaemia was made, based on studies which were done on the urban population of south India and hence there is the need of a study to find the above said association in the rural population.
METHODS
Study Design: Cross sectional (observational) study.
Place and Duration: This study was carried out in the Outpatient Clinic (OPD) of the Department of Medicine, at our hospital, which is a tertiary health care unit. The period of the study was two months, i.e. between July 2011 and August 2011.
Study participants: All the patients who were >18 years of age, with a history of T2DM and who had attended the outpatient clinic, were included. This study comprised of 100 subjects. Informed and written consents ( in vernacular languages ) were obtained from all the participants, following an explanation of the procedure. The initial evaluation included a detailed history which was obtained orally, followed by a clinical examination, to exclude any systemic disease. The study protocol was approved by the institutional ethical committee.
Anthropometry
Waist circumference: The WC was measured in a horizontal plane, midway between the inferior margin of the rib and the superior border of the iliac crest [9].
Hip circumference: The Hip Circumference (HC) was measured at the level of the greater trochanters, with the legs being held close together.
Waist-hip ratio: It is calculated by dividing the waist circumference and the hip circumference.

These are measured by using an inelastic measuring tape which was graduated in centimetres.
Blood Investigations
Fasting Blood Sugar (FBS): The FBS levels were measured by the glucose oxidase-peroxidase method.
Glycated haemoglobin (HbA1c): The levels of HbA1c were quantified by doing an turbidimetric inhibition immunoassay.
Triacylglycerol (TAG): The TAG level in serum was estimated by using an enzymatic photometric method that included glycerol kinase.
All of the above procedures complied with the methods which were approved by the International Federation of Clinical Chemistry and Laboratory Medicine (IFCC).These clinical chemistry parameters were subjected to a strict quality control. The internal quality control was assessed by using the samples which were provided through M/s Biorad, USA and the external quality assessment was assessed by the Clinical Biochemistry laboratory, CMC, Vellore.
Type 2 diabetes mellitus is diagnosed on the basis of the FBS levels (>126mg/dl). From the diagnosed diabetic patients, the WC, HC, WHR, TAG and the HbA1c levels were computed, as have been shown above.
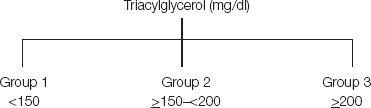
We divided the patients into three groups, based on their TAG levels, as is shown below:
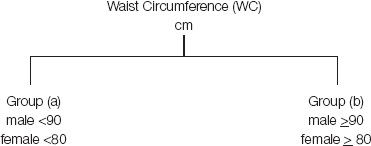
The patients were categorized into the non obese group (a) and the obese group (b), based on their WC and the criteria which were laid down by IDF:
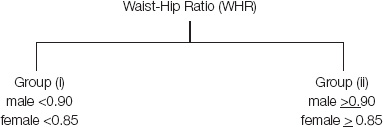
Based on their WHRs, the subjects were grouped into the non obese group (i) and the obese group (ii), according to the WHO guidelines for obesity and as follows:
The waist circumference and the waist-hip ratio were correlated individually against triacylglycerol and the better of the two indicators was identified.
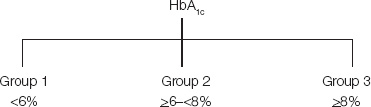
Based on the HbA1c values, the following classification was performed.
The association between HbA1c and the anthropometric measurements (WC, WHR), as well as the TAG levels, were studied.
The above mentioned procedures were performed on males and females separately, in order to determine any probable association with the gender, as regards the WC and the TAG levels.
Statistical Analysis
The Chi-Square test was used for evaluating the associations. A p-value of ≤ 0.05 was considered as significant. The statistical procedures in this study were performed by using the Statistical Package for the Social Sciences (SPSS), version 16.
RESULTS
A total of 100 patients with Type 2 Diabetes mellitus were studied. Of these 100 patients, 52 were men and 48 were women. The results were analyzed by using the Pearson’s Chi square test among the study group and the SPSS software package, version 16. All the values were expressed as mean ± SD. A p-value of = 0.05 was considered as significant.
The values of the anthropometric measures and the biochemical parameters (expressed as mean ± SD) have been depicted in [Table/Fig-1].
Mean Levels of Tag, HbA1c and Anthropometric Measures WC-waist circumference; WHR-waist hip ratio; TAG-triacylglycerol; HbA1c-glycated hemoglobin
| Variables | Mean ± SD |
|---|
| Age | 56.36 ± 11.461 |
| WC | 96.093 ± 10.780 |
| WHR | 0.948 ± 0.055 |
| TAG | 175.55 ± 57.219 |
| HbA1c | 9.95 ± 2.47 |
The results indicated that the mean age of the patients was above 56 years and that a majority of the patients who were involved in this study were adults who were obese. A proportionate increase in the WHR was observed in association with the elevated TAG levels. The Diabetes mellitus was poorly controlled, overall.
An analysis on the associations between the anthropometric variables with respect to the body obesity and the biochemical investigations was undertaken. The results have been presented in [Table/Fig-2].
Association between Anthropometric Measures and Biochemical Parameters
| Parameter | p-Value |
|---|
| WC vs TAG | 0.030* |
| WHR vs TAG | 0.573 |
| WC vs HbA1c | 0.299 |
| WHR vs HbA1c | 0.165 |
| TAG vs HbA1c | 0.038* |
*(Association is significant)
From the Pearson’s Chi-square table, we observed that there was a significant association between the WC and the TAG levels (p-value = 0.030) and between the TAG and the high HbA1c levels (p-value = 0.038)
We found that there was no gender based association between the WC and the TAG levels, with respect to our study population, as has been shown in [Table/Fig-3].
| Gender | Parameter | p-Value |
|---|
| Male | WC vs TAG | 0.179 |
| Female | WC v TAG | 0.196 |
DISCUSSION
The rationale behind choosing the WC as an anthropometric measure in our study was that it sustains a better correlation with dyslipidaemia [9]. Our findings showed that the abdominal adiposity, as was measured by the WC, was strongly associated with the serum TAG levels, thereby depicting a greater risk for developing metabolic complications [7]. To add up, the WHR had no significant association with the TAG levels, thus proving that the WC was a better anthropometric measure which had an association with dyslipidaemia than with the WHR. By using MRI, Ross et al., [10] found a strong association of the WC with the total subcutaneous adipose tissue. Several studies have demonstrated the independent contributions of the regional adiposity to the metabolic abnormalities of obesity. The accumulation of fat in the intraperitoneal or the subcutaneous abdominal regions has been implicated in insulin resistance and dyslipidaemia. In a French study which involved men and women who were aged 40-64 years, it was seen that no difference existed among the BMI, the WC and the WHR, in screening for Diabetes mellitus and obesity as measures of dyslipidaemia [11]. According to Ross et al., the measurement of the WC could be used as a simple and better index for measuring the central obesity [12].
To the best of our knowledge and belief, there are only few reports from the south Indian population that have cited the association between the WC and the TAG among the type2 DM patients in the rural population. Obesity is not common in Indian diabetics. A cross sectional study revealed that only a quarter of the population was obese. Yet, the proportion was large in females [13]. The results of the study which was done by Susan Sam et al., [9] confirmed that the simultaneous measurement of fasting TAG and the WC could be a useful approach for identifying the subjects with the greatest amount of visceral fat, even among obese patients. In the present study group, we had the maximum number of patients falling in the obese category i.e. with a high WC. But the WC is not the only predictive indicator for Diabetes mellitus; rather, it is just a warning sign.
Different modalities have been used to characterize the relationship between the visceral fat and diabetes. Imaging techniques like CT scan and MRI, that directly quantify the visceral adipose tissue and the subcutaneous adipose tissue, are costly, laborious and invasive. Therefore, the anthropometric measurements are more commonly utilized. In one study which was done by Susan Sam et al., [9] they found that high TAG and high WC values were associated with the greatest HbA1c levels. Our study was in accordance with their findings, which showed that the WC had an association with the TAG levels and that the high TAG levels in turn, were associated with high HbA1c levels. The association of the patients with the high TAG levels and the poorly controlled DM, as was denoted by the high HbA1c levels, was related to the decrease in the activities of the adipose tissue and the muscle lipoprotein lipase. This can be explained by the fact that Lipoprotein Lipase (LPL) is an enzyme which is responsible for the conversion of TAG to energy and free Fatty Acids (FFA). LPL is regulated by insulin and LPL will become less effective in the insulin resistant cases which are seen among patients with the uncontrolled type 2 DM.
LIMITATIONS OF THE STUDY
An age based subgroup analysis would have helped in estimating the association of anthropometry with dyslipidaemia and the glucose control in diabetics. Due to the unestablished cut off according to age which was considered in our study, we chose gender adjusted cut offs for the anthropometric measurements.
*(Association is significant)