The patients with Diabetes mellitus are at a high risk of suffering from renal damage. Persistent proteinuria is the hallmark of diabetic nephropathy [1]. In Diabetes mellitus, the vascular permeability increases and albuminuria appears when the metabolic regulation is poor, because of glycosylation and a loss of negative charges on the glomerular membrane. Diabetic nephropathy and deterioration of the renal function in Diabetes mellitus are preventable by the diagnosis of proteinuria at an early stage.
Proteinuria is conventionally detected by qualitative tests, e.g. the sulfosalicylic acid test, Heller’s nitric acid test and the heat coagulation test. But, these tests are not sensitive enough to detect the microproteinuria which is seen during the initial stages of diabetic nephropathy [2]. In recent years, dipsticks have been developed for the detection of proteinuria, which are claimed to be more convenient and sensitive as compared to the qualitative tests. It has been found by many researchers that dipstick tests are too insensitive to evaluate the diabetic patients for microproteinuria. In these situations, the quantitative assessment of the urine protein is necessary [3].
The most accurate method for the detection of microproteinuria is the measurement of the protein content in 24 hours urine samples, Biochemistry Section Anoop Kumar, Sangeeta Kapoor, R.C. Guptabecause the random urine samples vary considerably in their protein concentrations. The excretion of more than 150 mg/24 hour of protein in urine is considered as abnormal [4]. However, the collection of 24 hours urine samples is inconvenient and it is subject to errors if the patient compliance is poor. Studies have shown that more than 25% of the samples have to be discarded because an incomplete collection is suspected. In practice, the spot urine protein/creatinine ratios are currently being used, to rule out the necessity for 24 hours collections.
The urine Protein Creatinine Index (PCI) has been devised as a simple alternative method in which the creatinine excretion is fairly constant in any one subject over a 24 hour period and it correlates well with the 24 hour total excretion of the protein.
In this study, an attempt has also been made to establish the PCI in random urine samples, as a convenient, quick and reliable method for the estimation of proteinuria in diagnosing and monitoring diabetic nephropathy. An attempt has also been made to determine the optimal cutoff value of PCI for the prediction of significant proteinuria. This study signifies the role of urinary PCI in detecting even a minor increase in the protein excretion in a random urine specimen.
MATATERIAL AND METHODS
In the present study, 28 patients aged 25 to 53 years, who were diagnosed as diabetics and were confirmed by the estimation of fasting serum glucose (> 126 mg/dl) on two occasions, were recruited from the Medicine OPD and the IPD of Teerthanker Mahaveer Medical College and Research Centre, Moradabad, UP, India, over a period of one year (from February 2011 to February 2012). 40 normal healthy subjects who were age and sex matched with the diabetic patients, were selected as the controls.
The exclusion criteria which were considered for the selection of the diabetic patients were hypertension, pregnancy, emotional or physical stress, smoking, exposure to extremes of climate, urinary tract infections, any intercurrent illness, strenuous exercise and menstruation, to rule out any proteinuria which had occurred from other causes.
The patients and the controls were instructed to collect untimed spot urine samples. The urine samples were collected at room temperature, without adding any preservatives. Immediately after their collection, the urine samples were analyzed for protein and creatinine. Venous blood was collected from the subjects by venipuncture of the antecubital vein in a fluoride bulb. The serum was then separated by centrifugation at 3000 rounds per minute, for 15 minutes, for the estimation of the fasting serum glucose concentrations.
Heller’s nitric acid test, the heat coagulation test and the sulfosalicylic acid test were used qualitatively for the detection of the urinary protein [5]. A semiquantitative estimation of the urinary protein was done by the urinary dipstick method. The quantitative estimation of the urinary protein was performed by the colourimetric sulfosalicylic acid method [6]. The colourimetric estimation of urinary creatinine was done by the modified Jaffe’s method [6]. The estimation of fasting serum glucose was done by the GOD – POD (Glucose oxidase – Peroxidase) method [7].
Calculation of the Protein Creatinine Index (PCI) [
6]
The urinary PCI was calculated by the following equation :
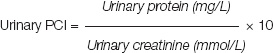
The PCI was estimated by multiplying the protein creatinine ratio (which was measured in mg/mmol) by a factor of 10, since, although the daily excretion of creatinine depends on the muscle mass, an average figure of 10 mmol creatinine per day, can be assumed.
Statistical Analysis
The normal range of the urinary PCI was calculated from the data which was obtained from the urine samples from normal healthy subjects. Since the distribution was non-Gaussian, a non – parametric method was used to determine the normal range. The 95% range (2.5th to 97.5th percentile) was taken as the reference range. The Student’s ‘t’ test was used to compare the PCIs of the normal healthy controls and the diabetic patients.
RESULTS
The mean fasting serum glucose was 181.92 mg/dl for the diabetic group. The patient and control groups were tested qualitatively and quantitatively for the presence of protein in their urine samples. Among the qualitative tests, the heat coagulation test was found to be most sensitive one for the detection of the protein in urine. The findings of the dipstick tests matched with those of the quantitative analysis results in most of the cases. In few cases, the dipstick analysis showed false negative results when they were compared with the results of the quantitative analysis which was done by the sulphosalicylic acid colorimetric method.
Comparable values of urinary creatinine were obtained for the control and the diabetic groups. (p = 0.02)
It was found that higher amounts of protein were excreted in the urine of diabetic patients, which was found to be statistically highly significant (p< 0.001).
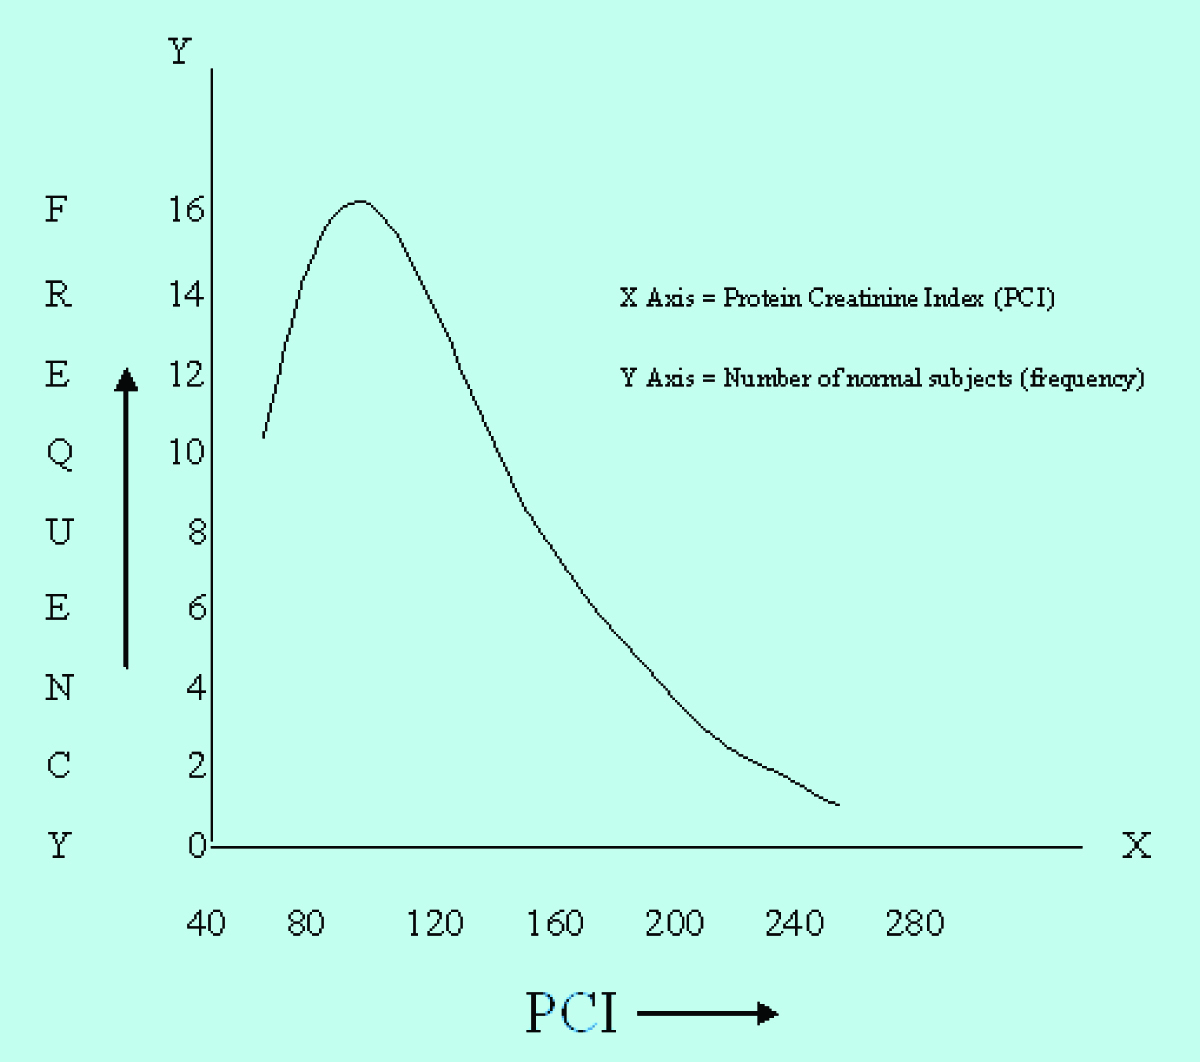
Frequency distribution curve for PCI of normal individuals showed a non-Gaussian distribution of observations.
Higher values of PCI were recorded for the diabetic patients as compared to the controls. These elevated values of PCI in diabetic patients were found to be statistically highly significant (p< 0.001).
Twenty six patients out of 28 diabetic patients were found to have PCI values which were greater than the established normal range in this group of patients.
Although the samples were found to show elevated levels of urinary protein concentration on quantitative estimation by the sulphosalicylic acid test, 5 out of 28 (17.86%) diabetic patients showed a negative dipstick test for the urinary protein estimation.
DISCUSSION
Diabetic nephropathy occurs in one third of the patients who suffer from Diabetes mellitus. Proteinuria is considered to be the hallmark of the incipient nephropathy in these patients [8]. So, quantifying the urine protein accurately and precisely is vital for monitoring the disease progression in patients who suffer from Diabetes mellitus. An early detection of proteinuria in diabetic patients may help in preventing the irreversible renal damage in these patients [9].
A well documented test for the diagnosis of proteinuria has been the timed collection of urine over 24 hours [10]. The use of the 24-hours urine collection is necessitated due to variations in the protein excretion throughout the day, since the urinary protein excretion follows a circadian rhythm. However, the 24-hours urine collection is cumbersome, inconvenient and often incomplete in outpatients [11]. In an attempt to fulfill the need for a reliable and quick measurement of the urinary protein, various researchers have proposed the calculation of ratios such as the Urinary Protein/Urinary Creatinine (UP/UC), the Urinary Albumin/Urinary Creatinine (UA/UC) and the PCI on spot urine samples [12]. These parameters take into account the fact that the creatinine excretion remains fairly constant in the presence of a stable Glomerular Filteration Rate (GFR), thus, eliminating the variations in the urinary protein concentration during the day. Good correlation has been found between the results of proteinuria which were obtained from these parameters and those which are calculated from the 24-hour urine samples. But, no consensus for a specific PCI cut-off value was obtained [13].
In this study, an attempt was made to validate the PCI of a random urine sample as a reliable and a convenient test to replace the 24-hour urine protein estimation, in order to overcome the pitfalls which are associated with the 24-hour urine collections. The normal range of PCI in this region has also been established [Table/Fig-1].
Comparison of urinary creatinine between control and diabetic group by Student’s t-test
| Parameter | Control group (n = 40) | Diabetic Group (n = 28) | p-value |
|---|
| Urinary creatinine (mmol/dl) | 0.88 ± 0.42 | 0.70 ± 0.34 | 0.02 |
The outcomes of this study are as follows:
Urinary Creatinine Excretion
It was found that the amount of creatinine which was excreted in urine in diabetes mellitus patients (0.70 ± 0.34 mmol/dl) was comparable to that in the control subjects (0.88 ± 0.42 mmol/dl). The lower value of urinary creatinine which was obtained in this study group as compared to those of other contemporary studies, may be partly responsible for the higher normal range (60–220) for the PCI which has been established in this study.
Urinary Protein Excretion
The mean urinary protein concentration which was found in the diabetic group was 25.37 ± 12.5 mg/dl, and in the control group, it was 8.93 ± 3.54 mg/dl. The protein excretion in the spot urine samples in the diabetic group was found to be significantly higher in comparison to that in the control group, with a p value of < 0.001. These findings were concurrent with the results of the studies which were previously done by various researchers [Table/Fig-2].
Comparison of urinary protein between control and diabetic group by Student’s t-test
| Parameter | Control group (n = 40) | Diabetic Group (n = 28) | p-value |
|---|
| Urinary protein (mg/dl) | 8.93 ± 3.54 | 25.37 ± 12.51 | < 0.001 |
In a recent study which was done by Biradar et al, it was indicated that the urinary protein excretion was significantly elevated in type 1 and type 2 diabetes mellitus patients. The mean values of the 24-hour urinary protein which were obtained in their study was 1.6 ± 1.7 gm/day, which correlated well with the P:C ratio of 1.27 ± 1.55 [14].
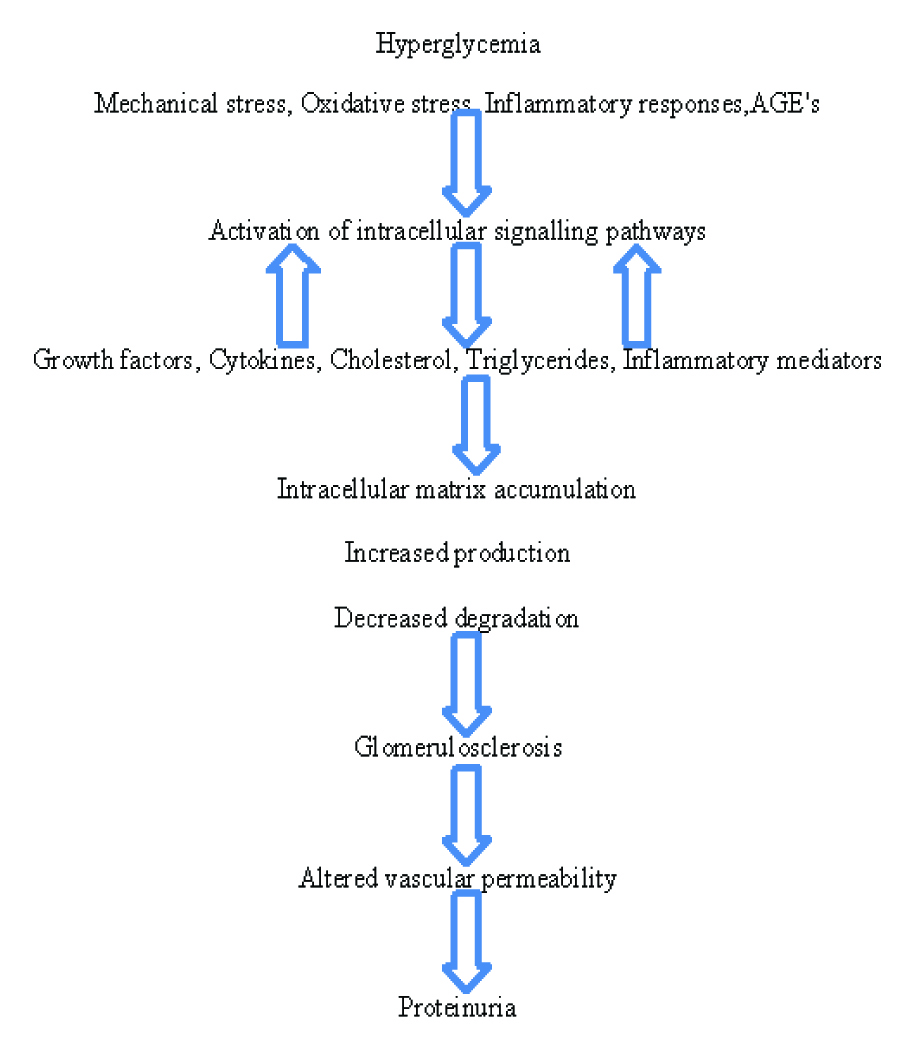
In the initial stage of diabetic nephropathy, due to a defect in the auto-regulation of the renal perfusion, thermodynamic changes occur, resulting in leakage of albumin from the capillaries of the renal glomeruli. Albumin activates various inflammatory responses. In addition, the mechanical and the oxidative stress which result from the renal hyper perfusion, induces the release of cytokines, growth factors, cholesterol and triglycerides, that induce the accumulation of proteins from the extracellular matrix, leading to glomerulosclerosis. The increased expression of vascular endothelial growth factors due to hyperglycaemia in the podocytes, causes an increased vascular permeability. Moreover, there is a non-enzymatic glycation of proteins which results in the formation of AGEs due to the hyperglycaemia. These bind to collagen and other proteins that constitute the glomerular basement membrane, thus, making the glomerular barrier more permeable to proteins [15].
The Reference Range for PCI
The data which was obtained for the PCI from the normal healthy controls ( n = 40 ) who were recruited in this study was found to have a non-Gaussian distribution. Hence, a non-parametric method was used to determine the reference range. The 95% range (2.5th to 97.5th percentile) of PCI was found to be 60-220 [Table/Fig-3]. The upper limit of the normal was found to be higher than that which was reported by Shaw et al., who reported that a PCI of below 125 in a random urine sample, excluded an abnormal proteinuria [16].Gupta and Gupta reported the PCI range to be 37-247 in Indian subjects, which was comparable to the normal range which was obtained in this study [17]. The higher values which were obtained for PCI in this study as compared to those of western studies, may be due to the comparatively lower values of urinary creatinine whch were obtained. This leads to an important observation that the PCI is likely to be different in different ethnic/racial populations. Hence, it is important to determine the normal range of the PCI in different groups in a population. The normal reference range for the PCI, which was obtained in this study, was further used to predict the significant proteinuria in diabetic subjects.
Frequency distribution curve for urinary protein – creatinine index in normal subjects
Urinary PCI
A significantly higher value of the PCI was observed in diabetic patients (373.04 ± 98.53 ) as compared to that in the control group, where the PCI was 114.65 ± 47.97 (p<0.001) [Table/Fig-4]. This indicated that the spot urine protein: creatinine index can serve as a baseline predictor of the progression of renal diseases which are secondary to the hyperglycaemia of Diabetes mellitus. Protein and creatinine are soluble in water and so, they will undergo similar changes during the dilution or concentration of urine, according to the hydration status of the body. Probably, this could be the reason that the index is independent of errors in the urine collection [18]. The advantages of calculating the PCI are that the errors which occur due to an improper collection of the urine samples or due to an inaccuracy in the timing of the collection period, do not affect the index.
Comparison of urinary PCI between control and diabetic group by student’s t-test
| Parameter | Control group (n = 40) | Diabetic Group (n = 28) | p-value |
|---|
| PCI | 114.65 ± 47.97 | 373.04 ± 98.53 | < 0.001 |
In a similar type of study, Birader et al., suggested that a random urine P:C ratio predicts the amount of the 24-hours urine protein excretion with high accuracy [14]. Price et al., reviewed a number of studies and suggested that the P:C ratio can predict the amount of protein which is excreted in urine [10]. Khan et al., suggested in their study, that a PCI of greater than 140 in a random urine sample was indicative of pathological proteinuria [19]. Shaw et al., proposed that the protein creatinine index in random urine samples should be used to supplement the dipsticks in screening for proteinuria. They concluded that an index of more than 136 (in British subjects) indicated the presence of pathological proteinuria [16].
Moreover, in the present study, it was seen than 26 out of the 28 diabetic patients had a PCI of > 220, thus indicating significant proteinuria in a majority of the diabetic patients.
Comparison of the Dipstick Results with the PCI
The assessment of proteinuria by dipsticks showed a moderate correlation with the calculated PCI. The dipstick analysis for the urinary protein showed errors in the interpretation of proteinuria in a few cases. So, it was suggested that the dipstick tests be used only for screening purposes and not for the assessment of the severity of the proteinuria [Table/Fig-5].
Comparison of dipsticks and sulphosalicylic acid test for urinary protein estimation
| No. of samples positive for sulphosalicylic acid test | No. of samples positive for dipstick | False negative dipstick tests |
|---|
| 28 (100%) | 23 (82.14%) | 5 (17.86%) |
CONCLUSION
The present study suggests that a random urine PCI can be a good predictor of significant proteinuria in diabetic nephropathy. This test could be a reasonable alternative to the 24-hour urine sample collection for the detection of significant proteinuria in diabetes mellitus patients. It is recommended that the PCI should be specially employed for the assessment for microproteinuria in diabetic patients, when in a few instances a negative result may be obtained by the semi-quantitative dipstick test. The simplicity, accuracy and the lower cost of the PCI justifies its preferential diagnostic use. But, since the creatinine excretion is different in different populations, it becomes imperative to establish a normal reference range in the local population, to predict the level of significant proteinuria.