MATERIAL AND METHODS
This questionnaire based, cross sectional study was conducted on 109 clients of the FSWs during the time period from 1st January 2010 to 31st July 2010 in the Pokhara region (sub-metropolitan city of the Kaski district) of Nepal.
Research Design
This research study was attempted to follow a quantitative and a descriptive research design. It intended to analyze the relationship between the behaviours, knowledge, attitude and the practices of STI, HIV and AIDS (dependent variables) and the socio- demographic background characteristics (age, caste, ethnicity, occupation, education and social status etc. (independent variables) of the clients of FSWs.
The Study Site description and the Rationale for the Selection of the Study Site
The entire study was conducted in the Kaski district and it was specially focused on Pokhara, a sub-metropolitan city. The locations like the Baglung Bus Park, Lakeside and Mahendrapool are the most concentrated zones of the FSWs. These areas have cabin restaurants and dance bars which are frequently visited by the clients. Similarly, the rationale for the selection of the study sites in these locations was the higher mobility of the clients of FSWs like transport workers, construction labourers, small businessmen, college students, etc. On the other hand, the snowball sampling was adopted for the study and the channeled network of the clients was possible on these sites.
The nature and the Sources of the data
The data which was required for the study was primary in sources and it was both quantitative as well as qualitative in nature. The methods of the data collection included personal direct interviews, questionnaire surveys, FGDs and planned group discussions which were conducted to gather information, which was the primary source of the data.
The Sampling Procedure
According to the sources of the data which were estimated in Nepal, the male clients of the FSWs ranged between 564,000 -754,000. (NCASC/ 2006, STI National Programme Review, Nepal).
In Pokhara, according to the Child and Women Empowerment Society [CWES] which is working in the field of HIV and AIDS Prevention in the Kaski district which includes the Pokhara valley, nearly 2500 persons regularly visit the FSWs as their clients in Pokhara at present. This study considered the population (N) of the clients of the FSWs as 2500 in Pokhara, Kaski.
Determination of the Sample Size
By using the method of sample size determination, the sample size was determined as, n= 109 with a 0.04 degree of error [6]. The calculation of the sample size was done as follows: where, t= Abscissa of the normal curve (1.96), p = proportion of the sample on the population estimate, q=1-p, d = margin of error (degree of error) and where, n=sample size and N = population size.
This study followed the snowball sampling method to reach the respondents for surveys. Because of the lesser possibility of directly identifying the respondents as the clients of the FSWs , the snowball sampling method was selected for the study.
The data Collection Techniques/Instruments
For the study, the following methods and techniques of data collection were adopted.
The Observation Method
To gather the appropriate information for the research, the uncontrolled method of observation was adopted. The participant observation was entertained for gathering the data.
The Survey Method
A set of questionnaires was developed to gather quantitative and qualitative information from the respondents by adopting a one to one interview method. The survey was conducted to collect information on the relationship between the behaviour, knowledge, attitude and practices towards STI, HIV and AIDS as the dependent variables and the socio-demographic background (age, caste/ethnicity, occupation, education, social status, etc,) as the independent variable of the clients of the FSWs. To ensure the quality and the reliability of the gathered information, the questionnaires were pretested with 15 respondents, to check whether the questionnaire sets were applicable in accordance with the field environment or not, to gather the appropriate information.
Focus Group Discussions
To collect the qualitative information, at least 3 focus group discussions were organized among the respondent clients of the FSWs.
Methods of the Data Analysis
The collected data were processed after editing and coding with the help of the SPSS for Windows computer software for analysis. The relationship between the dependent variables (behaviours, knowledge, attitude and practices) and the independent variables (socio-demographic characteristics like age, caste-ethnicity, occupation, education and social status) was the input for the data analysis. Likewise, the consistency of the condom use, the practice and behaviour of/towards sex, the knowledge on the behaviour change and the impact on the social economic affairs of the CFSWs were analyzed to answer and fulfill the research questions and the objectives of this study.
Editing
The information which was collected from the questionnaire survey was edited to ensure its consistency, accuracy and completeness in a systematic way.
Coding
To ease the transfer of the data from the data collection instrument into a computer readable form, the gathered data in the field were pre-coded.
Data Processing
A specific computer software application was applied for the data processing purpose after the data collection.
Classification and Tabulation of the Data
The gathered data in the structured form were classified into group categories and classes to ease their meaningful presentation and analysis. The collected data were arranged in tabular forms (which helps to that will be systematic examined). To run the analytical calculations more quickly and accurately, a computer software was used for the data tabulation and for their further processing.
Statistical Analysis
The descriptive analysis was adopted to analyze the frequencies, percentages, the measure of the central tendency and the measure of dispersion. The data were analyzed by using Excel 2003, R 2.8.0, the Statistical Package for the Social Sciences (SPSS) for Windows, Version 16.0 (SPSS Inc; Chicago, IL, USA) and the EPI Info 3.5.1 Windows Version [7,8].
RESULT
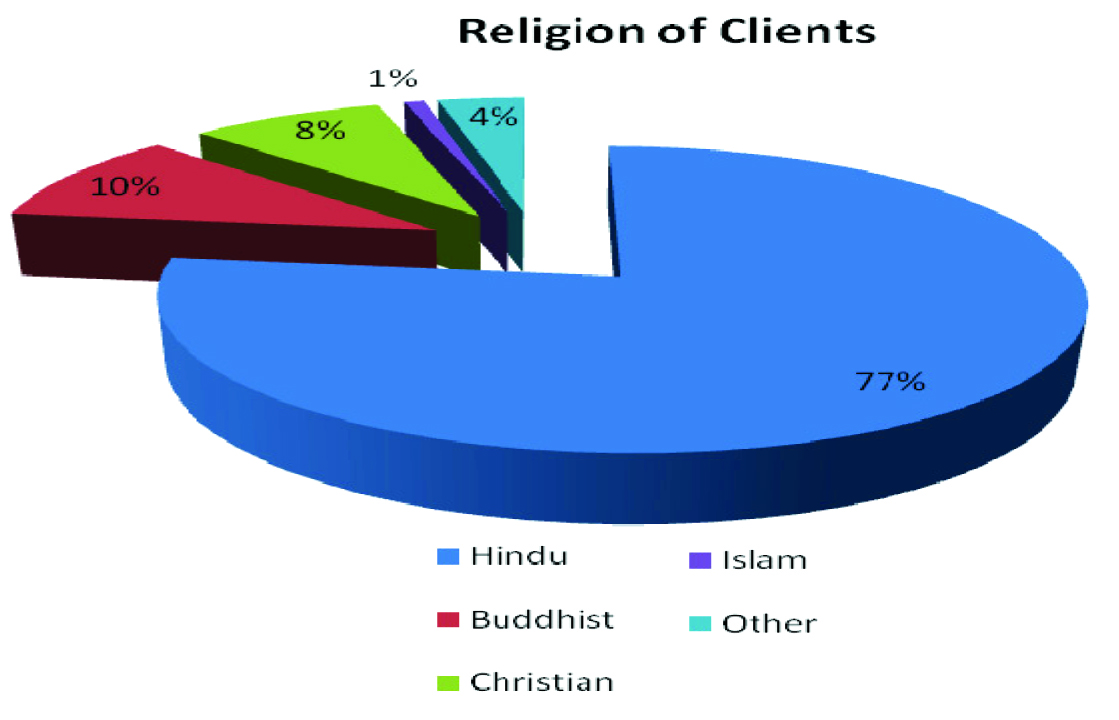
Among the 109 respondents, the mininum and the maximum ages were 18 and 50 years. The mean age was 27. with a standard deviation of 6.949. Under this age group, a majority of the respondents were between 15 to 29 years old, which covered (60.55%) roughly three fifth of the total number of the study subjects. Similarly, 3.67% of the respondents were above 44 years of age. [Table/Fig-1] depicts the religion-wise distribution, where 3 quarters (77.1%) of the respondents were Hindus by religion. Similarly, those from the Islam religion were the least in number (1%). The second highest proportion (10.1%) of the respondents were Buddhists by religion. Christians formed 8.3% of the respondents, whereas 4 (3.7%) respondents were from religions other than those which have been mentioned above. According to the caste-wise analysis, a majority of the respondents were found to be from the Brahmin caste (26.6%), while those from the Chhetri caste formed the second majority. Dalits (including all Dalits) and Gurungs (15.6 %) represented equal numbers (17 persons of each caste) of the respondents. [Table/Fig-2] shows the mean age with the castewise distribution of the respondents; the Brahmins, Chhetris, Dalits, Janajatis and others were of the mean ages of 30.28 , 29.05, 26.82, 26.77 and 24.00 years respectively, whereas the aggregate mean age of all the groups was 27.58 years. Similarly, according to the caste group-wise distribution, a majority of the respondents were from the Janajati group (35.8 %). Roughly one third of the respondents which included the Gurungs, Magars, Rais, Tamangs, Newars, Brahmins (26.6%) and the Chhetris (20.2%) were at the second and third positions respectively. Among the respondents, a majority were from the labourers and transport workers groups. Similarly, students, service holders, businessmen, those who were in the foreign service and those who were unemployed also subsequently formed the major groups of the respondents in the study.
Mean Age of Respondent social Group -wise distribution
| Social Group of Respondent | Number | Mean | Std. Deviation |
| Brahmin | 29 | 30.28 | 7.211 |
| Chhetri | 22 | 29.05 | 6.586 |
| Dalits | 17 | 26.82 | 7.082 |
| Janajati | 39 | 26.77 | 6.800 |
| Other | 2 | 24.00 | 1.414 |
| Total | 109 | 27.58 | 6.949 |
[Table/Fig-3] depicts the educational qualification background of the respondents. Almost all the respondents were literate. A majority of the respondents (39 persons) had achieved a secondary level education, which was roughly one-third (34.9%) of the total figure. Similarly, about one-third (31.2%) of the respondents had a primary level education. Similarly, only 10.1% of the total respondents had a lower secondary educational qualification, whereas 14.7% of the total respondents had a higher secondary level educational qualification. Among the respondents, 9.2% had a graduation level qualification. The mean ages of the respondents according to their educational status were 30.74 years, 26.91 years, 28.84 years, 23.94 years and 24.50 years for those with ‘Primary’, ‘Lower Secondary’, ‘Secondary’, ‘Higher Secondary’ and ‘Graduate’ education respectively. Roughly, half (51.4%) of the respondents were from the Kaski district who were permanent residents there, which included the Pokhara city, whereas the rest of the respondents were from other districts (Syangja, Tanahun, Parbat, Baglung, Dhading, Lamjung, Myagdi and Chitwan).
Education status of respondent
| Education status | Frequency | Percent |
| <Primary | 34 | 31.2 |
| Lower Secondary | 11 | 10.1 |
| Secondary | 38 | 34.9 |
| Higher Secondary | 16 | 14.7 |
| Graduate | 10 | 9.2 |
| Total | 109 | 100.0 |
[Table/Fig-4] reveals that roughly, more than two-third (71.6%) of the respondents had reported that their geographic location or home town was in the Gandaki zone, whereas the Dhaulagiri and the Bagmati zones took the second and the third positions respectively. Similarly, almost 85.3 % of the respondents reported that they had come from the Western Development Region. The second position went to the Central Development Region, followed by the Eastern Development Region and the Far Western Development Region. However, the Mid-Far Western Development Region did not have any respondent who was covered by the study.
| Zones | Frequency | Percent |
| Bagmati | 8 | 7.3 |
| Dhaulagiri | 9 | 8.3 |
| Gandaki | 79 | 72.5 |
| Koshi | 2 | 1.8 |
| Lumbini | 5 | 4.6 |
| Mechi | 2 | 1.8 |
| Narayani | 1 | 0.9 |
| Sagarmatha | 1 | 0.9 |
| Seti | 1 | 0.9 |
| Out country | 1 | 0.9 |
| Total | 109 | 100.0 |
[Table/Fig-5] shows the marital status of the respondents. Nearly two third (63.3%) of the respondents were married, 30.0% were unmarried and 3.7% had been separated from their spouses, whereas 1.8 % had been divorced and 0.9% had been widowed respectively. Among the married respondents, 90.54% of the respondents reported cohabitation with their spouses, whereas only 9.46% reported that they had not been cohabiting with their spouses at the time of the information collection. The mean ages of the respondents according to their marital status were 22.33 years, 30.46 years, 38.50 years, 28.50 years and 35.00 years for the ‘Unmarried’, ‘Married’, ‘Divorced’, ‘Separated’ and ‘Widowed’ respectively. The overall mean age of the respondents was 27.58 years. The respondents who were married were asked as to how long they had been married. Only 64 persons reported that they had been married for 33 years (the maximum duration of the marriage) and the minimum duration of the marriage was 1 year. the mean year of the respondents passed after their marriage was 9.63 years. Only 5 respondents had a polygamous marital status.
| Marital Status | Frequency | Percent |
| Unmarried | 33 | 30.3 |
| Married | 69 | 63.3 |
| Divorced | 2 | 1.8 |
| Separated | 4 | 3.7 |
| Widower | 1 | .9 |
| Total | 109 | 100.0 |
Among the 69 respondents with the ‘married’ marital status, 90.54% respondents reported that they were living with their spouses at the time of the information collection, whereas only 9.46% were not cohabiting with their spouses. As compared to the results of previous studies, two-fifths (40.3%) of the respondents were married in our study. Among the currently married clients, about 82% were living with their wives. The percentage of the currently married clients who always stayed with their wives during an average month was 36%. The scenarios seemed to be similar among the respondents who were currently living with their spouses, which showed that the clients regular visited the FSWs to avail of their sexual services even when they were living with their wives.
[Table/Fig-6] reveals the family type of the respondents, where about two third (63.3%) were from nuclear families, whereas onethird (36.7%) of the respondents were from joint families.
Types of family of respondents
| Family types | Frequency | Percent |
| Nuclear | 69 | 63.3 |
| Joint | 40 | 36.7 |
| Total | 109 | 100.0 |
[Table/Fig-7] depicts that 22.9 % of the respondents were spending too less time with their families. A majority of the respondents spent ‘little’ and ‘normal’ time with their families. Similarly, only few respondents (10 persons) spent enough time with their families. Socially, about 40.4% of the respondents had good relationships with their neighbours and 56.0% of the respondents had normal relationships with their neighbours. 3.7% of the respondents did not have good relationships with their neighbours. With respect to the engagement in the social work which was organized in the neighbourhood and the community, roughly less than one quarter (23.9%) of the respondents answered that they had participated ‘too less’ whereas, 34.9% answered ‘normal’, nearly one third (32.1%) answered ‘little’ and 9.2% answered ‘more’. Among the respondents, 49.5% were affiliated to a social organization in some form or the other. similarly 50.5% of the respondents were not affiliated to any social organizations.
Respondents behavior toward family and neighbors
| Time given to the family by respondent | participation in social conducted in neighbor and community | Relation of respondent with neighbors |
| Frequency | Percent | | Frequency | Percent | | Frequency | Percent |
| Too less | 25 | 22.9 | Too less | 26 | 23.9 | Good | 44 | 40.4 |
| Little | 30 | 27.5 | Little | 35 | 32.1 | Normal | 61 | 56.0 |
| Normal | 44 | 40.4 | Normal | 38 | 34.9 | Not good | 4 | 3.7 |
| More | 10 | 9.2 | More | 10 | 9.2 | Total | 109 | 100.0 |
| Total | 109 | 100.0 | Total | 109 | 100.0 | | | |
[Table/Fig-8] shows that the respondents who were affiliated to social organizations were represented by the types of the organizations that they were affiliated to. Nearly one-third (31.48%) of the respondents were affiliated to some caste based social organizations; similar numbers of respondents were affiliated to community organizations. Sixteen respondents were affiliated to club type organizations and only 4 persons were affiliated to NGOs. The respondents were asked as to what type of responsibilities they had handled. Among the affiliated respondents, exactly one third (33.33%) of the respondents answered ‘Board member’ in their organization. Similarly, more than one-third (43.59%) of the respondents (23 persons) had handled a ‘general member’ responsibility. Small proportions (3.70%) of respondents had been engaged as ‘life time members’ in the social organizations.
Types responsibility handled by respondent affiliated in social organization
| Affiliation as | Frequency | Percent |
| Decision making level | 11 | 20.4 |
| Board member | 18 | 33.3 |
| General member | 23 | 42.6 |
| Life time member | 2 | 3.7 |
| Total | 54 | 100.0 |
[Table/Fig-9] shows that roughly two third (67.9%) of the respondents were tested for HIV at least once, whereas nearly one third (32.1%) of the respondents had never been tested for HIV. Roughly half (50.5%) of the respondents answered that there was a difference between HIV and AIDS, whereas roughly half (49.5%) of the respondents had answered that there was no difference. Among the respondents, 89.9% of the respondents knew how to be safe from STIs and the HIV infection, whereas only 10.1% of the respondents did not know about safety measures. Among the total respondents, 99.1% of the respondents knew about HIV and AIDS, whereas only less than 1% (1 person) of the respondents did not know about HIV and AIDS. The study on the means of information of the respondents showed that, for two third (67.0%) of the respondents, the means of information was ‘friends’. Similarly, for three quarters (78.0%) of the respondents, it was ‘media’, for roughly two third (66.1%) of the respondents, it was ‘organizations’, for roughly one quarter (24.8%) of the respondents, it was ‘health organizations or institutions’ and for only one tenth (11.1%) of the respondents, ‘other than the above’ were the means of information on HIV and AIDS. About 98.2% of the respondents had knowledge on the transmission of HIV, whereas only 1.8% respondents (2 persons) did not have knowledge on the HIV transmission. Among the respondents, 97.2% reported that ‘unsafe sex’ was the main mode of transmission of the STIs and HIV. The other modes of transmission of HIV which were reported by the respondents included common needle sharing (86.2%), mosquito bite transmission (30.3%), infected blood or organs (82.2%), mother to child transmission (50.5%) and other modes of transmission (4.5%). This shows that the level of comprehensive understanding of the mode of transmission was still not satisfactory among the respondents. Nearly one third of the respondents believed that the mode of transmission was mosquito bites, which was a misunderstanding on the mode of transmission of STIs and HIV.
| Variables | Yes | No | Total Frequency | Total Percent |
| Frequency | Percent | Frequency | Percent |
| Knowledge of STI, | 81 | 74.3 | 28 | 25.7 | 109 | 100 |
| Ever Test STI | 51 | 46.8 | 58 | 53.2 | 109 | 100 |
| Known Mode of transmission | 66 | 60.6 | 43 | 39.4 | 109 | 100 |
| Perceived contacted safety | 93 | 85.3 | 16 | 14.7 | 109 | 100 |
| Knowledge of HIV AIDS | 108 | 99.1 | 1 | 0.9 | 109 | 100 |
| Difference between HIV AIDS | 55 | 50.5 | 54 | 49.5 | 109 | 100 |
| Ever STI Test | 51 | 46.8 | 58 | 53.2 | 109 | 100 |
| Ever HIV Test | 74 | 67.9 | 35 | 32.1 | 109 | 100 |
DISCUSSION
The HIV infection often spreads among sex workers before it spreads among the general population. The true extent of the HIV transmission from the sex workers and their clients to other populations remains generally unknown [9]. The epidemic in Nepal is driven by injecting drug use and sexual transmission. Numerous social, economical and cultural factors drive injecting and sexual behaviours among the various most-at-risk groups. Given the nature of Nepal’s concentrated HIV epidemic, the focus of the response has been maintained with prevention programmes which target the key populations which are at a higher risk. The most recent estimates of the people who lived with HIV showed that 42% of all the HIV cases in Nepal were among the seasonal labour migrants, 15% were among the clients of sex workers and 26% were the wives or partners of HIV-positive men. The prevalence of HIV in the adult population in Nepal is 0.49% [10]. The clients of the FSWs are from different socio-demographic backgrounds. Therefore, the real social problem of the clients of the FSWs differs from the research problems among them, according to their background, knowledge, behaviours, practices and attitudes regarding HIV, AIDS and sexually transmitted diseases. The widely persistent social problem among the clients was that a majority of the clients of the FSWs were from the lower socio-economic background, which was the reason for their lack of sensitivity and consciousness towards safer sex and protection from STDs and HIV. Combined qualitative and quantitative research shows that the clients’ knowledge, attitudes and behaviours call for immediate interventions which should probably first target the 5 major client groups: transport workers, service employees, migrant workers, uniform service holders, injecting drug users and businessmen as the most important clients of the FSWs. The policy makers and the implementers of the HIV interventions need to be convinced that these are needed and feasible [11].
In our study, a majority of the clients were of the age group of 15 to 29 years, where the average age was 27.58 years. The standard deviation and variance were 6.949 and 48.291 years respectively. The results of this study were consistent with those of many other studies [12–14]. The findings of this study were also consistent with those from other literatures: that later sexual intercourse has also been associated with an increased use of condoms [15–17]. Generally, the respondents frequently listened name of the sexually transmitted diseases were syphilis (Viringi), Gonorrhea (Dhatu) commonly taken name, some respondents taken ‘venereal watt’ as they listened name. One-quarter of the respondents used condoms during every contact with the female sex workers, whereas about one-fifth of the clients answered that they had never experienced any sexual problems as yet. But 14.7% of the respondents reported that they had had unsafe sex because they had sometimes used condoms and had experienced urinary problems at other times. Only one-fifth had used condoms frequently when they had sex with their wives and the reason behind this was contraception and the new pleasure and taste. The remaining fourth-fifth of the respondents said that they did not use condoms when they had sex with their wives, because they felt that a condom was not necessary for having sex with their wives. They preferred a permanent family planning method and for the proper taste etc. This showed the risky behaviour which was the reason behind the STIs and HIV transmissions to their wives. Many other studies found significant differences in the condom use with respect to the type of relationship that the respondents had with their sex partners, which was defined as casual or fixed/steady [18–20]. Almost all the respondents were aware of HIV and AIDS but the modes of transmission according to them were unsafe sex and infected blood transmission. The clients of the sex workers had faced several problems in their family affairs as well in their social and economic affairs due to their contacts with female sex workers. The main reason for their contacts with the female sex workers was that their services were easily available at low prices.
CONCLUSION
HIV and AIDS is a cross cutting issue in the present situation rather than a health issue. The most at -risk group is the clients of the female sex workers. The sexual behaviour among the clients depends upon the clients’ attitude, knowledge and their perceptions, that also influences several internal and external factors. To some extent, they were made aware of HIV and AIDS by different organizations which were working in the field of HIV and AIDS. But still they intended to practice unsafe with the female sex workers, which was risky. Multi sex partners were common for the clients of the female sex workers. The perception of condom use during sexual intercourse with the FSWs was commonly higher among the clients, but in practice, they did not adopt it. As a result, they had remained at a high risk of transmission of sexual transmitted infections. The clients’ peer circle, attitude and their behaviour also played a role in their engaging in such risky behaviours although they had knowledge on STIs and HIV. The knowledge on HIV and AIDS remains higher because several nongovernmental organizations are working on awareness programs and activities to prevent the spread of HIV and AIDS.