Welding is one of the essential components in the automobile manufacturing units. An increase in the risk of work related COPDs (Chronic Obstructive Pulmonary Diseases) in welders have been observed by many studies [1–4]. Hence, a periodic assessment of the lung function is considered as mandatory under the health surveillance program which has been designed for welders [5]. The red cell distribution width is the co-efficient of the variation of the Mean Corpuscular Volume (MCV). Though it was initially used as an index to classify microcytic anaemias [6], studies have proved its usefulness as a prognostic marker in a few non haematological entities [7–9]. A population based study which was done in the U.S. has observed an inverse relationship between the RDW and the lung function [10]. Therefore, we hypothesized that the RDW could be used as a marker to identify the magnitude of the pulmonary compromise among welders. To test the hypotheses, we analyzed the strength of the relationship between the RDW and the FEV1/FVC ratio% in automobile welders.
Can the RDW (%) be used as a biomarker to identify the compromise in the lung function among the welders in an automobile industry?
MATERIALS AND METHODS
Selection of the study population
The cross sectional study was performed in an automobile industry which was close to Chennai, Tamilnadu India. Seventy eight arc-welders and eighty non-welding production workers who volunteered for the study, were asked to answer a structured self – administered, socio economic and a medical history questionnaire. Based on the inclusion and the exclusion criteria, fifty automobile arc-welders and 50 age matched non-welding office workers were recruited as the cases and the controls respectively. All were males. An informed consent was obtained in the local vernacular language. The study was approved by our institutional research and ethical committee.
Inclusion criteria:
Age : 20-50 years
Gender: Male
A minimum of 2 years of exposure to arc-welding (for the cases)
Exclusion criteria:
A history of
Respiratory diseases since child hood (repeated child hood respiratory infections, allergy and asthma)
Chronic alcoholism
AnaemiaRecent blood transfusions for any reason in the past one month.
Tests:
2ml of EDTA blood samples were collected from both the groups by using a vacutainer system and a complete haemogram was done by using a Sysmex KX-21 haematology analyzer, within 4 hours of sample collection. The 2-level controls were run every day in the cell counter, and the counter was maintained according to the manufacturer’s instructions.
Spirometry was performed for all the cases as well as for the controls by trained personnel according to the American Thoracic Society (ATS) guidelines [11] by using a calibrated Spirovit SP 10 spirometer, after explaining the test maneouver to the participants. Two highest values of FEV1 and FVC were taken among the 3 best maneouvers.
The FEV1/FVC ratio% was assessed and the post bronchodilator FEV1% of the predicted value (mentioned as FEV1%) was also evaluated as per the GOLD strategy [12].
STATISTICAL ANALYSIS
The data was analyzed by using SPSS, version 15.0 and the inferential statistics, the Student’s-t-test for the independent samples, the Pearson’s coefficient of correlation, the Regression coefficient and diagnostic efficacy tests were applied with a 5% level of the statistical significance.
RESULTS
[Table/Fig-1] shows the baseline characteristics of the study population. Twenty six (52.0%) welders and 22 (44%) controls were found to be current smokers. An ex-smoker status for more than 1 year was not included as a parameter. Cough, sputum production, a difficulty in breathing and chest tightness were considered as the respiratory symptoms.
Baseline Characteristics of Cases and Controls
| Characteristics | Cases | Controls |
| Range | Mean | SE | 95% CI | Range | Mean | SE | 95%CI |
| Age (Years) | 22-52 | 32.20 | 0.97 | 30.2-34.1 | 21-52 | 33.22 | 1.02 | 31.1-35.2 |
| Work (Years) | 2-25 | 8.36 | 0.72 | 6.9-9.8 | 1-30 | 10.00 | 0.91 | 8.1-11.8 |
| Smoking (Years) | 0-10 | 3.12 | 0.49 | 2.1-4.1 | 0-20 | 4.08 | 0.81 | 2.4-5.7 |
| Cigarettes/day | 0-12 | 2.84 | 0.46 | 1.9-3.7 | 0-12 | 1.82 | 0.43 | 0.9-2.6 |
| Respiratory Symptoms (years) | 0-7 | 2.72 | 0.31 | 2.0-3.3 | 0-10 | 1.04 | 0.35 | 0.3-1.7 |
| Hemoglobin (g/dL) | 11-17 | 14.42 | 0.17 | 14.0-14.7 | 11-22 | 13.64 | 0.34 | 12.9-14.3 |
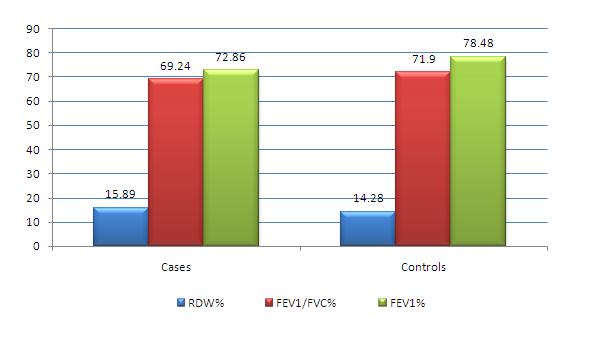
| FEV1/FVC ratio (%) | 59-82 | 69.24 | 0.78 | 67.6-70.8 | 64-80 | 71.90 | 0.64 | 70.6-73.1 |
| FEV1% | 50-85 | 72.86 | 1.50 | 69.8-75.8 | 58-86 | 78.48 | 0.98 | 76.5-80.4 |
| RDW% | 12.2-18.8 | 15.89 | 0.23 | 12.2-18.8 | 12.3-17.8 | 14.28 | 0.21 | 13.8-14.7 |
Statistically significant mean differences were observed for the spirometry FEV1/FVC ratio% (P=0.01), the FEV1 (%) (P=0.002) and the RDW% (P=0.000) between the cases and the controls [Table/Fig-2] The pulmonary functions, the FEV1/FVC ratio% and the FEV1(%) had a statistically significant negatively high correlation of r = -0.73(p=0.000) and r = -0.66(p=0.000) with the RDW(%) among the cases and a correlation of r = -0.79 (P=0.000) and r = -0.85(P=0.000) with the RDW(%) among the controls.
Comparison for Mean % of Hypothetical Parameters
[Table/Fig-3] shows that the RDW% had a statistically significant positive correlation with the years of the work exposure, the smoking status (years), the number of cigarettes which were smoken/day and the respiratory symptoms (years) among the welders. Among the non welding production workers, there was a statistically significant correlation between the RDW% and age (years), the smoking status (years) and the respiratory symptoms (years).
Pearson Correlation of RDW with other variables in cases & controls *- Significance at 0.05 level
| Parameter with RDW | CASES r value (p value) | CONTROLS r value (p value) |
| Age (Years) | +0.23 (0.101) | +0.33(0.01)* |
| Work (Years) | +0.74 (0.000)* | +0.26 (0.06) |
| Smoking status (Years) | +0.34 (0.01)* | +0.77(0.000)* |
| Number of cigarettes/day | +0.50 (0.000)* | +0.06 (0.80) |
| Respiratory symptoms (Years) | +0.58 (0.000)* | +0.43 (0.001)* |
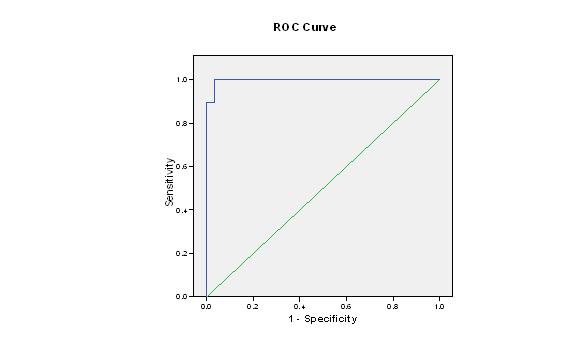
Q 1: From the Receiver Operator Characteristic curve (ROC) which was derived from the control for the criteria FEV1/FVC <70 [Table/Fig-4], an RDW% cut off level of 12.7% was found to yield a good correlation, r = -0.73 (p=0.000) with a sensitivity of 100%, a specificity of 26.67%, a positive predictive value of 47.62% and a negative predictive value of 100%.
ROC curve for RDW% with FEV1/FVC < 70%
Q 2: The ROC curve (area under the curve of 1.000 (P=0.007) from the controls for the criteria, FEV1% < 80, along with the FEV1/FVC ratio% of <70, showed a statistically significant moderate negative correlation of r = -0.48 (p=0.003) between the RDW% and the FEV1%. The sensitivity, specificity, positive predictive value and the negative predictive value were 85.00%, 100%, 100%, and 90.91% respectively for a cut off value of the RDW% of 14.9%.
Q3: The Bivariate Linear Regression technique [13] was employed to assess the influence of the smoking status. With the FEV1/FVC (%) as the response variable and the smoking status and the RDW% as the predictor variables, there was a statistical significance with the regression coefficient [βrdw ± se (βrdw) to be -2.45±0.36 (p=0.000)] and an insignificant regression coefficient [βSS ± SE (βSS) to be -0.047±0.17 (p=0.785)].
After adjusting for the smoking status, we obtained βRDW ± SE (βRDW) to be -2.49 ± 0.33 (p= 0.000), which was statistically significant for the FEV1/FVC ratio. The co-variation between the smoking status and RDW was observed to be a positively minimal correlation, r = +0.345 (p=0.007), with a statistically significant regression coefficient βSS ± SE (βSS) to be +0.163 ± 0.06 (p=0.014) on RDW (%).
DISCUSSION
We chose automobile welders as our cases because of their vulnerability to get obstructive lung diseases and also because a periodic spirometry was considered as mandatory for them. We had chosen two variables, namely the FEV1/FVC ratio% and the FEV1% to assess the pulmonary function in our study population. A change in the FEV1/FVC ratio% as an early indicator of COPD [14] and a post bronchodilator FEV1% of a predicted value helps in differentiating mild COPD from the moderate to the severe cases.
The aetiopathogenesis of the changes in the RDW% in individuals with a pulmonary compromise has yet to be identified. Chronic inflammation, which could leading to the release of the inflammatory cytokines [15], which was compounded with mild nutritional deficiencies and smoking [2], would have been the potential mechanism which could lead to an elevated RDW in such cases.
The present study examined the relationship between the RDW% and the FEV1/FVC ratio% in the welders of an automobile industry near Chennai. Initially, we found a statistically significant negative correlation between the RDW% and the FEV1/FVC ratio% in both the cases and the controls. The normative values of RDW in our local population has not been defined as yet and so we derived a cut-off point for the RDW from the controls, based on the sensitivity tests [16], which was 12.7%, while an FEV1/FVC ratio% of <70 was used as the criteria.. Our study showed that the RDW% was independently and negatively correlated with the FEV1/FVC ratio. This interaction was statistically significant even after adjusting for smoking, though the smoking status positively influenced the RDW values per se. This finding was in agreement with the previously published studies [2]. We could also observe that the cut off value for RDW was 14.9%, when we introduced the FEV1% of the predicted value of < 80% along with an FEV1/FVC ratio% of <70 and a statistically significant negative correlation was observed between the 2 variables among the cases.
This indicated that the RDW% values increased with decreasing lung functions, which suggested the possibility of using the RDW% as a bio marker, not only in identifying COPD, but also as a marker, to assess the severity of obstructive lung disease.
LIMITATION OF THE STUDY
A prospective cohort study with a larger sample size and other influencing factors may prove to be more useful in evaluating the role of RDW in the early diagnosis of obstructive lung disease among the welders.
CONCLUSION
This study confirmed our hypothesis that RDW could be used a marker to identify the pulmonary impairment in automobile welders. Since RDW was routinely reported as a part of the complete blood count, it was available for most of the factory workers who were undergoing periodic health checkups and so, understanding its significance would prove to be helpful in identifying the risk of the pulmonary impairment.