Anatomically, the upper end of the femur is a common site for osteoporosis. The trabecular pattern in the upper end of femur is analyzed on the basis of the presence or absence, the relative number and density of the trabeculae, trabecular group and also by the grading of trabeculae. Osteoporosis is the most important cause of the fractures of the hip, vertebrae and the distal radius in the elderly [1]. The post-menopausal changes of bone metabolism are due to an oestrogen deficient state. The early detection of osteoporosis can effectively prevent these fractures. An appropriate treatment would reduce the morbidity and the mortality in osteoporotic individuals, especially in post-menopausal women.
The present study is undertaken to identify the trabecular pattern in the upper end of the femur radiographically in post-menopausal women and to establish that the changes in the trabecular pattern can be used for the diagnosis and the grading of osteoporosis. While osteoporosis is observed in both elderly men and women,its prevalence is much higher in post-menopausal women. The validated data from this study will be of use to all the clinicians for recognizing the trabecular patterns and it will possibly help them in detecting osteoporosis and in limiting its progress in its early stages. The radiographic study of the pelvis is a simple and an easy method for studying the radiographic changes in the trabecular pattern of the upper end of the femur in post-menopausal women.
MATERIALS AND METHODS
The data for the present study was 200 frontal projection pelvis radiographs of female subjects who were between 18-100 years of age during 2006-2007, who were referred to Department of Radiodiagnosis, M.S. Ramaiah Medical College and Teaching Hospital, Bangalore.
THE SAMPLE SIZE AND THE DESIGN OF THE STUDY
A record study on the plain radiographs of the pelvis in 100 female subjects with an equal number of controls, to evaluate the trabecular pattern in the upper end of the femur. As it was a record study, no follow up was available.
THE STUDY POPULATION
Inclusion criteria:
⇒ Plain radiographs of the pelvis in female subjects who were in the post-menopausal age group.
Exclusion criteria:
⇒ Plain radiographs of the pelvis in female subjects who were less than 40 years of age.
⇒ Plain radiographs of female subjects with any known pathology in the pelvis other than osteoporosis.
CONTROLS
Inclusion criteria:
⇒ Plain radiographs of the pelvis in female subjects who were in the reproductive age group of 18-40 years.
Exclusion criteria:
⇒ Any known pathology in the pelvis.
⇒ Females who were on oral contraceptives, steroid treatment and calcium supplements.
STATISTICAL ANALYSIS
⇒ The Chi-square test was used for the analysis of the data.
METHOD
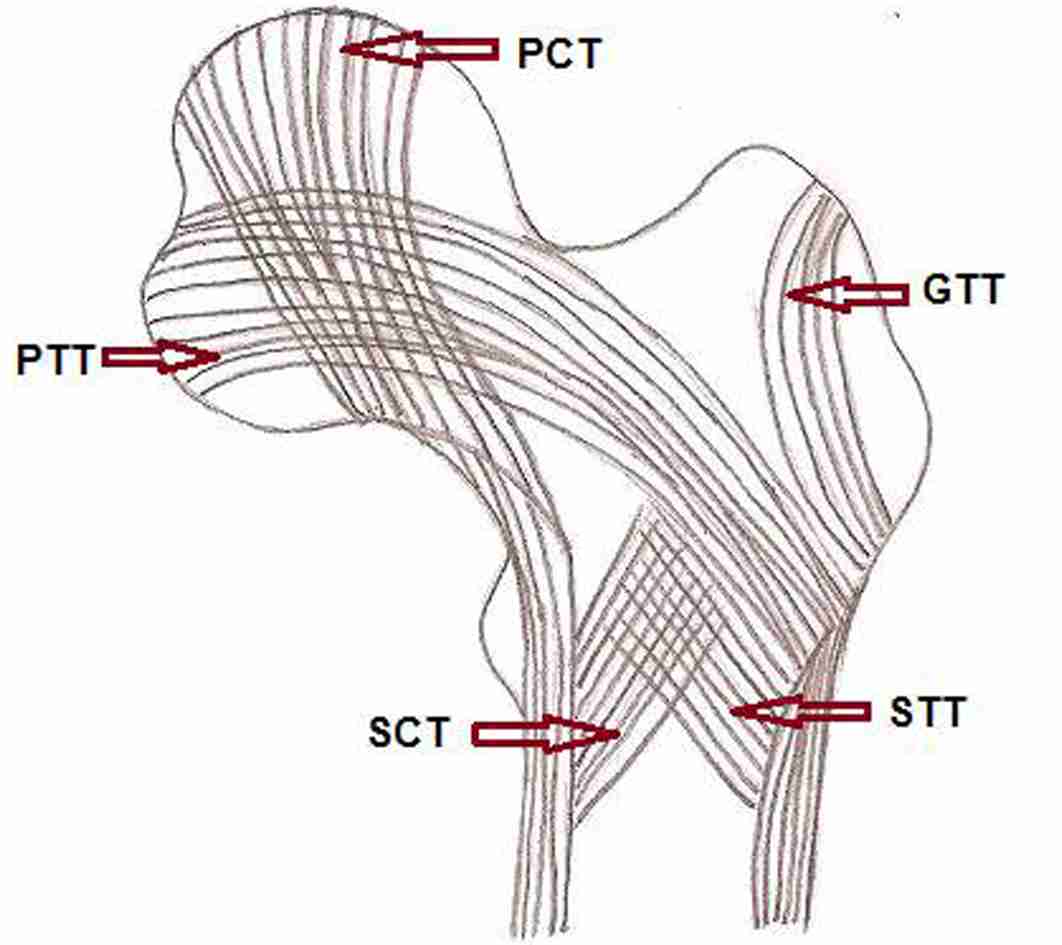
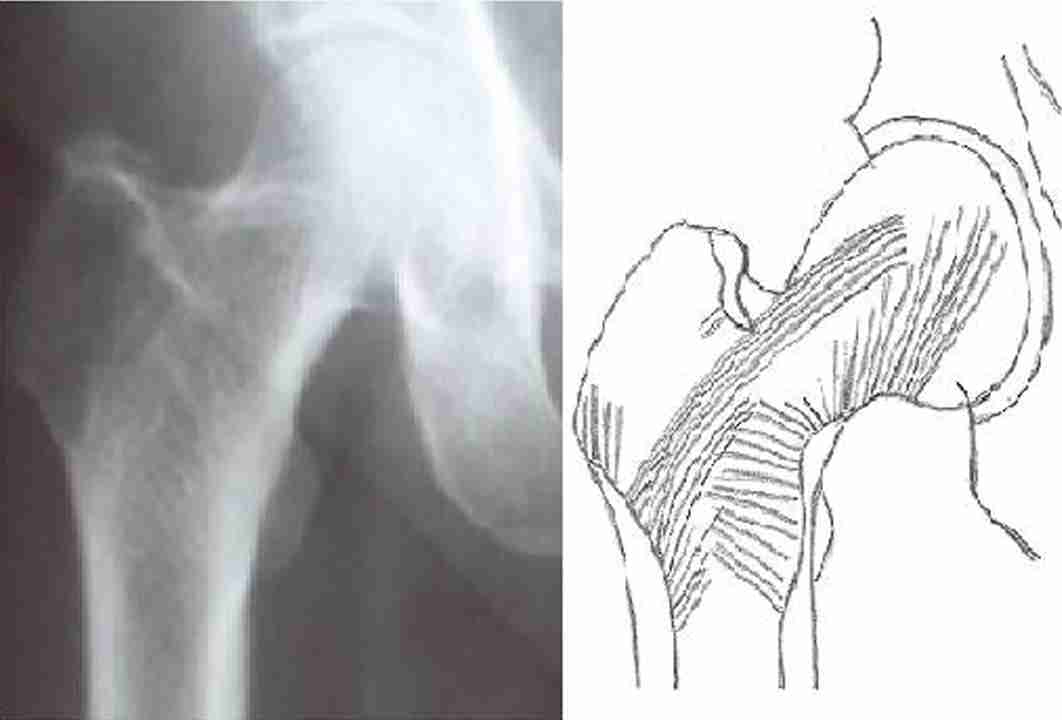
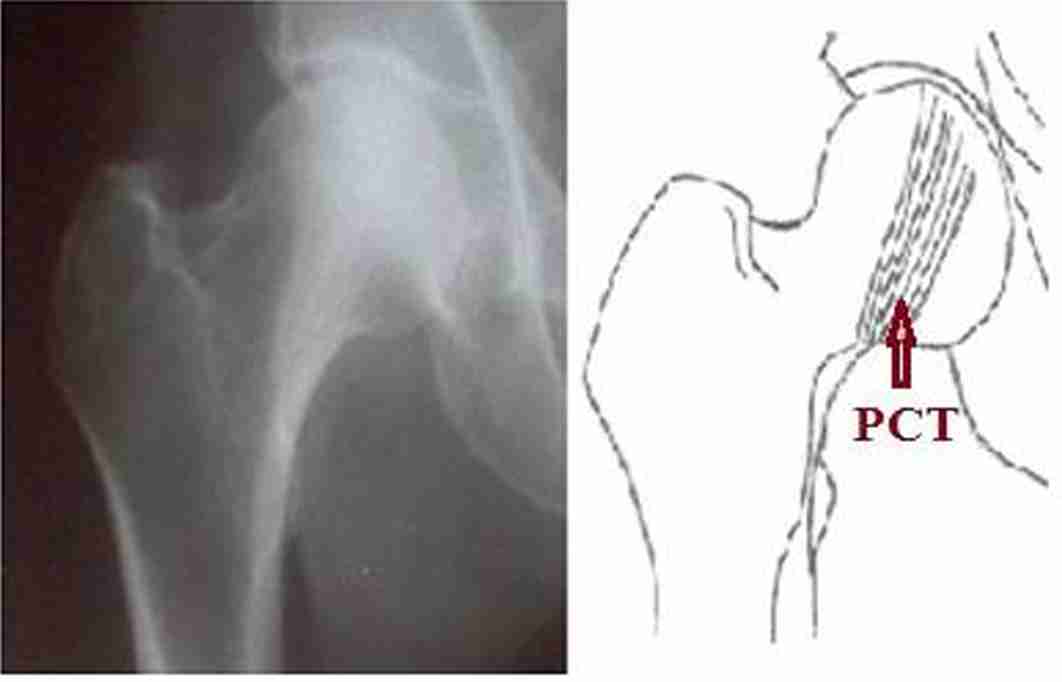
The radiographs of the pelvis were taken at a distance of 100cms for the anteroposterior view, with the hip in slight internal rotation. Standard radiographic techniques, depending on the patients’ build, were used. The upper end of the femur was evaluated for the trabecular pattern according to Singh’s methodology [2], [Table/Fig -1, 2]. The grading of the trabecular pattern which indicated the severity of osteoporosis, was done as was suggested by Singh et al., (1970), with some modifications [Table/Fig-1].
Grading of trabecular pattern
| Singh’s Grading | Present Study |
| Grade VI | All normal groups of trabeculae are visible in the radio graphs of upper end femur | Grade N |
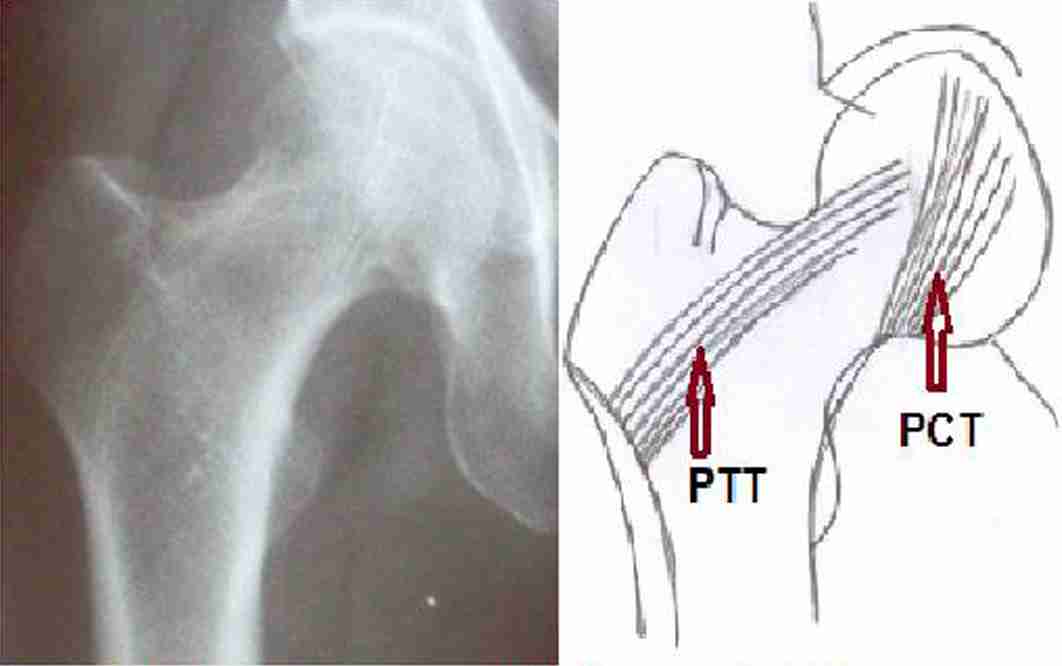
| Grade V | The PCT & PTT are attenuated. SCT is not clearly Demarcated. | Grade A |
| Grade IV | The PTT is decreased in number, the STT is not clearly Demarcated. |
| Grade III | A break in the continuity of PTT and is visible only in uppper part opposite the greater trochanter. | Grade B |
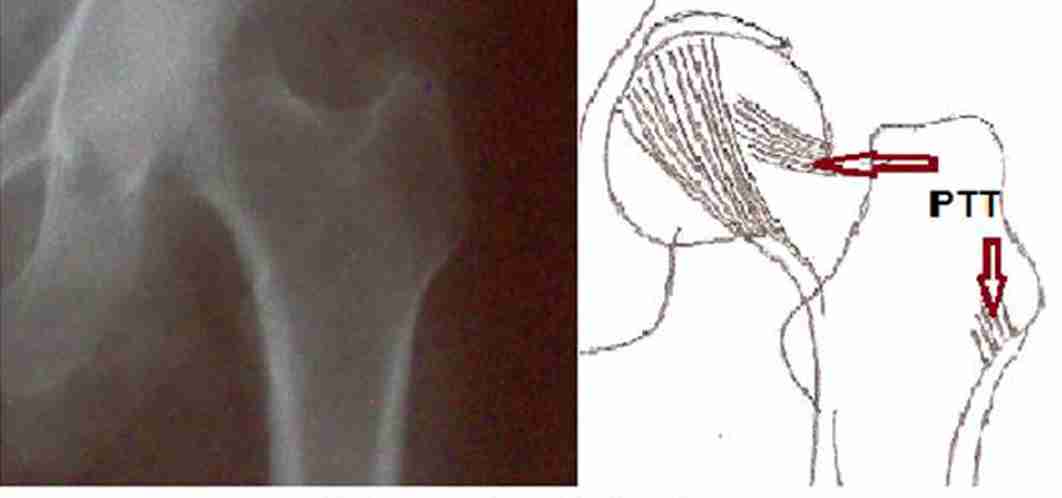
| Grade II | Only PCT seen indicating fairly advanced osteoporosis. | Grade C |
| Grade I | Even PCT is markedly reduced in number, not clearly seen- indicating severe degree of osteoporosis. |
PCT – Principal compressive trabeculae, SCT – Secondary compressive trabeculae, PTT – Principal tensile trabeculae, STT – Secondary tensile trabeculae, GTT – Greater trochanter trabeculae.
In Singh’s method of grading, the secondary tensile trabeculae are not appreciated in Grade IV and the secondary compressive trabeculae are not clearly demarcated in Grade V. However, during our data collection, it was noticed that certain overlapping was present between the Grades IV and V, as the secondary compressive trabeculae were seen in Grade IV. So, the Grades IV and V were clubbed into one group and it was named as Grade ‘A’ [Table/Fig 3] - Grade A). Grade III was named as Grade ‘B’ [Table/Fig-4] - Grade B). Similarly, Grade II and I in which only the principal compressive trabeculae were prominent, were clubbed into one group and it was named as Grade ‘C’ [Table/Fig-5] - Grade C). Grade VI was named as Grade ‘N’ (normal) -[Table/Fig-6].
RESULTS
In this study, the minimum age in the cases was 41 years and in the controls, it was 20 years. The maximum age in the cases was 93 years and in the controls, it was 39 years. The mean menopausal age in the study subjects was 46.78 years. In the study subjects, 40% were in the 1-10 years postmenopausal period, while only 3 % were in the more than 40 years postmenopausal period.
In the controls, all the types of trabeculae - principal compressive and tensile, secondary compressive and tensile and the greater trochanter trabeculae were present in all the subjects on both the sides [Table/Fig-3].
In the study subjects, the principal compressive trabeculae were present in all subjects according to the period of the post-menopausal status and the age (in years) [Table/Fig-7]. The secondary compressive trabeculae showed a difference in their distribution on the 2 sides in the 1-10 years postmenopausal status group, while it was absent in the 31-40 years postmenopausal status group on both the sides [Table/Fig-7].
Distribution of principal & secondary compressive trabeculae according to period of post-menopausal status (in years)
| Post- Menopausal status (in years) | No. Of Subjects | Principal Compressive Trabeculae | Secondary Compressive Trabeculae |
| Left Site | Right Site | Left Site | Right Site |
| Present | Present | Present | Absent | Present | Absent |
| 1-10 yrs | 38 | 38 | 38 | 19 | 19 | 6 | 32 |
| 100.0% | 100.0% | 50.0% | 50.0% | 15.8% | 84.2% |
| 11-20 yrs | 28 | 28 | 28 | 1 | 27 | 1 | 27 |
| 100.0% | 100.0% | 3.6% | 96.4% | 3.6% | 96.4% |
| 21-30 yrs | 19 | 19 | 19 | 1 | 18 | 1 | 18 |
| 100.0% | 100.0% | 5.3% | 94.7% | 5.3% | 94.7% |
| 31-40 yrs | 8 | 8 | 8 | | 8 | | 8 |
| 100.0% | 100.0% | | 100.0% | | 100.0% |
| >40 yrs | 3 | 3 | 3 | | 3 | | 3 |
| 100.0% | 100.0% | | 100.0% | | 100.0% |
| Total | 96 | 96 | 96 | 21 | 75 | 8 | 88 |
| 100.0% | 100.0% | 21.9% | 78.1% | 8.3% | 91.7% |
The extent of the principal tensile trabeculae was inversely related to the period of the postmenopausal status. While all the subjects in the postmenopausal status of 1-10 years showed the presence of the principal tensile trabeculae on both the sides, only 2 subjects in the >40 years postmenopausal status group showed the presence of the principal tensile trabeculae [Table/Fig-8]. The distribution of the secondary tensile trabeculae showed that they were absent bilaterally in the 31-40 years postmenopausal status group. However, in one case, they were present only on the right side and this was statistically insignificant [Table/Fig-8]. The distribution of the greater trochanter trabeculae was similar on both the sides and it was absent bilaterally in the 31-40 years postmenopausal status group. The distribution of the grading of the trabecular pattern in the upper end of the femur on the left and the right sides for the severity of osteoporosis showed that as the number of years increased after menopause, the grading progressed from Grade N (Normal) to Grade A to Grade B to Grade C [Table/Fig 9 & 10].
Distribution of principal & secondary tensile trabeculae according to period of post-menopausal status (in years)
| Post- Menopausal status (in years) | No. Of Subjects | Principal Tensile Trabeculae | Secondary Tensile Trabeculae |
| Left Site | Right Site | Left Site | Right Site |
| Present | Absent | Present | Absent | Present | Absent | Present | Absent |
| 1-10 yrs | 38 | 38 | | 38 | | 6 | 32 | 19 | 19 |
| 100.0% | | 100.0% | | 15.8% | 84.2% | 50.0% | 50.0% |
| 11-20 yrs | 28 | 27 | 1 | 27 | 1 | | 28 | 1 | 27 |
| 96.4% | 3.6% | 96.4% | 3.6% | | 100.0% | 3.6% | 96.4% |
| 21-30 yrs | 19 | 16 | 3 | 16 | 3 | 1 | 18 | 1 | 18 |
| 84.2% | 15.8% | 84.2% | 15.8% | 5.3% | 94.7% | 5.3% | 94.7% |
| 31-40 yrs | 8 | 6 | 2 | 6 | 2 | | 8 | | 8 |
| 75.0% | 25.0% | 75.0% | 25.0% | | 100.0% | | 100.0% |
| >40 yrs | 3 | 2 | 1 | 2 | 1 | | 3 | | 3 |
| 66.7% | 33.3% | 66.7% | 33.3% | | 100.0% | | 100.0% |
| Total | 96 | 89 | 7 | 89 | 7 | 7 | 89 | 21 | 75 |
| 92.7% | 7.3% | 92.7% | 7.3% | 7.3% | 92.7% | 21.9% | 78.1% |
Distribution of grading of the trabecular pattern in upper end of femur on left side according to period of post-menopausal status (in years)
| Post-menopausal status (in years) | Grading of trabecular pattern- Left site | Total |
| Grade N (Normal) | Grade A | Grade B | Grade C |
| 1-10 yrs | 6 | 23 | 9 | | 38 |
| 15.8% | 60.5% | 23.7% | | 100.0% |
| 11-20 yrs | 1 | 12 | 13 | 2 | 28 |
| 3.6% | 42.9% | 46.4% | 7.1% | 100.0% |
| 21-30 yrs | 1 | 3 | 9 | 6 | 19 |
| 5.3% | 15.8% | 47.4% | 31.6% | 100.0% |
| 31-40 yrs | | 2 | | 6 | 8 |
| 25.0% | | 75.0% | 100.0% |
| >40 yrs | | | | 3 | 3 |
| | | 100.0% | 100.0% |
| Total | 8 | 40 | 31 | 17 | 96 |
| 8.3% | 41.7% | 32.3% | 17.7% | 100.0% |
Distribution of grading of the trabecular pattern in upper end of femur on right side according to period of post-menopausal status (in years).
| Post-menopausal status (in years) | Grading of trabecular pattern- Right site | Total |
| Grade (Normal) N | Grade A | Grade B | Grade C |
| 1-10 yrs | 6 | 23 | 9 | | 38 |
| 15.8% | 60.5% | 23.7% | | 100.0% |
| 11-20 yrs | 1 | 12 | 13 | 2 | 28 |
| 3.6% | 42.9% | 46.4% | 7.1% | 100.0% |
| 21-30 yrs | 1 | 4 | 8 | 6 | 19 |
| 5.3% | 21.1% | 42.1% | 31.6% | 100.0% |
| 31-40 yrs | | 2 | | 6 | 8 |
| 25.0% | | 75.0% | 100.0% |
| >40 yrs | | | | 3 | 3 |
| | | 100.0% | 100.0% |
| Total | 8 | 41 | 30 | 17 | 96 |
| 8.3% | 42.7% | 31.3% | 17.7% | 100.0% |
DISCUSSION
Anatomically, a reduced amount of the bone tissue, as compared with controls of the same age and sex, indicates osteoporosis or osteopaenia [3]. An oestrogen deficiency preferentially affects the trabecular bone which has a large surface area (80% of the total) than the cortical bone [4]. The trabeculae in the upper end of the femur in a normal individual are arranged along the lines of compression and tension stresses which are produced in the bone during weight bearing [2].
The trabecular bone undergoes specific morphologic and biochemical changes with age. The steep rise in the incidence of the hip and vertebral fractures with age have been demonstrated to be due to age-dependent reductions in the bone density and bone strength, thus proving that osteoporosis is the most important determinant of the increased fracture incidence among the elderly [5]. Osteoporosis is highly prevalent in India and an estimated 61 million people in India are reported to be affected by it. It has been reported that osteoporotic fractures occur 10-20 years earlier in Indians as compared to those in Caucasians [6]. Osteoporosis is going to be the most important worldwide concern with the increase in the life span of individuals throughout the world and with the continued improvement of the oncologic treatment [7]. All forms of osteoporosis have been attributed to a reduced bone formation, though there a few postulations which attribute it to increased bone resorption [8]. An important predictor of the risk of osteoporosis in later life is the bone mass peak level, as the process of bone loss begins slowly during the premenopausal years [9,10].
The Singh index was found to be the most useful of the three methods (the Singh index, the vertebral fracture index and the metacarpal cortical thickness) in separating 125 hip fracture patients from 74 elderly controls [11]. The radiographic measurements of the Singh index, the trochanteric width, the femoral neck and the femoral shaft cortex thickness can predict hip fractures as powerfully as the femoral neck BMD (bone mineral density) which is measured by using DEXA (dexa scan) [12]. The femoral neck trabecular texture analysis is reproducible and clinically meaningful and it can be applied to improve the estimation of the fracture risk in conjunction with other clinical data or where the densitometry data cannot be obtained (Eg: in retrospective studies) [13]. A better correlation between the Singh index and the vertebral fracture occurrence was observed, with no significant correlation between the Singh index and the DEXA measurements of the bone mineral density in the proximal femur [14]. The Singh index may be useful in the measurement of the bone mass in the proximal femur, as a good correlation has been reported between the bone ash density and the Singh grade in the excised femoral heads [15]. A good separation of the fracture patients from the controls have been done by using the Singh index [16, 17]. The correlation between the Singh index and the bone mineral densitometry in the femoral neck in the screening and the grading of osteoporosis and in predicting femoral neck fractures has been reported to be from moderate to nil [18-20]. The computer texture analysis, when it is applied to the Singh index, can be used in large studies where the speed and the consistency of the measurement are important [21]. Computerized algorithms have a significant correlation to the bone quality assessment on the use of the Singh index and since radiographic facilities are available all over the country, it can be used for the the screening of osteoporosis [22].
CONCLUSION
This study attempted to examine in detail, the trabecular pattern in the upper end of the femur in postmenopausal women and to find out the utility of these changes in detecting osteoporosis and in limiting its progress in the early stages. The trabecular pattern in the upper ends of the femur is not routinely appreciated and reported in radiographic studies of the pelvis. It is a more simplified and an objective method of grading osteoporosis. If done, it can be used to assess the severity of osteoporosis and to thereby predict the risk of hip fractures, as the spine and the upper end of the femur are the most common sites for osteoporosis.
The bone quantity varies with the age, sex, race and other physiological variables and hence, the grading in this method is based on the structure rather than on the bone quantity. The internal architecture of the bone is independent of these variables, though osteoporosis is known to occur earlier in post-menopausal women.
The limitation of the Singh index has been the difficulty in the consistent interpretation, as there is a wide variation in the reproducibility and the overlapping of the parameters. Factors such as the propensity of a patient to fall, the degree of the trauma which is received and the manner of falling also have a significant influence on the prediction of the fractures. This study has suggested a more simplified and an objective method of grading osteoporosis, based on the trabecular patterns in the upper ends of the femur.
A judicious application which combines the clinical factors and the grading of the trabecular pattern, which is associated with the texture analysis, can be used to improve the accuracy of the estimation of the fracture risk.