The clinical utility of the analyzer derived haematological indices has been explored in the recent years and it was found to be varied and tremendous. The RDW was originally found to be useful only in classifying anaemias [1]. Later on, studies have proved its potential as a bio marker in various non haematological entities like cardiac failure [2] coronary artery disease [3] and inflammatory bowel disease [4]. Furthermore, it has also been considered as a mortality predictor, particularly for CVD (Cardio Vascular Diseases), [5].
MPV has also been observed to predict the cardio vascular disease related mortality [6] and studies have shown its role as a prognostic marker in cerebro vascular stroke [7].
PDW, when analyzed along with the other platelet parameters, helps in the differential diagnosis of thrombocytosis [8].
There is a need to establish the reference values for these clinically useful parameters in our local population, but until now, the data are lacking. Moreover, Chennai has a high prevalence of nutritional anaemias [9] as well as Cardio Vascular Diseases (CVD) related mortality [10] and so, the reference values for RDW and MPV will be of help for a better interpretation of the haematological results. Moreover, the reference values which have been established by the studies which were done in different geographic locations may not reflect the normalcy of the population in question and so, it is always desirable to identify the region specific reference intervals.
Material And Methods
Ethical Approval
This study was approved by our institutional research and ethical committee.
The study Population and the Subject Recruitment
We carried out a retrospective study; the reference population comprised of healthy adults who were aged 18-70 years, who had undergone preventive health check ups in our hospital from January to December of 2011. Their medical history and clinical examination details were retrieved from the medical records. Out of the 2443 case sheets which were screened, five hundred (20.4% of the subjects) were selected, based on the inclusion and the exclusion as per the IFCC protocol [11].
Inclusion criteria
18-70 years of age
Both the genders
Exclusion Criteria
Pathophysiological States - Renal failure, cardiac diseases, chronic respiratory diseases, liver diseases, malabsorption syndromes, malignancies and haematological disorders which included anaemias.
Systemic Diseases – Hypertension and Diabetes mellitus.
The chronic intake of pharmacologically active agents like alcohol, tobacco or oral contraceptives, (for more than six months during the time of the health checkup).
Replacement or Supplementation Therapy e.g. Thyroxine, Insulin
Modified Physiological States - Pregnancy, psychological and mental disorders -exercise/physical training /food intake prior to blood collection.
Other Factors - Obesity (BMI >30 kg/m2).
The institutional SOPs (Standard Operating Procedures) were followed for the sample collection and for conducting the tests.
Sample collection
All samples were collected between 7.00 am and 10 am. 3ml of whole blood was collected from the cubital vein with a vacutainer system into k3 EDTA tubes.
Tests: A complete haemogram was done by using a Sysmex KX-21 haematology analyzer within four hours of the blood collection. Dedicated reagents and standard methodologies were used. The 2-level quality controls were run every day and the analyzer was maintained according to the manufacturer’s instructions during the entire period of the study. The ESR estimation was done by using the Westergren method according to the ICSH protocol [12].
Statistical Analysis
The data for the haematological parameters were collected and analyzed by using SPSS, version 16.0. The point estimate of the mean and the median with an interval estimate of 2.5 percentile and 97.5 percentile were provided as the reference values. The inferential statistics student t-test was done for the difference of all the parameters between the genders and the age at a 5% level of significance.
Results
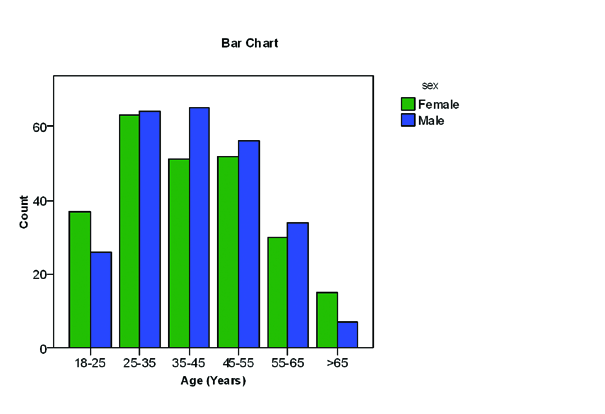
Among the 500 individuals, 248 (49.6%) were females and 252 (50.4%) were males. [Table/Fig-1] shows the age-gender distribution of the reference individuals. A majority of them (70%) were in the 25 to 55 years age group.
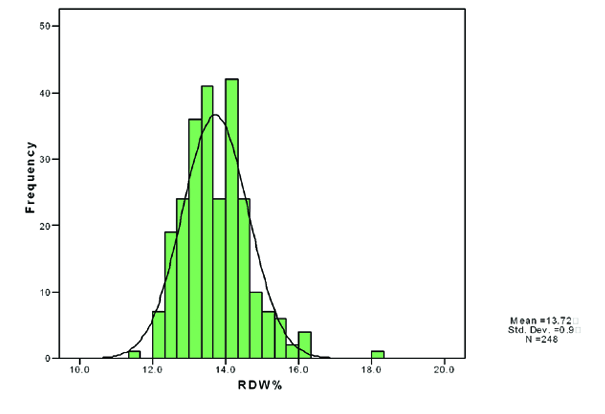
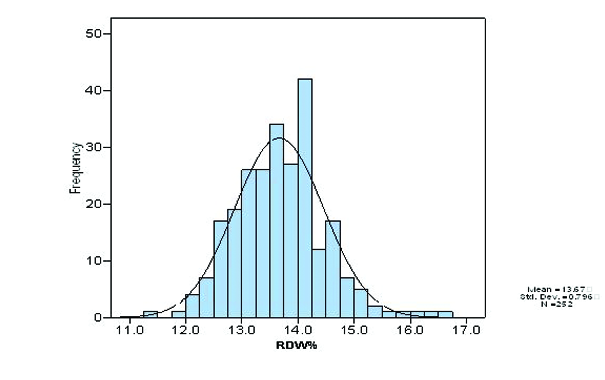
Frequency histograms were prepared for all the analytes and they showed the Gaussian distribution. [Table/Fig-2] and [Table/Fig-3] showed the Gaussian distribution of the RDW among the males and females in the histogram.
The means ± standard error and the study reference interval (2.5 – 97.5 percentile) for the males and the females are presented in [Table/Fig-4]. The reference intervals were calculated, based on the IFCC and the CLSI [13] guidelines. The males had a higher mean RBC count (5.10 X10¹²/L versus 4.39X10¹²/L), haemoglobin (14.43 g/dL versus 12.14 g/dL), haematocrit (41.63% versus 35.85%), MCH (28.74 pg versus 28.07 pg), MCHC (34.81% versus 34.19%) and PDW (13.07fL versus 11.96fL), whereas the females had a higher mean WBC count (8.45 X10⁹/L versus 8.26 X10⁹/L), MCV (81.77 fL versus 81.67 fL), Platelet count (261.60 X10⁹/L versus 242.26 X10⁹/L), RDW (13.72% versus 13.66%) and MPV (10.10 fL versus 9.71 fL) than their counterparts.
Statistically significant gender based differences in the means were observed for all the RBC parameters ( i.e. RBC count, haemoglobin, haematocrit, MCH and MCHC) except for MCV and RDW, for all the platelet parameters (Platelet count, PDW and MPV) and for ESR. The WBC (total count, differential lymphocytes%, and neutrophils %) did not show significant differences among the genders except for a differential mixed %.
Our study reference intervals were compared with the existing reference values [Table/Fig-5]. These values are currently in use in our laboratory and they were derived, based on the literature and the standard reference books [14-17]. The lower limits of the RBC count, haemoglobin, haematocrit, MCV and MCH were comparably lower; more so in females. Both the lower and the upper limits showed an increase with the RDW and the MPV values in both males and females. MCHC and the WBC parameters, the total count and the differential lymphocyte % showed a mild increase in the upper limits. An increase in the upper limit of ESR (with 30.2% males and 38.3% females as the outliers) was observed in comparison with the existing reference values. MCHC showed the maximum percentage of the study individuals (64.3% of the males and 44% of the females) outside the existing reference values, followed by MCV (63.1% of the males and 59.3% of the females).
Age-Gender distribution of Reference Individuals

Histogram of RDW for Males

Histogram of RDW for females

The reference individuals were further sub classified into more homogenous groups by stratifying them according to two intervals of age (<45 and >45years).
[Table/Fig-6] shows the mean values of the males and females when they were stratified according to the age. Statistically significant age related differences in the mean values of the RBC, haemoglobin, MCV, MCH, MCHC, platelets, PDW and ESR were observed in the males. However, among the females, haemoglobin, MPV and ESR showed statistically significant age related differences in the mean values.
Study reference interval s, Existing reference interval and the percentage of outliers
| | N | Study Reference interval | Existing Reference interval | % of individuals outside the existing reference interval |
|---|
| RBC X1012/L | Males | 252 | 4.01-6.04 | 4.5-5.5 | 36.5 |
| Females | 248 | 3.44-5.30 | 3.8-4.8 | 27.4 |
| Together | 500 | 3.55-6.00 | | |
| Hb g/dL | Males | 252 | 11.13-17.40 | 13.0-17.0 | 20.2 |
| Females | 248 | 9.22-14.67 | 12.0-15.0 | 41.5 |
| Together | 500 | 9.75-17.14 | | |
| HCT % | Males | 252 | 33.07-49.97 | 40-50 | 30.2 |
| Females | 248 | 29.00-42.78 | 36-46 | 49.6 |
| Together | 500 | 29.61-48.74 | | |
| MCV fL | Males | 252 | 73.33-91.74 | 83-101 | 63.1 |
| Females | 248 | 71.80-90.82 | | 59.3 |
| Together | 500 | 72.11-91.10 | | |
| MCH pg | Males | 252 | 24.00.10-33.40 | 27-32 | 22.2 |
| Females | 248 | 24.00-31.96 | | 24.6 |
| Together | 500 | 24.00-33.00 | | |
| MCHC g/dL | Males | 252 | 32.10-36.90 | 32-34.5 | 64.3 |
| Females | 248 | 31.00-36.96 | | 44.0 |
| Together | 500 | 32.00-36.90 | | |
| RDW % | Males | 252 | 12.23-15.36 | 11.5-14.5 | 11.5 |
| Females | 248 | 12.3-15.85 | | 13.3 |
| Together | 500 | 12.3-15.59 | | |
| WBC X109/L | Males | 252 | 1.63-13.53 | 1.0-10.0 | 19.0 |
| Females | 248 | 4.60-12.95 | | 23.8 |
| Together | 500 | 4.60-13.29 | | |
| Lymphocytes % | Males | 252 | 18.13-48.00 | 20-40 | 21.4 |
| Females | 248 | 12.00-52.55 | | 27.8 |
| Together | 500 | 14.00-50.00 | | |
| Mixed% | Males | 252 | 2.00-16.40 | 4-18 | 9.9 |
| Females | 248 | 2.00-19.83 | | 30.6 |
| Together | 500 | 2.00-18.21 | | |
| Neutrephils% | Males | 252 | 44.46-75.67 | 40-80 | 1.2 |
| Females | 248 | 37.85-82.31 | | 6.5 |
| Together | 500 | 41.34-78.84 | | |
| Platelets X109/L | Males | 252 | 148.32-404 | 150-400 | 5.6 |
| Females | 248 | 146.9-408.78 | | 6.5 |
| Together | 500 | 148.53-406.42 | | |
| PDW fL | Males | 252 | 9.00-16.56 | 10-17.9 | 11.5 |
| Females | 248 | 8.60-16.10 | | 18.1 |
| Together | 500 | 8.90-16.40 | | |
| MPV fL | Males | 252 | 7.90-13.70 | 7.2-11.7 | 9.1 |
| Females | 248 | 8.00-13.28 | | 15.7 |
| Together | 500 | 8.00-13.15 | | |
| ESR mm/hr | Males | 252 | 4.00-52.70 | Up to 14 | 30.2 |
| Females | 248 | 4.00-73.55 | Up to 20 | 38.3 |
| Together | 500 | 4.00-64.00 | | |
Reference Intervals, Means and Standard Errors of the Reference Population (Males and Females) *Statistical significance at p <0.05
| Parameter | Males( N=252) | Females (N=248) | P value |
|---|
| 2.5 percentile-97.5 percentile reference interval | Mean ±S.E | 2.5 percentile-97.5 percentile reference interval | Mean ±S.E |
|---|
| RBC X1012/L | 4.01-6.04 | 5.10 ±0.03 | 3.44-5.30 | 4.39 ±0.03 | .000* |
| Hb g/dL | 11.13-17.40 | 14.43 ±0.09 | 9.22-14.67 | 12.14 ±0.08 | .000* |
| HCT % | 33.07-49.97 | 41.63 ±0.25 | 29.00-42.78 | 35.85 ±0.21 | .000* |
| MCV fL | 73.33-91.74 | 81.67 ±0.30 | 71.80-90.82 | 81.77 ±0.31 | .819 |
| MCH pg | 24.10-33.40 | 28.74 ±0.14 | 24.00-31.96 | 28.07 ±0.13 | .001* |
| MCHC g/dL | 32.10-36.90 | 34.81 ±0.07 | 31.00-36.96 | 34.19 ±0.08 | .000* |
| RDW % | 12.23-15.36 | 13.66 ±0.05 | 12.3--15.85 | 13.72 ±0.05 | .456 |
| WBC cells X109/L | 4.63-13.53 | 8.26 ±0.14 | 4.60-12.95 | 8.45 ±0.14 | .347 |
| Lymphocytes % | 18.13-48.00 | 33.11 ±0.49 | 12.00-52.55 | 32.27 ±0.63 | .295 |
| Mixed% | 2.00-16.40 | 7.52 ±0.22 | 2.00-19.83 | 6.77 ±0.29 | .043* |
| Neutrophils% | 44.46-75.67 | 59.44 ±0.51 | 37.85-82.31 | 61.04 ±0.68 | .062 |
| Platelets X109/L | 148.32-404 | 242.26 ±3.84 | 146.90-408.78 | 261.6 ±4.42 | .001* |
| PDW fL | 9.00-16.56 | 13.07 ±0.15 | 8.60-16.10 | 11.96 ±0.12 | .000* |
| MPV fL | 7.90-13.70 | 9.71 ±0.08 | 8.00-13.28 | 10.1 ±0.09 | .002* |
| ESR mm/hr | 4.00-52.70 | 14.45 ±0.73 | 4.00-73.55 | 21.31 ±1.09 | .000* |
Mean and standard error for age specific reference intervals *Statistical significance at p <0.05
| Parameter | Males<45 years (n=155) Mean (S.E) | Males > 45 years (n=97) Mean (S.E) | Females <45 years (n=151) Mean (S.E) | Females >45 years (n=97) Mean (S.E.) |
|---|
| WBC cells 103/¼L | 8.25 (0.18) | 8.26 (0.22) | 8.49 (0.17) | 8.37 (0.24) |
| RBC millions / ¼L | 4.93 (0.05) | 5.21 (0.03)* | 4.36 (0.04) | 4.44 (0.04) |
| Hb g/dL | 14.1 (0.12) | 14.8 (0.15) * | 12.01 (0.10) | 12.35 (0.13)* |
| HCT % | 41.34 (0.30) | 42.09 (0.43) | 35.60 (0.27) | 36.24 (0.33) |
| MCV fL | 79.23 (0.27) | 85.55 (0.44) * | 81.44 (0.42) | 82.27 (0.46) |
| MCH pg | 27.41 (0.11) | 30.87 (0.17) * | 28.05 (0.17) | 28.10 (0.19) |
| MCHC g/dL | 34.53 (0.08) | 35.25 (0.11) * | 34.24 (0.10) | 34.12 (0.11) |
| Platelets 103/¼L | 252.6 (5.19) | 225.64 (5.18) * | 260.17 (5.43) | 263.85 (7.53) |
| Lymphocytes % | 33.7 (0.64) | 32.18 (0.77) | 32.39 (0.78) | 32.08 (1.08) |
| Mixed% | 7.5 (0.29) | 7.47 (0.35) | 6.80 (0.38) | 6.73 (0.44) |
| Neutrophils% | 58.7 (0.66) | 60.63 (0.79) | 60.98 (0.81) | 61.13 (1.19) |
| RDW % | 13.7 (0.06) | 13.4 (0.07) * | 13.66 (0.07) | 13.81 (0.08) |
| PDW fL | 13.4 (0.19) | 12.55 (0.24) * | 12.11 (0.15) | 11.72 (0.19) |
| MPV fL | 9.65 (0.10) | 9.81 (0.13) | 10.23 (0.12) | 9.88 (0.13)* |
| ESR mm/hr | 13.0 (0.62) | 16.65 (1.61) * | 19.00 (1.06) | 21.93 (2.22)* |
To understand the effect of age and gender on the RDW, graphs were plotted between the mean value and the age [Table/Fig-7]. Females showed a gradual rise in the RDW values with age, but the RDW values of the males showed a decreasing trend.
Discussion
We observed a high exclusion rate of about 80% while we conducted the study, based on the inclusion and the exclusion criteria. This was because of the high prevalence of clinical anaemia and Diabetes mellitus in our local population.
Statistically significant gender based differences were found for the following parameters and hence, separate reference intervals for the two genders should be considered: RBC count, haemoglobin, haematocrit, MCH, MCHC, Platelets, MPV, PDW and ESR.
We observed that when our reference intervals were compared with the existing reference ranges which are primarily derived from the western literature, there was a decrease in our study reference intervals for all the red cell parameters except for MCHC in both the genders. This was in agreement with the observations which were made by other Indian authors [18,19]. This decrease could be attributed to the prevalence of nutritional deficiencies and worm infestations in our population and this issue needs to be further addressed. The percentage of the reference individuals with values outside the current reference, ranged between 1-64%. The outliers were more for the RBC parameters and for ESR. This highlights the necessity of deriving region specific reference ranges.
The platelet count values did not show much differences from the existing reference values (5-6% outliers). This observation was in contrast to those of the previous studies from our region [20], who had reported a lower upper limit of the platelet count.
The total WBC count and the differential lymphocyte percentage and importantly, the ESR values were higher among our reference individuals. This could be due to the vulnerability of our population to infections. All the RBC parameters except RDW showed a statistically significant increase with age, particularly in males. This increase was not evident in females, though haemoglobin showed a significant change. Both of them showed an increase in the ESR values with age.
In our study, we observed an increase in both the limits of the RDW and the MPV for both the genders as compared to that in the literature [15,17]. The possibility of the prevalence of sub clinical nutritional anaemias would have had an impact on the RDW. At the same time, an increase in the risk of CVD among the local population cannot be under estimated [21] and its risk factors could have influenced both the parameters. This observation merits further studies.
Conclusion
Gender specific reference intervals are essential as there were statistically significant gender related differences in the RBC parameters, the platelet parameters and ESR. The reference intervals which were established by our study differed from the existing reference values.
A high increase in the upper limits of the ESR which was both age and gender related, shows that age as well as the gender based reference intervals needed to be considered for this parameter.
Though it is practically difficult to include age specific reference intervals in our haematology report for all the cases, it is always useful while studies are conducted where such parameters are used.
We derived the reference intervals for the newer parameters in our population as:
RDW:12.23%-15.36% in males and 12.3%-15.85% in females
MPV:7.9 fL-13.7 fL in males and 8 fL -13.28 fL in females
PDW:9 fL -16.56 fL in males and 8 fL -13.28 fL in females.
We prefer gender specific reference intervals for all the three parameters.
We observed an increase in both the limits of the RDW and the MPV values in both males and females. This is a very valuable observation to define the cutoff points for both of them while evaluating for the risk of CVD and its associated mortality.
Future Recommendations
A population based study which correlates ESR with the other markers of inflammation might throw light on the reasons for the higher values of this parameter in our reference population.
A large cohort study is essential to precisely evaluate the age related changes in the RDW, MPV and the PDW.
An analytical study on the RDW and the MPV changes in the individuals who are at a risk for cardiovascular diseases may also be contributory.