Introduction
Diabetes Mellitus (DM) refers to a group of common metabolic disorders that share the phenotype of hyperglycaemia. Based on the insulin secreting capacity of the pancreas DM has been classified as type 1 DM and type 2 DM. Type 1 diabetes is the result of complete or near-total deficiency of insulin. Type 2 DM is a heterogeneous group of disorders characterized by variable degrees of insulin resistance, impaired insulin secretion, and increased glucose production.
Since the major pathophysiology in type 2 DM is insulin resistance, in order to find out the best treatment modality for type 2 DM, various clinical trials have been performed to assess the effects of antioxidants on insulin sensitivity. The role of omega 3 fatty acids was investigated in various trials and it was proven that it improves insulin sensitivity. The Alpha lipoic acid intake was also studied and it showed promise in improving insulin sensitivity. In one placebo controlled trial, the different doses of alpha lipoic acid were compared with placebo and each group was found to have a significant decrease in the insulin resistance as compared to the placebo, but not with each other [1]. One of the clinical trials showed that, the intake of vitamin E was associated with a reduced risk of type 2 diabetes [2].
However, the above trials are limited by small sample size and none of the trials compared the effects of 2 or more antioxidants at the same time.
Therefore the present study was planned to assess comparative effects of 3 different antioxidants, on the insulin sensitivity, which was reflected by parameters like the Body Mass Index (BMI) in Kg/m2, the waist circumference, fasting blood glucose and tserum total cholesterol. Our hypothesis was to find out the most effective antioxidant which will improve insulin sensitivity.
Aims and Objectives
To assess and compare the effects of the antioxidants, viz. vitamin E, omega 3 fatty acids and alpha lipoic acid on the endogenous insulin sensitivity (BMI and Waist circumference) in patients of type 2 Diabetes Mellitus.
To assess and compare the effects of the above antioxidants on the improvement of the glycaemic control (Fasting blood glucose and glycated haemoglobin).
To assess and compare the effects of the above antioxidants on the improvement of the serum lipid profile.
Materials and Methods
The Study Design
The study was conducted in a tertiary care hospital where patients attending the medicine Outpatient Department (OPD)/diabetes clinic were recruited for the study. A synopsis of the study protocol was submitted to the Institutional Ethics committee and approval was obtained. The study protocol was explained to the subjects and written informed consent was taken from all the subjects who participated in the study.
Inclusion Criteria
Patients of either sex in the age group of 21-65 who are previously diagnosed cases of type 2 diabetes mellitus and having the disease duration in between 5-10 years were considered. The patients received both Tab. Metformin and Tab. Glimepiride as oral hypoglycaemic therapy. They were receiving the same oral hypoglycaemic medications for at least 6 months. Their fasting blood sugar values during screening were between 110- 250 mg/dl. They also had any two of the following parameters indicative of decreased insulin sensitivity (NCEP ATP III 2001 Guidelines).
Central obesity: Waist circumference >102 cm (Males), >88 cm (Females)
Hypertriglyceridemia: Triglycerides 150- 400 mg/dL or on lipid lowering medication
Low HDL cholesterol: <40 mg/dL (Males) and <50 mg/dL (Females), or on lipid lowering medication
Hypertension: Blood pressure >130 mm systolic or >85 mm diastolic or on anti- hypertensive medication
Exclusion Criteria
Patient with type 2 diabetes mellitus with fasting blood glucose > 250 mg/dl or patients who are currently on insulin therapy
Patients with uncontrolled hypertension ( Blood pressure > 140/90mmHg in spite of anti HT drugs)
Patients with complications of diabetes including nephropathy & retinopathy
Patients with serum levels of triglycerides >400 mg/dL/ Patients with total cholesterol > 400 mg/dL
Any history of myocardial infarction/cardiac intervention or clinically active cardiovascular disease
Patients with known renal or hepatic diseases ( AST > 82 U/L; ALT > 76 U/L; Creatinine > 1.5mg/dL) including any history of renal stones
Pregnant females
Patients taking any long term medication except anti-diabetic, lipid lowering and antihypertensive medicines.
Unwillingness to participate or mental incapacity to take the drugs
A questionnaire was designed to obtain basic information on demography including weight and height. Blood samples were collected to find out the fasting glucose, glycated haemoglobin (Hb A1C) and serum total cholesterol.
Fasting blood glucose was estimated by glucose oxidase method. Serum total cholesterol was calculated by Modified Roeschlau method while Hb A1C was calculated using cation exchange resin method [3].
Randomization
The randomization was done as per a computer-generated code.
Blinding
The blinding was ensured by making a third party pack the drugs (without removing them from their blister packs) into opaque plastic bottles, which were then sealed. The randomization code was sealed in an envelope. The code number of each individual was also sealed in the envelope.
The study drugs and their doses
α-lipoic acid 300 mg soft gelatin capsules
[Batch number-K117109; expiry date- Jun 2010]
Ecosapentaenoic acid 180 mg + Docosahexaenoic acid 120 mg 6 soft gelatin capsules
[Batch number-G0562808; expiry date-Nov 2010]
Vitamin E 400 mg soft gelatin capsules
[Batch number-G0361908; expiry date-Oct 2010]
Placebo soft gelatin capsules
[Batch number-DCW3701501; expiry date-Dec 2010]
The study population: N=100 (total)
The study groups and the study timeline
The patients were randomized into 4 groups.
Group I (n=25) → Alpha lipoic acid group
Group II (n=25) → Omega 3 fatty acid group
Group III (n=25) → Vitamin E group
Group IV (n=25) → Placebo group
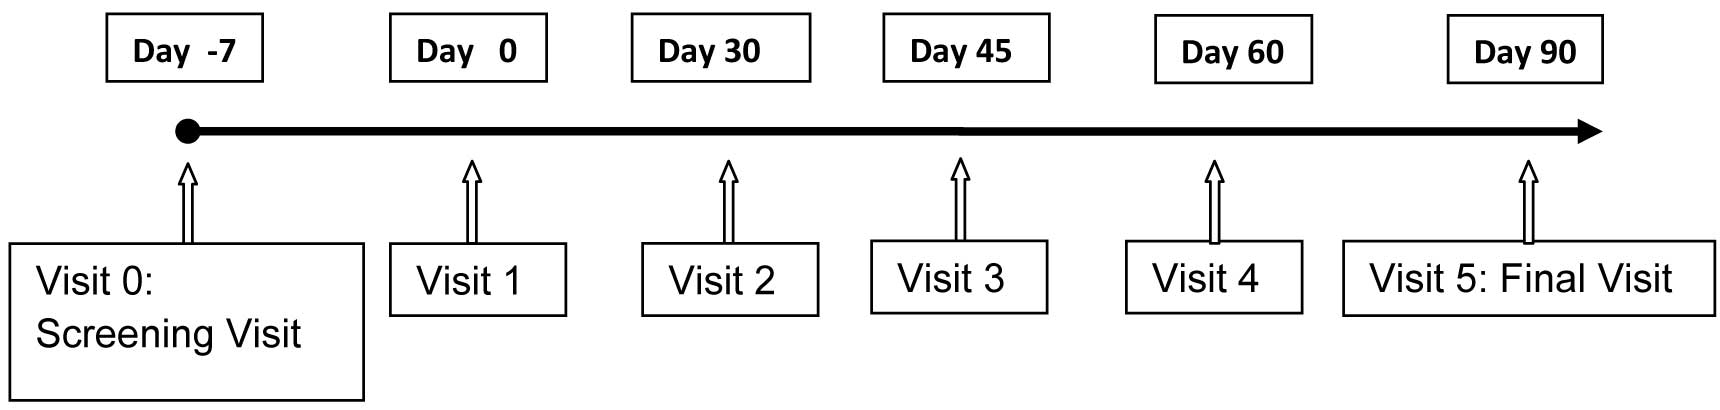
In all the visits the following parameters were recorded.
The general examination which included the height, weight (BMI), waist circumference and the blood pressure, fasting glucose
While in first (V1) and fifth ( V5) following parameters were recorded
Blood (Fasting) → Glycated Hb A1C, Serum total cholesterol
The patient medication was noted at the first visit and based on the subsequent reports the dose was decreased if there was adequate control of blood sugar or it was increased if the control of blood sugar was poor.
Observations and Results
The baseline characteristics:
A total of 104 subjects were enrolled in this study. Among these, 94 (90.38%) subjects completed the study, 2 (1.92%) subjects dropped out after their visit 1(1- Group I and 1- Group II), 6 (6.24) subjects dropped out after visit 2 (2- Group II, 1- Group III, 3- Group IV) and 2 (1.92%) subjects did not come for the final visit (1- Group I and 1- Group IV).
Each of the relevant baseline characteristics were compared among the four groups. The quantitative data was analyzed by using ANOVA, while the qualitative data was analyzed by using the Chi-square test [Table/Fig-1].
The Group wise demographic data (Mean± SD)
| Gr. I (α- lipoic Acid) | Gr. II (Omega-3 fatty acid) | Gr. III (Vitamin E) | Gr. IV (Placebo) | p- value |
|---|
| Age (yrs) | 53.5 ± 1.4 | 54.9 ± 3.5 | 53.6 ± 1.9 | 53.8 ± 2.1 | 0.63 |
| Males (%) | 46.2 | 53.8 | 69.2 | 61.5 | 0.37 |
| Females (%) | 53.8 | 46.2 | 30.8 | 38.5 |
| Weight (kg) | 82.3 ± 11.9 | 81± 9.5 | 81.74 ± 8.5 | 80.5 ± 10.5 | 0.98 |
| Height (m) | 1.50 ± 0.07 | 1.59 ± 0.09 | 1.59 ± 0.08 | 1.57 ± 0.07 | 0.48 |
| BMI (kg/m2) | 32.26 ± 2.26 | 33.09 ± 1.84 | 32.27 ± 1.91 | 32.47± 2.44 | 0.47 |
| Waist Circum-ference (cm) | 101.26 ± 8.57 | 100.15 ± 9.53 | 101.11 ± 6.04 | 101.73 ± 7.55 | 0.91 |
| Fasting Blood Glucose (mg/dl) | 149.73 ± 29.19 | 149.25 ± 21.58 | 150.29 ± 23.61 | 141.96 ± 22.14 | 0.78 |
| Serum TC (mg/dl) | 217.88 ± 20.53 | 218.85 ± 17.32 | 211.64 ± 25.51 | 222.76 ± 26.68 | 0.24 |
All the subjects had duration of the disease between 5-10 years. They were receiving the same oral hypoglycaemic medications for at least 6 months.
p value < 0.05 was considered as significant. None of the baseline characteristics showed statistically significant differences and they were comparable in all the four groups.
A change in the BMI (kg/m2) within the groups from V 1 to V 5 (Mean± SD)
| Groups | Gr. I (α- lipoic Acid) | Gr. II (Omega-3 fatty acid) | Gr. III (Vitamin E) | Gr. IV (Placebo) |
|---|
| Visit 1 (0 day) | 32.26 ±2.26 | 33.09 ±1.84 | 32.27 ±1.91 | 32.47 ± 2.44 |
| Visit 2 | 32.08 ±6.75 | 31.32 ±1.70 | 29.25 ±8.75 | 32.01 ± 2.59 |
| Visit 3 | 32.01 ±5.75 | 30.13 ±1.59 | 29.87 ±8.65 | 31.83 ± 2.42 |
| Visit 4 | 31.72 ±9.04 | 29.88±1.72 | 30.16 ± 6.34 | 31.82 ± 2.60 |
| Visit 5 (90 day) | 31.46 ±8.98 | 29.64 ±1.82 | 29.76 ± 8.63 | 31.31 ± 2.55 |
| p value | 0.012* | 0.0001*** | 0.004** | 0.032* |
p < 0.05,
p < 0.01,
p < 0.001 for comparison between visit 1 and visit 5
All the 4 groups showed a reduction in the Body Mass Index (BMI) at the visit 5 as compared to that at the visit 1, which was statistically significant. However, the levels of the significance for group II (omega 3 fatty acids) and group III (vitamin E) were more than that those which were seen for group I (alpha lipoic acid) and the placebo [Table/Fig-2].
Change in Waist Circumference (cm) within the groups from V 1 to V 5
| (Mean ± SD) |
|---|
| Groups | Gr. I (α- lipoic Acid) | Gr. II (Omega-3 fatty acid) | Gr. III (Vitamin E) | Gr. IV (Placebo) |
|---|
| Visit 1 | 101.26 ± 8.57 | 100.15 ± 9.53 | 101.11 ± 6.04 | 101.73 ± 7.55 |
| Visit 2 | 99.48 ± 8.95 | 99.37 ± 9.26 | 99.87 ± 6.05 | 100.96 ± 7.54 |
| Visit 3 | 98.95 ± 7.99 | 97.57 ± 9.13 | 98.85 ± 6.12 | 101.01 ± 7.16 |
| Visit 4 | 99.24 ± 9.18 | 98.13 ± 8.95 | 98.70 ± 5.95 | 100.30 ± 7.55 |
| Visit 5 | 98.15 ± 9.21 | 97.17 ± 9.26 | 97.91 ± 5.99 | 100.01 ± 8.08 |
| p value | 0.0006*** | 0.0003*** | 0.0003*** | 0.004** |
p < 0.05,
p < 0.01,
p < 0.001 for comparison between visit 1 and visit 5
All the 4 groups showed a statistically significant reduction in the waist circumference at visit 5 as compared to that at the visit 1. However, the level of the significance in the drug treated group was higher as compared to that in the placebo group [Table/Fig-3].
Change in fasting blood glucose (mg/dl) within the groups from V 1 to V 5
| (Mean ± SD) |
|---|
| Groups | Gr. I (α- lipoic Acid) | Gr. II (Omega-3 fatty acid) | Gr. III (Vitamin E) | Gr. IV (Placebo) |
|---|
| Visit 1 | 149.73± 29.19 | 149.25± 21.58 | 150.29± 23.61 | 141.96± 22.14 |
| Visit 2 | 146.96 ± 23.68 | 134.08 ± 19.13 | 139.24 ± 20.70 | 140.42 ± 19.07 |
| Visit 3 | 137.80 ± 21.99 | 135.29 ± 20.86 | 136.96 ± 19.49 | 135.57 ± 23.88 |
| Visit 4 | 140.23 ± 6.99 | 139.58 ± 4.73 | 144.50 ± 7.01 | 147.56 ± 7.89 |
| Visit 5 | 145.53± 21.99 | 139.29± 20.86 | 144.00± 21.89 | 146.88± 23.96 |
| p value | 0.51 | 0.05 | 0.423 | 0.88 |
p < 0.05,
p < 0.01,
p < 0.001 for comparison between visit 1 and visit 5
Group I (alpha-lipoic acid), Group II (omega-3 fatty acids) and Group III (vitamin E) showed reductions in the fasting blood glucose levels, but this was not statistically significant. Group IV (Placebo) showed an increase in the mean values of fasting blood glucose [Table/Fig-4].
Change in serum TC (mg/dl) within the groups from V 1 to V 5 (Mean± SD)
| (Mean ± SD) |
|---|
| Groups | Gr. I (α- lipoic Acid) | Gr. II (Omega-3 fatty acid) | Gr. III (Vitamin E) | Gr. IV (Placebo) |
|---|
| Visit 1 | 217.88 ± 20.53 | 218.85 ± 17.32 | 211.64 ± 25.51 | 222.76 ± 26.68 |
| Visit 5 | 193.42 ± 20.07 | 198.62 ± 02.35 | 186.75 ± 19.27 | 211.11 ± 24.42 |
| p value | 0.0001*** | 0.001*** | 0.0003*** | 0.314 |
p < 0.05,
p < 0.01,
p < 0.001 for comparison between visit 1 and visit 5.
There was a statistically significant decrease in the serum TC levels in Group I (alpha-lipoic acid),Group II (omega-3 fatty acids) and Group III (vitamin E) at the visit 5 as compared to that at the visit 1. Group IV (Placebo) showed a decrease, which was not statistically significant [Table/Fig-5].
Change in serum HbA1C as percentage of the total Hb within the groups from V 1 to V 5
| (Mean ± SD) |
|---|
| Groups | Gr. I (α- lipoic Acid) | Gr. II (Omega-3 fatty acid) | Gr. III (Vitamin E) | Gr. IV (Placebo) |
|---|
| Visit 1 | 11.49 ± 1.38 | 11.36 ± 1.61 | 11.44 ± 1.86 | 11.18 ± 1.45 |
| Visit 5 | 9.96 ± 1.61 | 9.53 ± 1.3 | 9.90 ± 1.75 | 10.77± 1.94 |
| p value | 0.02* | 0.003** | 0.009** | 0.21 |
p < 0.05,
p < 0.01,
p < 0.001 for comparison between visit 1 and visit 5
There was a statistically significant decrease in HbA1C levels in Group I (alpha-lipoic acid), Group II (omega-3 fatty acids) and Group III (vitamin E) at visit 5 compared to visit 1. Group IV (Placebo) showed a decrease which was not statistically significant [Table/Fig-6].
Primary efficacy variables at visit 5 were compared among all 4 groups using the ANOVA test.
Comparison of the primary efficacy variables by using ANOVA
| (Mean ± SD) |
|---|
| Gr. I (α- lipoic acid) | Gr. II (Ω- 3 fatty acid) | Gr. III (Vit E) | Gr. IV (placebo) | p value |
|---|
| BMI (kg/m2) | 31.46 ±8.98 | 29.64 ±1.82 | 29.76±8.63 | 31.31± 2.55 | 0.01** |
| Waist Circum-ference (cm) | 98.15± 9.21 | 97.17± 9.26 | 97.91±5.99 | 100.01±8.08 | 0.468 |
| Blood Glucose (mg/dl) | 145.53± 21.99 | 139.29± 20.86 | 144.00± 21.89 | 146.88± 23.96 | 0.262 |
| Serum TC (mg/dl) | 193.42 ± 20.07 | 198.62 ± 02.35 | 186.75 ± 19.27 | 211.11± 24.42 | 0.0001*** |
p < 0.05,
p < 0.01,
p < 0.001 for comparison of results at visit 5
There was a statistically significant difference at visit 5 among the groups in the BMI and the TC levels. This showed that there was a statistically significant difference between at least two groups among the above parameters.
Discussion
In the present study, the effects of three different antioxidants viz. alpha lipoic acid, omega 3 fatty acids and vitamin E in patients with type 2 DM who had the metabolic syndrome were evaluated. The study design was a randomized, double blind, placebo controlled trial. The parameters which either directly or indirectly measured the endogenous insulin resistance were used, such as:
The parameters of insulin sensitivity and oxidative stress, such as the BMI and the waist circumference
The parameters of the glycaemic control i.e. fasting blood glucose
The parameters of the lipid metabolism i.e. serum total cholesterol
The parameters of insulin sensitivity and oxidative stress such as the BMI and the waist circumference
A statistically significant improvement was observed in the BMI and the waist circumference in each group. A decrease in the BMI and the waist circumference was considered as a marker of an improved insulin sensitivity. The BMI and the waist circumference decreased significantly in all the treatment groups as well as in the placebo group during the treatment period. However, the level of significance of the decrease in the waist circumference was lower in the placebo group as compared to the that in the treatment group. The probable reasons for this improvement in these parameters in the placebo group could be the strict monitoring and thereby the compliance of the patients’ medications (Tab. Metformin and Tab. Glimepiride), education of the patients and their relatives and the implementation of a diet plan.
The parameters of the glycaemic control i.e. fasting blood glucose
The parameter which was included for studying the glycaemic control was the Fasting Blood Sugar Level (FBSL). The FSBL values were reduced in all the treatment groups as compared to the baseline values, while the placebo group showed an increase in the fasting blood sugar levels. However, this decrease in the sugar levels in the treatment group was not statistically significant. The improvement, though it was modest, could be attributed to the addition of the antioxidant treatment, apart from the strict control of the diet and the patients’ education [Table/Fig-2, 3].
The parameters of the lipid metabolism i.e. serum total cholesterol
There was a significant reduction in the levels of total cholesterol in all 3 treatment groups as compared to their baseline values. Vitamin E was found to be superior as compared to both α lipoic acid and omega 3 fatty acids in reducing the total cholesterol.
The Role of the antioxidants
It has long been suspected, but has only been recently demonstrated, that the consumption of fruits and vegetables which are rich in vitamin and other antioxidants can increase the overall antioxidant status [4] [Table/Fig-4]. In the studies on humans and rodents, the dietary supplementation with antioxidants was found to be associated with decreased risk of type 2 DM it was found to induce changes that could be beneficial in reducing insulin resistance and protecting the vascular endothelium [5]. Primary among these are vitamin E (α-tocopherol), α-lipoic acid (thioctic acid) and Ω-3 fatty acids [6] [Table/Fig-5].
In the Goto-Kakizaki (GK) rat, a model for type 2 DM i.e. vitamin E supplementation significantly improved the glycaemic control, possibly by minimizing the free radical damage to the pancreatic β-cells [7, 8] [Table/Fig-7]. Another study which use the obese Zucker rat, an animal that exhibits many of the features of type 2 DM showed improvements in glucose metabolism and insulin action by addition of vitamin E that was mediated by a reduction in oxidative stress. They found that glucose-stimulated hyper-insulinemia and lipid peroxidation in the obese Zucker rats could be significantly reduced with the dietary vitamin E source [9].
α-Lipoic acid, an essential cofactor of alpha-oxoacid dehydrogenase complexes, is also a potent lipophilic free radical scavenger. α-lipoic acid was found to increase the glucose transport in the muscle cells in the culture by stimulating the translocation of GLUT4 from the internal pools to the plasma membrane [10]. In cultured adipocytes, treatment with ALA protected the insulin receptor from oxidative damage, maintaining its functional integrity. Konrad et al. (2001) [11] used cell cultures which consisting of different isoforms of p38 MAPK (p38 mitogen-activated protein kinase) in L6 GLUT4myc myotubes. They demonstrated that α-lipoic acid was able to increase the plasma membrane content of GLUT4 and stimulate the glucose uptake in the L6 GLUT4myc myotubes to a similar extent as insulin. They further suggested that α-lipoic acid stimulates glucose uptake by translocating and regulating the intrinsic activity of GLUT4. They concluded that α-Lipoic acid enhanced glucose uptake and GLUT4 translocation in L6 myotubes, mimicking insulin action.
Ingestion of PUFA-rich diets which were particularly enriched in omega-3 fatty acids, has been shown to have anti-obesity effects [12] and to facilitate the insulin action [13] through a number of metabolic effects. Ingestion of both omega-6 and omega-3 fatty acids has been demonstrated to suppress hepatic lipogenesis [14], reduce the hepatic output of triglycerides, enhance ketogenesis [15], and induce fatty acid oxidation in both the liver and the skeletal muscle [16]. Insulin sensitivity may improve as a result of the effects of fatty acid intake on membrane fluidity [17].
Summary and Conclusions
The present study was designed to evaluate and compare the effect of supplementation of antioxidants alpha-lipoic acid, omega three fatty acids and vitamin E in patients of type 2 diabetes mellitus. 104 patients were recruited out of which 94 patients completed the study successfully.
Alpha-lipoic acid, Omega 3 and Vitamin E showed a significant reduction in parameters of oxidative stress and insulin resistance as compared to placebo. There was also a significant reduction in the levels of TC. The treatment with vitamin E showed the maximum improvement in parameters of lipid metabolism. In intergroup analysis at V5, ALA, omega 3 fatty acid and vitamin E showed the significant improvement in total cholesterol as compared to placebo and the vitamin E showed the maximum improvement.
The results of this study demonstrate that antioxidants alpha-lipoic acid, omega 3 fatty acids and vitamin E may be used in patients with type 2 diabetes mellitus. Also since the antioxidants differed in their effects on parameters of insulin sensitivity and lipid metabolism, combining these drugs might prove as an attractive option in patients with type 2 diabetes mellitus.
[1]. Powers AC, Kasper DL, Brounwald E, Fauci AS, Harrisons Principle of Internal Medicine 2005 16th Edi.Mc Graw Hill Publishers:2152-79. [Google Scholar]
[2]. Park K, Text Book of Preventive and Social Medicine 2006 18th EdiBhanot Publishers:341-45. [Google Scholar]
[3]. Nathan DM, Singer DE, Hurxthal K, Goodson JD, The Clinical Information Value Of The Glycosylated Haemoglobin AssayN Eng J Med 1984 310:341-46. [Google Scholar]
[4]. Cao G, Booth SL, Sadowski JA, Prior RL, Increase in human plasma antioxidant capacity after consumption of controlled diets high in fruits and vegetablesAm J Clin Nutr 1998 68:1081-87. [Google Scholar]
[5]. Paolisso G, Esposito R, Dalessio MA, Barbieri M, Primary and secondary prevention of atherosclerosis : Is there a role for antioxidants?Diabetes Metab 1999 25:298-306. [Google Scholar]
[6]. Rodney C, Roger B, Use of antioxidant nutrients in the prevention and treatment of type 2 diabetesJ of Am Coll Nutr 2001 20:363-69. [Google Scholar]
[7]. Ihara Y, Toyokuni S, Uchida K, Hyperglycemia causes oxidative stress in pancreatic β cells of GK rats, a model of type 2 diabetesDiabetes 1999 48:927-32. [Google Scholar]
[8]. Ihara Y, Yamada Y, Toyokuni S, Miyawaki K, Antioxidant alpha tocopherol ameliorates glycaemic control of GK rats, a model of type 2 diabetesFEBS Lett. 2000 473:24-26. [Google Scholar]
[9]. Laight DW, Desai KM, Gopaul NK, F2- isoprostane evidence of oxidative stress in the insulin resistant, obese Zucker rat: Effects of vitamin EEur J Pharmacol. 1999 377:89-92. [Google Scholar]
[10]. Jacob S, Russ P, Hermann R, Oral administration of RAC-alpha-lipoic acid modulates insulin sensitivity in patients with type 2 diabetes mellitus: A placebo controlled pilot trialRadical Biol And Med 1999 27:309-14. [Google Scholar]
[11]. Konrad D, Somwar R, Sweeney G, Yaworsky K, Hayashi M, Ramlal T, The antihyperglycaemic drug alpha lipoic acid stimulates glucose uptake via both GLUT4 translocation and GLUT4 activation: Potential role of p38 mitogen activated protein kinase in GLUT4 activationDiabetes 2001 50:1464-71. [Google Scholar]
[12]. Mori TA, Vandongen R, Rouse IL, Dunbar D, Comparison of diets supplemented with fish oil or olive oil on plasma lipoproteins in insulin dependent diabeticsMetabolism 1991 40:241-46. [Google Scholar]
[13]. Lovejoy JC, The influence of dietary fat on insulin resistanceCurr Diab Rep 2002 2:435-40. [Google Scholar]
[14]. Jump DB, Clarke SD, Regulation of gene expression by dietary fatAnnu Rev Nutri 1999 19:63-90. [Google Scholar]
[15]. Berge RK, Madsen L, Vaagenes H, Hypolipidemic 3-thia fatty acids: fatty acid oxidation and ketogenesis in rat liver under proliferation of mitochondria and peroxisomesAdv Exp Med Biol 1999 466:125-32. [Google Scholar]
[16]. Thomassen MS, Christiansen EN, Norum KR, Characterization of the stimulatory effect of high fat diets on peroxisomal beta oxidation in rat liverBiochem Jr. 1982 206:195-202. [Google Scholar]
[17]. Podolin DA, Gayles EC, Wei Y, Menhaden. Oil prevents but does not reverse sucrose induced insulin resistance in ratsAm J Physiol. 1998 274:840-48. [Google Scholar]