The GIC is a self-adhesive restorative material that chemically combines fluoro-aluminosilicate glass powder with polyacrylic acid liquid. It has a wide range of applications in both adult and paediatric dentistry and is known for its strong anti-cariogenic properties. Fluoride, a key component, is an effective anti-cariogenic agent that helps reduce the risk of dental caries. Fluoride works by inhibiting the formation of the pellicle, suppressing microbial growth and metabolism and enhancing the remineralisation of tooth enamel [1]. The release of fluoride is a crucial factor in the efficacy of GICs, as it aids in preventing secondary caries and promoting the remineralisation of tooth structure. While conventional GICs are well-regarded for their ability to release fluoride over time, supporting oral health and reducing cavities, they have limitations in terms of fluoride release rates and long-term durability [2,3]. Over the years, manufacturers have modified the composition of GICs to improve their properties [4]. The development of nano-formulated GICs represents a significant step forward in dental material technology. By incorporating nanotechnology, these advanced formulations are designed to enhance fluoride release over an extended period, improve mechanical properties and increase the overall durability of the material [5]. Nano-sized particles are thought to provide better integration with the tooth structure and enable more controlled fluoride release, potentially overcoming some of the limitations seen with conventional GICs [6]. As a result, nano-formulated GICs have emerged as a new category of materials, offering enhanced features, particularly in terms of fluoride release, compared to traditional GICs.
Plants have been used for medicinal purposes for centuries, a practice that persisted until the rise of modern chemistry in the 16th century. Phytomedicine, which involves the use of plant extracts and compounds, is considered to be minimally toxic [7]. To mitigate potential risks, green-mediated nanoparticles have been synthesised. Understanding the differences between these materials is essential for optimising restorative treatments and improving patient outcomes in clinical settings [8]. Recent studies have shown that incorporating nanoceramics, such as Hydroxyapatite (HA) and Zirconia (ZrO2), synthesised using various soft chemistry methods to produce nanoscale particles, can enhance the properties of GIC [9,10]. More recently, combinations of nano-sized zirconia (ZrO2) and HA-ZrO2 have been explored to further strengthen GIC [11]. Zirconium and its oxide are known for their dimensional stability and toughness, comparable to stainless steel, making them useful for reinforcing brittle HA bio-glasses in biomedical applications [12]. Recent studies on HA-SiO2-ZrO2-enhanced GIC and Ch-Ti-Zr-HA-modified GIC have shown promising improvements in hardness [13] and color stability [14], though fluoride release remains a topic of concern. This large-scale comparative analysis aimed to evaluate the fluoride release capacity of green-mediated nano-formulated GICs in comparison to conventional GICs. The null hypothesis for the present study is that the nano-formulated GICs would not have a significant impact on fluoride release when compared to conventional GICs.
Materials and Methods
The present in-vitro study was conducted at the Department of Pedodontics, Saveetha Dental College and Hospitals, Saveetha Institute of Medical and Technical Sciences, Saveetha University, Chennai, Tamil Nadu, India. The study aimed to assess the fluoride-releasing properties of nano-formulated and conventional GICs. It was conducted over a period of one month, in May 2024. Ethical approval for the study was granted by the Institutional Review Board (IRB) under letter number (SRB/SDC/UG-1994/24/PEDO/331).
Inclusion and Exclusion criteria: The inclusion criteria for the study required the use of high-quality GIC samples, both conventional and nano-modified, in disk shape with uniform dimensions of 5 mm in diameter and 2 mm in thickness. The specimens were free from any visible defects such as cracks or porosities. The exclusion criteria included samples that displayed irregularities such as cracks, voids, or other defects during specimen preparation, or any contamination that could affect fluoride release. Additionally, any samples not adhering to the standard mixing procedures were excluded from the study to ensure consistency in the results.
Sample size calculation: Sample size estimation was performed using the GPower sample power calculator, which determined that a minimum of 30 samples per group would be required to achieve a 95% confidence interval and sufficient statistical power. This sample size was chosen to ensure robust data collection and to minimise the risk of statistical errors. Each group included three different concentrations of nano-modified GIC (3%, 5% and 10%), along with a control group of conventional GIC, ensuring that the study’s findings would be statistically significant.
Study Procedure
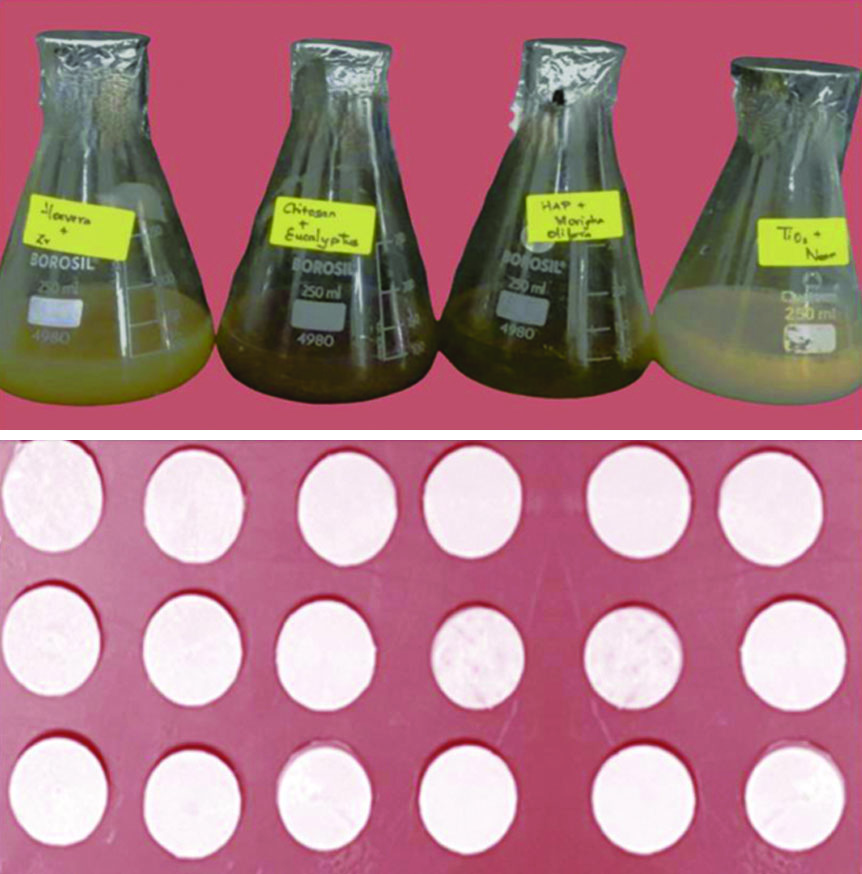
Preparations of nanoparticles: To produce plant-derived nanoparticles, 50 mL of 1 g of eucalyptus was blended with 50 mL of 0.5 g of chitosan (dissolved in 0.5 g of glacial acetic acid and 49 mL of water) to yield chitosan nanoparticles [14]. For titanium oxide nanoparticles, 50 mL of 1 g of neem extract was mixed with 50 mL of 50 mM TiO2 [15]. To make zirconium oxide nanoparticles, 50 mL of Aloe vera was combined with 50 mL of 20 mM zirconium oxide and heated overnight at 340-350°C [16]. A solution containing 50 mL of 1 g of Moringa oleifera was stirred with 50 mL of 0.1 g of hydroxyapatite (from eggshells) and orthophosphoric acid was added to maintain a 1.67 Ca/P ratio. Following centrifugation, the precipitate was subjected to calcination at 900°C to generate hydroxyapatite nanoparticles [14,17]. Using the one-pot synthesis method described by Rehman IA et al., the four solutions (Chitosan, Titanium, Zirconium and Hydroxyapatite) were combined, stirred at 80°C for 30 minutes, then treated with 1.08 mL of ethanol and refluxed for 90 minutes [18]. The mixture was then heated at 80°C for an additional 30 minutes to remove the ethanol, lyophilised at -92°C for 48 hours and powdered to obtain stable nanocomposites with preserved biochemical properties.
Preparation of Nano-modified GIC: The final nanocomposite solutions (Chitosan, Titanium, Zirconium and Hydroxyapatite) were incorporated into the powder component of GIC at concentrations of 3%, 5% and 10%, based on the methodology outlined in a previous study by Valanezhad A et al., categorised as Group I, Group II and Group III, respectively, with Group IV serving as the control (conventional GIC) [19]. The powder components were then mixed with a polyacrylic acid-based liquid to form the restorative cement.
Specimen preparation and parameters studied: For each group, 30 disc-shaped samples were prepared. Nanocomposite (Chitosan, Titanium, Zirconia, Hydroxyapatite) was added to glass ionomer powder at concentrations of 3%, 5% and 10%. The mixture was blended with the GIC liquid component (GC Corporation) using a plastic spatula until smooth. The paste was then placed in a metal mold with a diameter of 5 mm and a thickness of 2 mm. After setting, the samples were checked for porosity or cracks, finished, polished and stored at 37°C [Table/Fig-1].
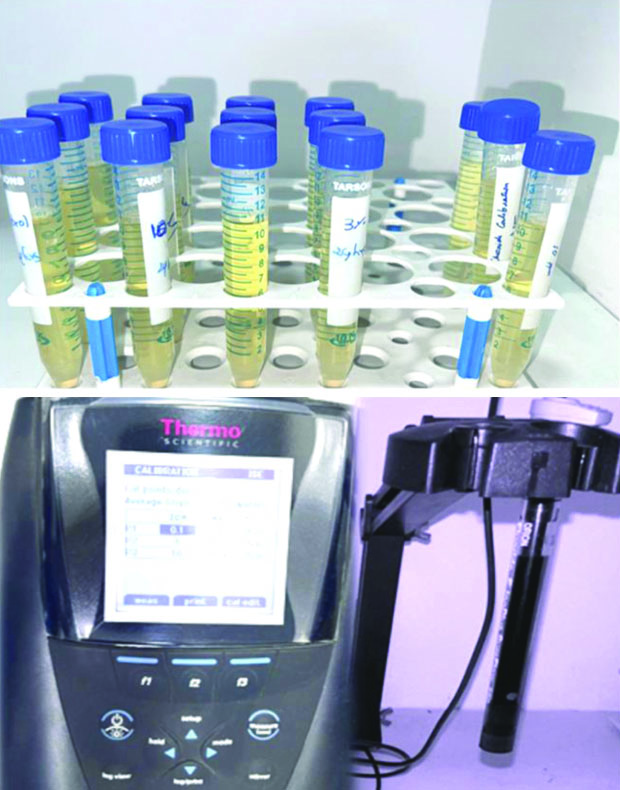
A total of 10 mL of deionised water was poured into test tubes and the nanoformulated specimens (3%, 5% and 10%) as well as the unmodified specimen (control group) were immersed. The deionised water in each test tube was replaced after the 1st, 3rd, 7th, 14th and 28th days. Equal volumes of Total Ionic Strength Adjustment Buffer (TISAB III) were added to maintain the solution at a pH of 5.0, providing an ionic background and facilitating the decomplexation of fluoride.
A fluoride Ion-Selective Electrode (ISE) (Orion Star™ A214 pH/ISE Meter) was employed to measure the release of fluoride after the 1st, 3rd, 7th, 14th and 28th days [Table/Fig-2]. Analysis was carried out using a pre-calibrated ion analys Analysed er (calibrated to 0.20, 1.00, 2.00, 10.00, 20.00 and 100 ppm F containing a standard fluoride ion solution). The analysis was performed on the specified days after buffering the 10 mL test solutions with 1 mL of TISAB III (Total Ionic Strength Adjustment Buffer, Orion, MA, USA).
Assessment of fluoride release using ion selective electrode analyser.
Time-dependent variations in the fluoride release concentration were assessed. At each interval (1st, 3rd, 7th, 14th and 28th days), data on the total amount of fluoride (ppm) released were recorded and tabulated.
Statistical Analysis
Data were tabulated and analysed using Statistical Package for Social Sciences (SPSS) software version 22.0 (IBM Corp.). Statistical analysis was performed using Analysis of Variance (ANOVA) followed by Tukey’s Honestly Significant Difference (HSD) post-hoc test, with significance set at p-value <0.05.
Results
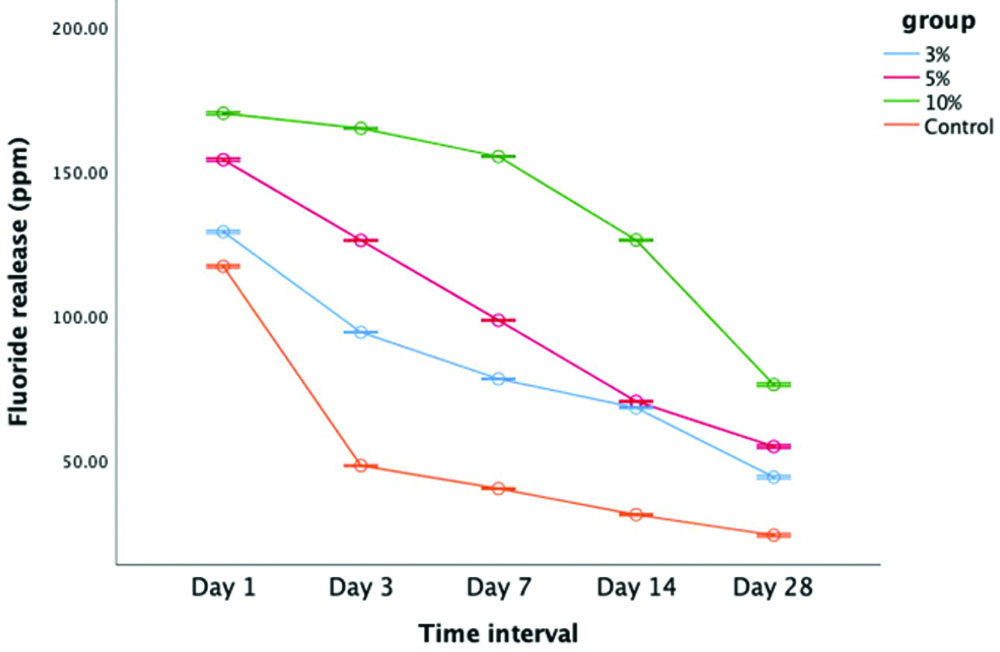
The fluoride ion release profiles for all groups were monitored over a 28-day period, with measurements taken at five specific intervals. The fluoride release was quantified in parts per million (ppm). A comparison of the data revealed that the nano-formulated GIC released significantly higher amounts of fluoride compared to the conventional GIC (control group) (p-value <0.05) [Table/Fig-3]. The highest fluoride release occurred on the first day for all groups, followed by a gradual decline in fluoride levels over the 28-day period [Table/Fig-4]. Among the various concentrations tested, the 10% nano-formulated GIC exhibited the highest fluoride release at all time points throughout the study [Table/Fig-5]. The pair-wise comparison further highlighted that Group III (10%) consistently released significantly more fluoride than the other groups. In contrast, the control group, which used conventional GIC, showed the lowest fluoride release levels across all intervals [Table/Fig-6]. Additionally, statistical analysis demonstrated that all the differences across the groups for each concentration and time point were significant, as indicated by the p-values (0.001*), suggesting that fluoride release varied significantly over time in each group [Table/Fig-7]. These findings suggest that the incorporation of nanocomposites into GIC enhances fluoride release, potentially offering greater long-term therapeutic benefits compared to traditional GIC formulations.
Overall comparison of fluoride release for nano-formulated GIC and conventional GIC.
| Groups | Days (Mean±SD) ppm |
|---|
| Day 1 | Day 3 | Day 7 | Day 14 | Day 28 |
|---|
| 3% | 129.04±0.146 | 94.28±0.194 | 78.16±0.149 | 68.15±0.151 | 44.18±0.183 |
| 5% | 153.96±1.015 | 126.10±0.109 | 98.430±0.408 | 70.36±0.512 | 54.75±1.172 |
| 10% | 170.03±0.512 | 164.83±0.427 | 155.10±0.275 | 126.20±0.309 | 76.16±0.107 |
| Control | 117.11±0.098 | 48.13±0.073 | 40.18±0.164 | 31.15±0.204 | 24.05±0.151 |
| p-value amongst groups | 0.001* | 0.001* | 0.001* | 0.001* | 0.001* |
*statistically significant value of p<0.05; SD: Standard deviation; p-value was derived from One-way ANOVA test
Comparison of fluoride releasing capacity within the group-based on time interval.
| Groups | Time interval (day) | Mean±SD | Std. Error | 95% CI | p-value |
|---|
| Lower bound | Upper bound |
|---|
| 3% | Day 1 | 129.045±0.146 | 0.059 | 128.891 | 129.198 | 0.001* |
| Day 3 | 94.283±0.194 | 0.079 | 94.079 | 94.487 |
| Day 7 | 78.161±0.149 | 0.061 | 78.004 | 78.318 |
| Day 14 | 68.150±0.151 | 0.061 | 67.990 | 68.309 |
| Day 28 | 44.183±0.183 | 0.074 | 43.990 | 44.375 |
| 5% | Day 1 | 153.966±1.015 | 0.414 | 152.901 | 155.032 | 0.001* |
| Day 3 | 126.100±0.109 | 0.044 | 125.985 | 126.215 |
| Day 7 | 98.433±0.408 | 0.166 | 98.004 | 98.861 |
| Day 14 | 70.366±0.512 | 0.209 | 69.828 | 70.904 |
| Day 28 | 54.750±1.172 | 0.478 | 53.519 | 55.980 | 10% |
| Day 1 | 170.033±0.512 | 0.209 | 169.495 | 170.571 | 0.001* |
| Day 3 | 164.833±0.427 | 0.174 | 164.384 | 165.281 |
| Day 7 | 155.100±0.275 | 0.112 | 154.810 | 155.389 |
| Day 14 | 126.200±0.309 | 0.126 | 125.874 | 126.525 |
| Day 28 | 76.166±0.107 | 0.044 | 76.053 | 76.279 |
| Control | Day 1 | 117.116±0.098 | 0.040 | 117.013 | 117.219 | 0.001* |
| Day 3 | 48.135±0.073 | 0.030 | 48.057 | 48.212 |
| Day 7 | 40.186±0.164 | 0.066 | 40.014 | 40.358 |
| Day 14 | 31.151±0.204 | 0.083 | 30.937 | 31.366 |
| Day 28 | 24.051±0.151 | 0.061 | 23.893 | 24.210 |
*statistically significant value of p<0.05; SD: Standard deviation; p-value was derived from One-way ANOVA test
Fluoride release of nano-formulated GIC and conventional GIC over time.
Pair-wise comparison of fluoride release among nano-modified groups and control group.
| Time interval | Time interval (day) | MD | SE | 95% Confidence interval | p-value |
|---|
| Lower bound | Upper bound |
|---|
| Day 1 | 3% vs 5% | -24.921 | 0.332 | -25.85 | -23.99 | 0.001* |
| 3% vs 10% | -40.988 | 0.332 | -41.91 | -40.05 | 0.001* |
| 3% vs control | 11.928 | 0.332 | 10.99 | 12.85 | 0.001* |
| 5% vs 10% | -16.066 | 0.332 | -16.99 | -15.13 | 0.001* |
| 5% vs control | 36.850 | 0.332 | 35.92 | 37.77 | 0.001* |
| 10% vs control | 52.916 | 0.332 | 51.98 | 53.84 | 0.001* |
| Day 3 | 3% vs 5% | -31.816 | 0.140 | -32.21 | -31.42 | 0.001* |
| 3% vs 10% | -70.550 | 0.140 | -70.94 | -70.15 | 0.001* |
| 3% vs control | 46.1483 | 0.140 | 45.75 | 46.54 | 0.001* |
| 5% vs 10% | -38.733 | 0.140 | -39.12 | -38.33 | 0.001* |
| 5% vs control | 77.965 | 0.140 | 77.57 | 78.35 | 0.001* |
| 10% vs control | 116.698 | 0.140 | 116.30 | 117.09 | 0.001* |
| Day 7 | 3% vs 5% | -20.271 | 0.155 | -20.70 | -19.83 | 0.001* |
| 3% vs 10% | -76.938 | 0.155 | -77.37 | -76.50 | 0.001* |
| 3% vs control | 37.975 | 0.155 | 37.53 | 38.41 | 0.001* |
| 5% vs 10% | -56.666 | 0.155 | -57.10 | -56.23 | 0.001* |
| 5% vs control | 58.246 | 0.155 | 57.81 | 58.68 | 0.001* |
| 10% vs control | 114.913 | 0.155 | 114.47 | 115.34 | 0.001* |
| Day 14 | 3% vs 5% | -2.216 | 0.187 | -2.74 | -1.69 | 0.001* |
| 3% vs 10% | -58.050 | 0.187 | -58.57 | -57.52 | 0.001* |
| 3% vs control | 36.998 | 0.187 | 36.47 | 37.52 | 0.001* |
| 5% vs 10% | -55.833 | 0.187 | -56.35 | -55.30 | 0.001* |
| 5% vs control | 39.215 | 0.187 | 38.68 | 39.74 | 0.001* |
| 10% vs control | 95.048 | 0.187 | 94.52 | 95.57 | 0.001* |
| Day 28 | 3% vs 5% | -10.566 | 0.346 | -11.53 | -9.59 | 0.001* |
| 3% vs 10% | -31.983 | 0.346 | -32.95 | -31.01 | 0.001* |
| 3% vs control | 20.131 | 0.346 | 19.16 | 21.10 | 0.001* |
| 5% vs 10% | -21.416 | 0.346 | -22.38 | -20.44 | 0.001* |
| 5% vs control | 30.698 | 0.346 | 29.72 | 31.66 | 0.001* |
| 10% vs control | 52.115 | 0.346 | 51.14 | 53.08 | 0.001* |
*statistically significant value of p<0.05, MD: Mean difference; SE: Standard error; p-value was derived from multiple comparison Tukey HSD test10
Pair-wise comparison on time interval of fluoride releasing capacity for each group.
| Groups | Pair-wise comparison | MD | SE | 95% Confidence interval | p-value |
|---|
| Lower bound | Upper bound |
|---|
| 3% | Day 1 vs day 3 | 34.761 | 0.095 | 34.479 | 35.043 | 0.001* |
| Day 1 vs day 7 | 50.883 | 0.095 | 50.601 | 51.165 | 0.001* |
| Day 1 vs day 14 | 60.895 | 0.095 | 60.613 | 61.176 | 0.001* |
| Day 1 vs day 28 | 84.861 | 0.095 | 84.579 | 85.143 | 0.001* |
| Day 3 vs day 7 | 16.121 | 0.095 | 15.839 | 16.403 | 0.001* |
| Day 3 vs day 14 | 26.133 | 0.095 | 25.851 | 26.415 | 0.001* |
| Day 3 vs day 28 | 50.100 | 0.095 | 49.818 | 50.381 | 0.001* |
| Day 7 Vs day 14 | 10.011 | 0-095 | 9.729 | 10.293 | 0.001* |
| Day 7 vs day28 | 33.978 | 0.9595 | 33.696 | 34.260 | 0.001* |
| Day 14 vs day 28 | 23.966 | 0.095 | 23.684 | 24.248 | 0.001* |
| 5% | Day1 vs day 3 | 27.866 | 0.435 | 26.587 | 29.146 | 0.001* |
| Day 1 vs day 7 | 55.533 | 0.435 | 54.253 | 56.812 | 0.001* |
| Day 1 vs day 14 | 83.600 | 0.435 | 82.320 | 84.879 | 0.001* |
| Day 1 vs day 28 | 99.216 | 0.435 | 97.937 | 100.496 | 0.001* |
| Day 3 vs day 7 | 27.666 | 0.435 | 26.387 | 28.946 | 0.001* |
| Day 3 vs day 14 | 55.733 | 0.435 | 54.453 | 57.012 | 0.001* |
| Day 3 vs day 28 | 71.350 | 0.435 | 70.070 | 72.629 | 0.001* |
| Day 7 vs day 14 | 28.066 | 0.435 | 26.787 | 29.346 | 0.001* |
| Day 7 vs day 28 | 43.683 | 0.435 | 42.409 | 44.962 | 0.001* |
| Day 14 vs day 28 | 15.616 | 0.435 | 14.337 | 16.896 | 0.001* |
| 10% | Day1 vs day 3 | 5.200 | 0.204 | 4.598 | 5.801 | 0.001* |
| Day 1 vs day 7 | 14.933 | 0.204 | 14.332 | 15.534 | 0.001* |
| Day 1 vs day 14 | 43.833 | 0.204 | 43.232 | 44.434 | 0.001* |
| Day 1 vs day 28 | 93.866 | 0.204 | 93.265 | 94.468 | 0.001* |
| Day 3 vs day 7 | 9.733 | 0.204 | 9.132 | 10.334 | 0.001* |
| Day 3 vs day 14 | 38.633 | 0.204 | 38.032 | 39.234 | 0.001* |
| Day 3 vs day 28 | 88.666 | 0.204 | 88.065 | 89.268 | 0.001* |
| Day 7 vs day 14 | 28.900 | 0.204 | 28.298 | 29.501 | 0.001* |
| Day 7 vs day 28 | 78.933 | 0.204 | 78.332 | 79.534 | 0.001* |
| Day 14 vs day 28 | 50.033 | 0.204 | 49.432 | 50.634 | 0.001* |
| Control | Day1 vs day3 | 68.981 | 0.084 | 68.734 | 69.229 | 0.001* |
| Day 1 vs day 7 | 76.930 | 0.084 | 76.682 | 77.177 | 0.001* |
| Day 1 vs day 14 | 85.965 | 0.084 | 85.717 | 86.212 | 0.001* |
| Day 1 vs day 28 | 93.065 | 0.084 | 92.817 | 93.312 | 0.001* |
| Day 3 vs day 7 | 7.948 | 0.084 | 7.700 | 8.196 | 0.001* |
| Day 3 vs day 14 | 16.983 | 0.084 | 16.735 | 17.231 | 0.001* |
| Day 3 vs day 28 | 24.083 | 0.084 | 23.835 | 24.331 | 0.001* |
| Day 7 vs day 14 | 9.035 | 0.084 | 8.787 | 9.282 | 0.001* |
| Day 7 vs day 28 | 16.135 | 0.084 | 15.887 | 16.382 | 0.001* |
| Day 14 vs day 28 | 7.100 | 0.08433 | 6.852 | 7.347 | 0.001* |
*statistically significant value of p<0.05, MD: Mean difference; SE: Standard error; p-value was derived from multiple comparison Tukey HSD test
Discussion
In recent years, there has been growing interest in the fluoride-releasing properties of dental materials, especially GICs. Nano-formulated GICs have emerged as a promising alternative to traditional GICs, with claims of improved performance due to the integration of nanotechnology [20]. Conventional GICs have been widely recognised for their ability to release fluoride, which plays a key role in preventing secondary caries and aiding in the remineralisation of tooth structure. These materials gradually release fluoride ions over time, providing ongoing protection. However, the rate and total amount of fluoride release are often constrained by the formulation of the material and the physical properties of the glass particles used in the cement [21].
In contrast, nano-formulated GICs incorporate nanoparticles, typically on the scale of nanometers, to enhance the material’s performance [22]. These nanoparticles are thought to increase the surface area available for fluoride release, potentially improving both the rate of release and the duration of its effects. Studies suggest that nano-GICs may offer superior fluoride-releasing capabilities compared to conventional GICs, thanks to the more efficient distribution of fluoride within the material matrix [23,24].
Chitosan nanoparticles, commonly used as drug delivery agents, are favoured for their higher solubility, low toxicity and controlled release properties [25]. Titanium nanoparticles, known for their strength, light weight, excellent corrosion resistance and biocompatibility, make them valuable for various applications [26]. Additionally, the incorporation of zirconia and hydroxyapatite in GICs enhances not only their mechanical properties but also their biological activity [27].
In the present study, nano-formulated GIC demonstrated significantly higher fluoride release compared to conventional GIC, supporting the findings of several previous studies. Nishanthine C et al., reported that the addition of chitosan to the glass ionomer liquid accelerated its fluoride-releasing properties [28], a result that aligns with the findings of this study. Similarly, Patel A et al., observed that chitosan-modified Resin-Modified GIC (RMGIC) released more fluoride than conventional RMGIC after 15 and 30 days [29]. The results of the present study also corroborate the work of Senthil Kumar R et al., who found that nanochitosan-modified GIC exhibited higher fluoride release at one hour, 24 hours and seven days [30]. In accordance with this, Morales-Valenzuela AA et al., demonstrated that the incorporation of TiO2 nanoparticles enhanced fluoride release in glass ionomers, a finding consistent with our study [26]. Panigrahi A et al., reported that hydroxyapatite-incorporated GIC, like the one tested in the present study, effectively took up and released fluoride, similar to conventional GIC [31]. Additionally, Kukreja R et al., observed that while both conventional GIC and Zirconomer released fluoride, Zirconomer exhibited significantly higher fluoride release at all time intervals [32].
In the present study, the combination of all four nanoparticles tested at various concentrations resulted in the highest fluoride release on day 1. This rapid release is likely linked to the “burst phenomenon,” commonly observed in GICs, where a large amount of fluoride is released during the initial setting period [33]. This burst release is attributed to the setting reaction of GICs [34] and the results of the present study are in agreement with previous studies by Neelakantan P et al., who also reported high fluoride release during the first day. This initial surge in fluoride may have beneficial biological and bactericidal effects immediately after the restoration [35]. Following this initial release, a decline in fluoride release was observed during the first week, which then stabilised after approximately three weeks. This pattern of fluoride release is consistent with findings from other studies, all of which reported a similar trend, with GIC showing the highest fluoride release on the first day, followed by a gradual tapering off and stabilisation over several weeks [36-38].
There was a statistically significant difference in fluoride release among the groups, with the nano-formulated GIC showing the highest fluoride release. This increased fluoride release is likely due to its higher fluoride content and greater water uptake. The most substantial fluoride release occurred in the first week, with the highest rate of release observed within the first 24 hours. In contrast, conventional GIC released a relatively lower amount of fluoride, ranging from 20 to 50 ppm over the same period.
The fluoride release process is complex and influenced by various intrinsic and environmental factors, including the composition of the organic matrix and fillers, the method of manipulation, solubility, porosity, surface area and pH [39]. For all the samples tested, the fluoride release was highest on the first day, followed by a gradual decline in the subsequent days, stabilising by day 30. Fluoride release from GIC follows two main mechanisms: a rapid short-term release, where fluoride dissolves quickly from the surface and a sustained long-term release, driven by ionic diffusion. After the initial burst, fluoride release slows down, with a sustained release occurring over time. The overall amount of fluoride released in the short term is primarily controlled by diffusion, accompanied by a decreasing concentration gradient [40].
While the anticaries effect of fluoride has been well studied, there is no consensus in the literature on the minimum amount of fluoride release required to effectively prevent secondary caries. In the present study, ISE potentiometer devices were used to ensure that the fluoride analysis methods adhered to universal standards, offering an easily accessible and reliable means of detection.
Overall, the addition of nanofillers to GIC significantly accelerated fluoride release over the 30-day period. Among the different groups tested, the 10% nano-modified GIC consistently released the highest fluoride levels at all time intervals. The enhanced fluoride release from the inorganic matrix was facilitated by reinforced complexes, where polyacrylic acid adsorbed onto the Ch-Ti-Zr-HA nanoparticles, which then attached to the GIC particles. Materials with high fluoride release can be advantageous in preventing secondary caries. However, when comparing fluoride release between nano-formulated and conventional GICs, various factors need to be considered, including testing conditions, the presence of fillers, the type of acid used in the setting reaction and storage conditions.
In conclusion, both nano-formulated and conventional GICs offer distinct advantages in fluoride release, with nano-GICs potentially providing superior performance. Comparative studies like these are essential for optimising material choices in clinical applications, ensuring patients receive the most effective fluoride protection possible.
Limitation(s)
The present study was limited by its in-vitro design and therefore, the fluoride release behaviour observed may not fully replicate the complex conditions found in the oral environment, such as variations in temperature, pH and the presence of saliva. Additionally, the study only assessed fluoride release over a 28-day period, which may not fully capture long-term release patterns. Therefore, future clinical trials should evaluate the long-term fluoride release behaviour.
Conclusion(s)
The fluoride estimation results demonstrate that the 10% nano-formulated GIC exhibits a high fluoride release capacity. The present study clearly shows that incorporating nanoparticles enhances the fluoride-releasing properties of glass ionomer cements. Nanoparticles may modify the cement matrix structure, facilitating more efficient fluoride ion diffusion. Overall, the nano-formulated GIC proves to be more effective than conventional GIC. However, further in-vivo studies are required to confirm and validate these findings.
*statistically significant value of p<0.05; SD: Standard deviation; p-value was derived from One-way ANOVA test
*statistically significant value of p<0.05; SD: Standard deviation; p-value was derived from One-way ANOVA test
*statistically significant value of p<0.05, MD: Mean difference; SE: Standard error; p-value was derived from multiple comparison Tukey HSD test10
*statistically significant value of p<0.05, MD: Mean difference; SE: Standard error; p-value was derived from multiple comparison Tukey HSD test