An inadequacy of insulin, either inherited or acquired, causes DM, a chronic endocrine condition. If left untreated, this illness can lead to neuropathy, retinopathy, cardiovascular disease and other long-term effects [1,2]. Diabetes results in inadequate re-epithelialisation, chronic oxidative stress and inflammation, all of which disrupt the normal healing process and significantly slow down wound healing. Poor wound healing is associated with diabetes [3]. The World Health Organisation (WHO) and the American Diabetes Association (ADA) have classified type 1 and type 2 diabetes as distinct conditions based on the aetiological types and clinical phases of hyperglycaemia, or high blood glucose [4].
The ongoing search for novel treatment options that are safe, effective and have few side-effects has been prompted by the rising incidence of diabetes and its related problems. Natural products have attracted a lot of attention in this area because of their various bioactive components and medicinal uses. BA, a pentacyclic triterpenoid, is extracted from the bark of birch trees (Betula species) [7]. Triterpenoids have been linked to several biological activities, including antiviral, anticancer and anti-inflammatory properties [8].
Oxidative stress and inflammation play critical roles in the pathogenesis of diabetes and its complications. Persistent hyperglycaemia leads to the overproduction of Reactive Oxygen Species (ROS), which, in turn, causes oxidative damage to cellular components, including lipids, proteins and DNA [9]. This oxidative stress is a key factor in the development of diabetic complications such as neuropathy, nephropathy and retinopathy. Moreover, chronic inflammation, often exacerbated by hyperglycaemia, further contributes to the progression of diabetes-related complications [9]. BA has been shown to possess potent antioxidant and anti-inflammatory properties [10], making it a potential candidate for mitigating the oxidative and inflammatory damage associated with diabetes.
In-vitro studies provide a controlled environment to explore the mechanisms by which phytochemicals exert their effects on diabetes and its complications [2,11]. Such studies have revealed that phytochemicals can inhibit key enzymes involved in glucose metabolism, such as α-glucosidase and α-amylase, which are responsible for the breakdown of carbohydrates into glucose, thus reducing postprandial blood glucose levels [2,11]. Additionally, BA has been found to enhance the activity of antioxidant enzymes like Superoxide Dismutase (SOD) and catalase, which help in neutralising ROS and reducing oxidative stress [10]. Furthermore, BA has demonstrated the ability to modulate signalling pathways associated with inflammation, such as the Nuclear Factor kappa B (NF-κB) pathway, which is a central regulator of the inflammatory response. By inhibiting the activation of NF-κB, BA reduces the production of proinflammatory cytokines, thereby alleviating inflammation and potentially preventing the progression of diabetic complications [12]. Hence, the aim of the study was to assess the impact of BA on diabetes and its related consequences using in-vitro enzyme inhibitory assays and a cell line model.
Materials and Methods
The present in-vitro study was conducted at the Centre for Global Health Research, Saveetha Medical College and Hospitals, Chennai, Tamil Nadu, India from May 2024 to June 2024, after approval from the Scientific Review Board (SMC/R09/2024). BA was commercially purchased from Sigma Aldrich, USA (Product Code: 855057).
In-vitro α-amylase inhibitory assay: In-vitro α-amylase inhibition was studied using the method described by Bernfeld P (1955) [13]. In brief, 100 μL of BA (5, 10, 20, 40, 60, 80 and 100 μM) was allowed to react with 200 μL of α-amylase enzyme and 100 μL of 2 mM phosphate buffer (pH 6.9). After a 20-minute incubation, 100 μL of 1% starch solution was added. The same procedure was performed for the controls, in which 200 μL of the enzyme was replaced with phosphate buffer. After an incubation of five minutes, 500 μL of dinitrosalicylic acid reagent was added to both the control and the test samples. They were placed in a boiling water bath for five minutes. The absorbance was recorded at 540 nm using a spectrophotometer and the percentage inhibition of the α-amylase enzyme was calculated using the formula:
% inhibition={(Control-Test)/Control}*100
α-glucosidase inhibitory activity: The α-glucosidase inhibition was evaluated using the method previously reported by Sancheti S et al., with minor modifications. The reaction mixture consisted of 50 μL of 0.1 M phosphate buffer, 25 μL of 0.5 mM 4-nitrophenyl α-D-glucopyranoside, 10 μL of BA at concentrations of 5, 10, 20, 40, 60, 80 and 100 μM and 25 μL of α-glucosidase solution (0.1 Unit/mL). The mixture was incubated at 37°C for 30 minutes. A total of 100 μL of 0.2 M sodium carbonate solution was then added to terminate the reaction. The amount of p-nitrophenol released in the reaction mixture was measured at 410 nm using a microplate reader. The background absorbance was corrected with a blank using the buffer alone. Controls used were methanol without BA, while acarbose served as a positive control. Experiments were conducted in triplicates [14].
In-vitro antiglycation assay: To determine the effect on in-vitro glycation of protein, 500 μL of albumin (1 mg/mL) was incubated with 400 μL of glucose (500 mM) in the presence of 100 μL of BA at concentrations of 5, 10, 20, 40, 60, 80 and 100 μM. The reaction was allowed to proceed at 60°C for 24 hours, after which 10 μL of 100% TCA was added to stop the reaction. The mixture was then centrifuged at 10,000 g. The precipitate obtained was dissolved in 500 μL of alkaline Phosphate-Buffered Saline (PBS) (pH 10) and the fluorescence was measured at 370 nm (excitation) and 440 nm (emission). Aminoguanidine served as a positive control [15].
Determination of Aldose Reductase (AR) inhibition: A total of 531μL of 0.1 M potassium buffer (pH 7.0), 90 μL of NADPH solution, 90 μL of recombinant human AR (6.5 U/mg) (Sigma, USA - SRP6371-100UG), 90 μL of ammonium sulphate solution and 90 μL of DL-glyceraldehyde were mixed with 9 μL of BA (5, 10, 20, 40, 60, 80 and 100 μM) in a cuvette and the activity of AR was assessed spectrophotometrically by measuring the decrease in NADPH absorbance at 340 nm for three minutes using a spectrophotometer (Biotek Synergy H4 multimode reader, USA). Metformin was used as positive control. The percentage inhibition of AR was calculated using the following equation: {1-(ΔA sample/min)-(ΔA blank/min)/(ΔA control/min)-(ΔA blank/min)}×100%, where ΔA sample/min is the decrease in absorbance over three minutes with reaction solution, test sample and substrate and ΔA control/min without the test sample [16].
Cell line and maintenance: Rat skeletal muscle cell lines, L6 myoblasts, purchased from the National Centre for Cell Sciences, Pune, were cultured at 37°C in a 5% CO2 environment in DMEM supplemented with 10% Foetal Bovine Serum (FBS) and 10% antibiotic-antimycotic mix. The density of cells cultivated in each well was 1×10⁵ cells. The cells were maintained for 5-7 days in differentiation media with 2% foetal bovine serum to facilitate differentiation.
Cellular glucose uptake assay – 2-(7-Nitrobenz-2-oxa-1,3-diazol-4-yl) amino-2-deoxy-D-glucose (2-NBDG) fluorescence method: Serum-free (SF) medium was used to starve the fully differentiated L6 myotubes for 1.5 hours, after which they were treated with BA in SF medium for 24 hours. The glucose uptake assay was initiated by adding 2-NBDG. The treated cells were incubated with 100 mM 2-NBDG in the dark for one hour. All treatment groups, except for the untreated control group, received 10-minute insulin pulses after one hour. Following two rounds of cold PBS washing, the cells’ fluorescence was measured using a confocal microscope (Nikon Inverted Microscope, Japan) fitted with filters that had FITC-range excitation and emission wavelengths of 490 and 525 nm, respectively [17].
Statistical Analysis
GraphPad Prism (Version 7) was used to examine the data. The IC50 values were extracted from the linear regression plots and the findings were reported as Mean±SEM. To evaluate mean differences at the p<0.001 level of significance, a two-way Analysis of Variance (ANOVA) was employed. The Holm-Sidak test was used to compare the means with standard groups.
Results
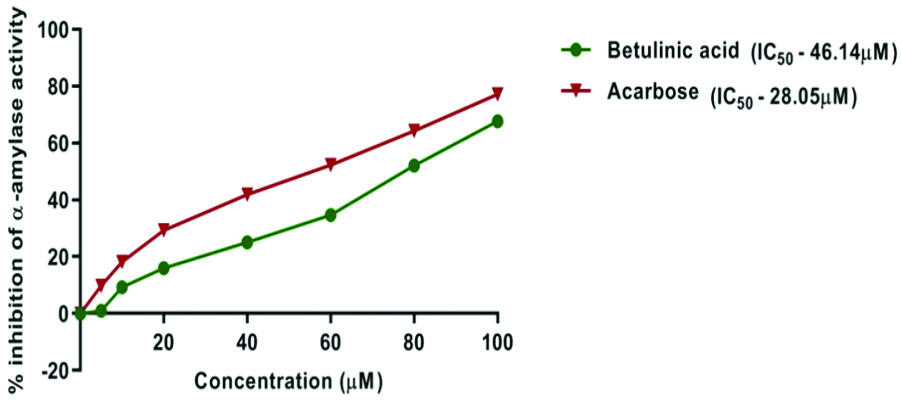
Effect of BA on α-amylase activity: BA and acarbose demonstrated a dose-dependent inhibitory effect on α-amylase activity. Acarbose exhibited a stronger inhibitory potential compared to BA, with an IC50 value of 28.05 μM, whereas BA had an IC50 value of 46.14 μM. At the highest concentration (100 μM), BA showed 67.64±0.06% inhibition of α-amylase activity, compared to acarbose, which showed 77.14±0.09% inhibition [Table/Fig-1,2].
Effect of Betulinic Acid (BA) on carbohydrate hydrolysing enzymes and enzymes involved in diabetes associated complications. Results are expressed in terms of Mean±SEM (n=3).
| Concentration (μM) | % inhibition of α-amylase | % inhibition of α-glucosidase | % inhibition of aldolase reductase | % inhibition of advanced glycation end products |
|---|
| Betulinic acid | Acarbose | Betulinic acid | Acarbose | Betulinic acid | Metformin | Betulinic acid | Amino guanidine |
|---|
| Control | -0.030±0.21 | -0.030±0.21 | 0.02±0.28 | 0.02±0.28 | -0.08±0.33 | -0.08±0.33 | -0.09±0.18 | -0.09±0.18 |
| 5 | 0.92±0.02** | 9.72±0.09 | 7.90±0.02 | 11.82±0.06 | 1.34±0.01 | 3.08±0.07 | 2.67±0.01 | 5.28±0.01 |
| 10 | 9.22±0.11** | 18.10±0.04 | 11.85±0.01** | 17.12±0.06 | 7.16±0.05* | 4.74±0.08 | 6.27±0.08** | 10.28±0.02 |
| 20 | 15.97±0.05** | 29.25±0.12 | 17.18±0.05** | 24.84±0.04 | 10.71±0.06 | 10.86±0.05 | 13.29±0.05 | 11.20±0.08 |
| 40 | 25.10±0.04** | 41.81±0.11 | 33.18±0.06 | 35.75±0.04 | 22.51±0.04 | 21.76±0.08 | 21.38±0.09* | 25.39±0.02 |
| 60 | 34.61±0.08** | 52.29±0.07 | 44.88±0.14*** | 60.23±0.03 | 32.64±0.05** | 38.60±0.01 | 35.30±0.01* | 39.28±0.01 |
| 80 | 52.01±0.04** | 64.21±0.04 | 56.56±0.07*** | 70.55±0.08 | 43.54±0.04** | 56.33±0.02 | 52.77±0.02** | 58.38±0.03 |
| 100 | 67.64±0.06** | 77.14±0.09 | 74.02±0.05** | 80.91±0.13 | 69.97±0.04* | 76.75±0.05 | 71.28±0.06* | 79.24±0.07 |
Results were presented as Mean±SEM (n=3). Differences between Means of Control Vs various concentrations were evaluated using two-way ANOVA, followed by Holm-sidak post-hoc analysis. Statistical significance was indicated as ***p<0.001, **p<0.01, *p<0.05 compared to control group
Graph showing percentage inhibition of alpha amylase activity of Betulinic Acid (BA) and acarbose (control) in different concentrations.
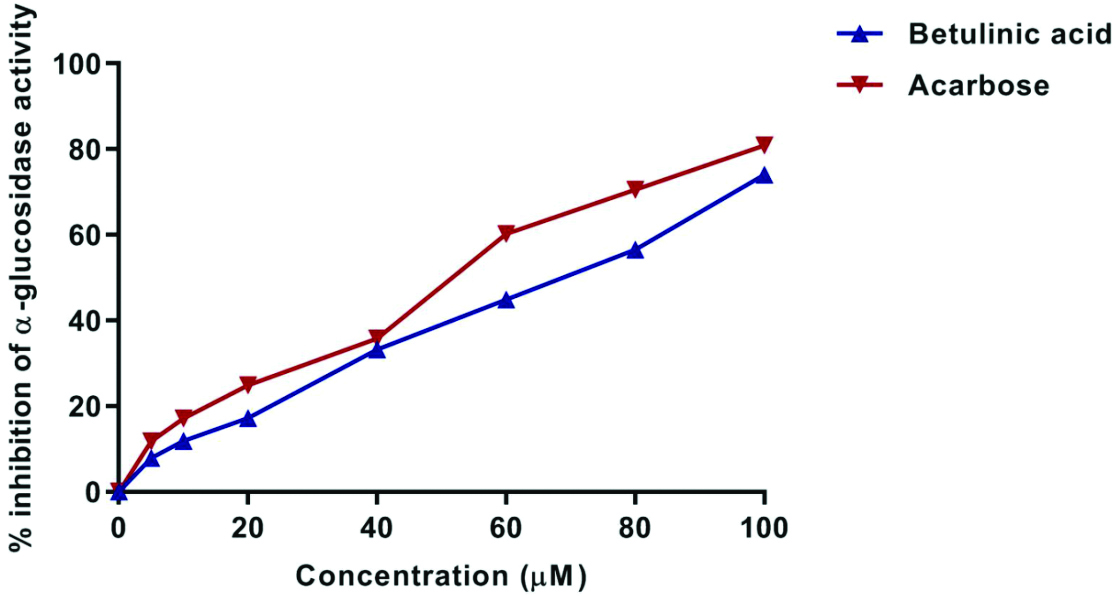
Effect of BA on α-glucosidase activity: The inhibition of α-glucosidase activity by BA and acarbose over the same concentration range (0-100 μM) showed a progressive increase in inhibition with increasing concentration. At the highest concentration (100 μM), BA exhibited 74.02±0.05% α-glucosidase inhibitory activity, compared to acarbose, which had an 80.91±0.13% inhibition [Table/Fig-1,3].
Graph showing percentage inhibition of alpha glucosidase activity of Betulinic Acid (BA) and acarbose in different concentrations.
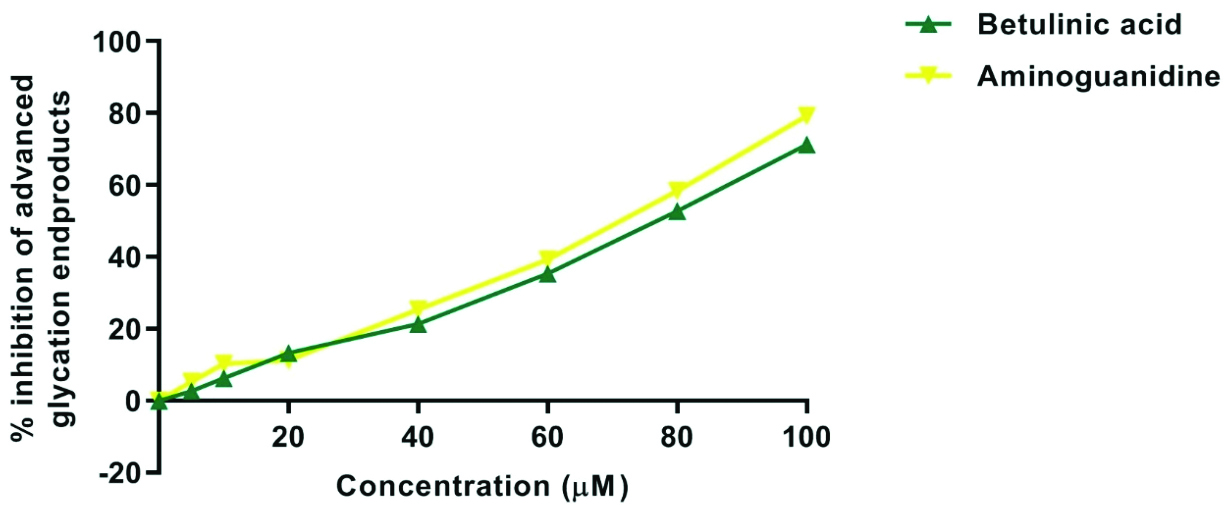
Effect of BA on AGE formation: The inhibitory effect of BA and aminoguanidine on AGE formation across various concentrations (0-100 μM) exhibited concentration-dependent inhibition, with aminoguanidine displaying slightly stronger inhibition across all concentrations. At the highest concentration (100 μM), BA showed 71.28±0.06% inhibition of AGE compared to aminoguanidine, which exhibited 79.24±0.07% inhibition [Table/Fig-1,4].
Graph showing percentage inhibition of aldolase reductase of Betulinic Acid (BA) and aminoguanidine in different concentrations.
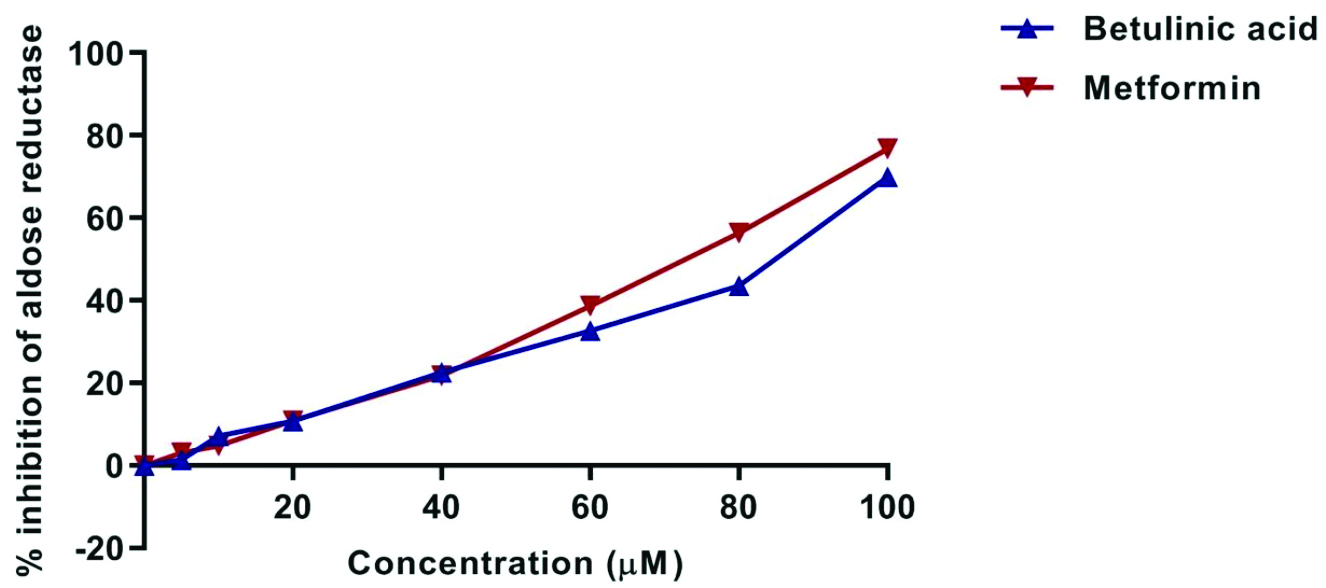
Effect of BA on Aldose reductase activity: The inhibitory effects of BA and metformin on AR activity were assessed and the results are presented in [Table/Fig-1,5]. Both BA and metformin exhibited dose-dependent inhibition of AR. At lower concentrations (up to 40 μM), the inhibition curves of the two compounds were nearly identical, suggesting similar inhibitory efficacy at these levels. However, as the concentration increased, metformin showed superior inhibition compared to BA. Despite this difference, BA demonstrated considerable inhibitory capacity, indicating its potential as an AR inhibitor, albeit slightly less potent than metformin at higher concentrations. At the highest tested concentration (100 μM), BA showed 69.97±0.04% inhibition of AR activity compared to metformin, which had a 76.75±0.05% inhibition.
Graph showing percentage inhibition of Aldose Reductase (AR) of Betulinic Acid (BA) and metformin (control) in different concentrations.
Effect of BA on cellular glucose uptake: The table and bar graph present the percentage of 2-NBDG glucose uptake under different treatments. Metformin (50 μM) showed the highest glucose uptake at 86.81±0.31%, which was significantly greater than the control. BA demonstrated an increase in glucose uptake in a dose-dependent manner, with the 92 μM concentration exhibiting a glucose uptake of 75.32±0.73% compared to metformin. The lower concentrations of BA (23 μM and 46 μM) also significantly increased glucose uptake [Table/Fig-6,7].
Graph representing the effect of Betulinic Acid (BA) on cellular glucose uptake Results were presented as Mean±SEM (n=3). Differences between Means of Control Vs other treatment groups were evaluated using one-way ANOVA, followed by Tukey’s post-hoc analysis. Statistical significance was indicated as ###; ***p<0.001 for metformin and Betulinic acid respectively compared to control.
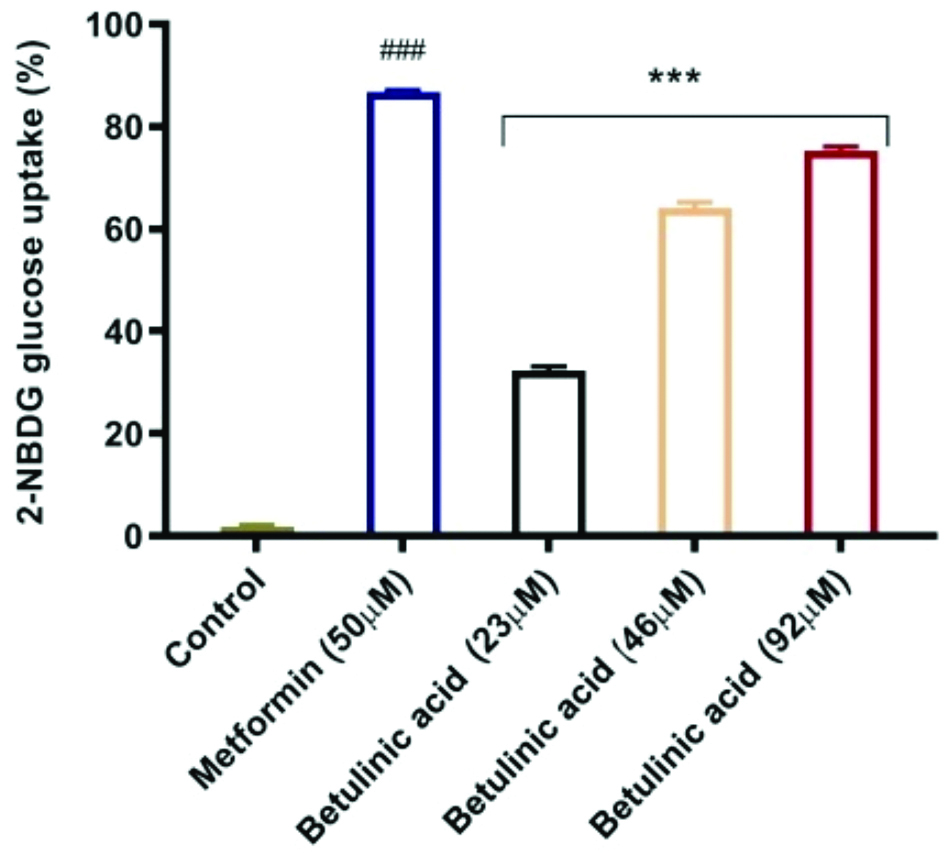
Table representing the effect of Betulinic Acid (BA) on cellular glucose uptake.
| Groups | % 2-NBDG glucose uptake |
|---|
| Control | 1.85±0.25 |
| Metformin (50 μM) | 86.81±0.31### |
| BA 23 μM | 32.39±0.72*** |
| BA 46 μM | 64.53±1.15*** |
| BA 92 μM | 75.32±0.73*** |
Results were presented as Mean±SEM (n=3); Differences between Means of Control Vs other treatment groups were evaluated using one-way ANOVA, followed by Tukey’s post-hoc analysis. Statistical significance was indicated as ### and ***p<0.001 for metformin and Betulinic Acid (BA) respectively compared to control
Discussion
Recent research has explored plants and isolated compounds for their antidiabetic properties using not only in-vitro models but also in-silico and in-vivo models [2,11,18-20]. The current study used in-vitro models to examine and analyse the effects of BA on diabetes and its related problems. The naturally occurring pentacyclic triterpene, BA, has drawn significant interest due to its wide range of biological activities, which include anti-inflammatory, antiviral and anticancer effects [8,10]. However, its potential to manage diabetes and its consequences is still largely unexplored. In this study, BA demonstrated notable antidiabetic properties.
Inhibition of the enzymes α-amylase and α-glucosidase can help in controlling postprandial hyperglycaemia. Similar to BA, phenolics from E. ferox and terpenoids from Salvia africana showed inhibitory effects on these enzymes. E. ferox seed-coat phenolics demonstrated strong inhibitory activities on α-glucosidase with an IC50 of 3.25 μg/mL and on α-amylase with an IC50 of 1.36 mg/mL. The methanolic extract of Salvia africana-lutea, which is rich in the terpenoid oleanolic acid, demonstrated α-amylase inhibitory properties with an IC50 of 12.5 μg/mL [21,22].
Some studies have assessed the triterpenes extracted from Paliurus spina-christi Mill fruit, which were found to have antidiabetic activities. The n-hexane extract showed a very good α-glucosidase inhibitory effect with an IC50 of 445.7±8.5 μg/mL. This fraction contained both betulin and BA [23]. This study was in line with the α-glucosidase inhibitory effect of the present study. In molecular docking studies, the ability of BA to bind with the active cavity of α-glucosidase and thereby prevent the access of the substrate has been demonstrated. This research supports the effect of BA in reducing the formation of glucose from the substrate [24,25]. These in-vitro assay methods have also been used in other studies to reduce glucose formation by inhibiting these key enzymes [26]. Furthermore, the inhibition of AR by different concentrations of BA confirms its potential to inhibit the conversion of glucose into sorbitol, thereby reducing sorbitol-mediated oxidative stress and cellular damage. This indicates a potential involvement in the prevention or deceleration of diabetes-related illnesses.
Research shows enhanced expression of Slc2a4 mRNA, which encodes the glucose transporter GLUT4, by BA. Hence, it can increase glucose uptake into cells and, thereby, decrease blood glucose levels [27]. In this study, the Cellular Glucose Uptake Assay using the 2-(7-Nitrobenz-2-oxa-1,3-diazol-4-yl) amino-2-deoxy-D-glucose (2-NBDG) fluorescence method has demonstrated increased glucose uptake in L6 myotubes, proving the glucose uptake potential of BA. The same assays were utilised to evaluate glucose uptake in other studies [2,28]. Hasan MM et al., also reported the antidiabetic activity of BA and stigmasterol isolated from the crude ethanol extract of T. indica stems [29].
BA demonstrated notable antidiabetic effects, including the inhibition of key enzymes involved in glucose metabolism and glucose uptake potential. This in-vitro study highlights the significant potential of BA as a therapeutic agent for the management of diabetes. Additionally, the compound exhibited properties that could mitigate the progression of diabetes-related complications, such as nephropathy, by improving plasma albumin, Blood Urea Nitrogen (BUN), Creatinine (Cr) and renal histological changes in a mouse model [30]. Administration of BA can reduce inflammation and oxidative damage; hence, it may be utilised to improve complications associated with later stages of diabetes.
Limitation(s)
As the test compound was exposed only for a short duration, the long-term effects may not be the same. Moreover, the dose requirement may differ in the case of in-vivo conditions.
Conclusion(s)
This in-vitro study concludes by highlighting the substantial therapeutic potential of BA in the management of diabetes and its complications. BA inhibited the alpha-glucosidase and alpha-amylase enzymes responsible for the formation of glucose, thereby reducing glucose levels. Moreover, glucose absorption was increased by BA in the 2-NBDG glucose uptake model compared to metformin. Furthermore, the inhibition of AR by different concentrations of BA demonstrated its potential to inhibit the conversion of glucose into sorbitol and to mitigate sorbitol-mediated oxidative stress and cellular damage, indicating a potential involvement in the prevention or deceleration of diabetes-related illnesses. Although more in-vivo research and clinical trials are required to fully investigate its mechanisms and therapeutic implications, the current findings provide a potential starting point for future investigations and diabetes control therapies.
Results were presented as Mean±SEM (n=3). Differences between Means of Control Vs various concentrations were evaluated using two-way ANOVA, followed by Holm-sidak post-hoc analysis. Statistical significance was indicated as ***p<0.001, **p<0.01, *p<0.05 compared to control group
Results were presented as Mean±SEM (n=3); Differences between Means of Control Vs other treatment groups were evaluated using one-way ANOVA, followed by Tukey’s post-hoc analysis. Statistical significance was indicated as ### and ***p<0.001 for metformin and Betulinic Acid (BA) respectively compared to control