Multiple Myeloma (MM) is classified as a haematological malignancy that predominantly affects plasma cells within the bone marrow. This condition has significant implications on bone integrity, renal function, and the immune system. MM is primarily observed in older adults, particularly those exceeding the age of 65, with a slightly higher prevalence in males compared to females. Notably, MM is characterised by recurrent relapses and intricate treatment requirements. The term “multiple myeloma” reflects the dissemination of malignant cells throughout the bone marrow, leading to tumours in various locations within the skeletal framework [1]. Patients with multiple myeloma typically present with clinical manifestations such as hypercalcemia, renal insufficiency, anemia, and osteolytic bone lesions. A comprehensive diagnostic evaluation is essential to distinguish between symptomatic multiple myeloma, which necessitates intervention, and its precursor benign conditions. Historically, conventional radiography served as the primary diagnostic modality for the identification of bone lesions in patients with multiple myeloma [2]. However, this technique exhibits limited sensitivity, particularly in the detection of early-stage lytic bone lesions. Advances in imaging technology, including Magnetic Resonance Imaging (MRI), low-dose Multidetector Computed Tomography (MDCT), and 18F-fluoro-deoxyglucose positron emission tomography (18F-FDG PET/CT), have become increasingly prominent for the assessment of both lytic lesions and initial bone marrow infiltration [3].
A multidisciplinary, international, and expert panel of radiologists, medical physicists, and hematologists with relevant experiences have reviewed the performance abilities, merits, and limitations of currently available techniques of imaging and concluded that there is growing importance of whole-body MRI for directing patient care in myeloma. Therefore, the group developed the Myeloma Response Assessment and Diagnosis System (MY-RADS) imaging recommendations to encourage standardisation and minimise variations in the acquisition, interpretation, and reporting of whole-body MRI in myeloma while considering the recently developed MET-RADS [4,5].
Whole-body MRI including DW MRI is the most sensitive technique for bone marrow imaging with additional benefits of speed, coverage, and quantification in comparison with traditional MRI, obviating intravenous injections and radiation exposure. Avoidance of ionizing radiation is likely to become increasingly relevant as surveillance imaging of high-risk patients with monoclonal gammopathy of undetermined significance. It is generally a well-tolerated technique that offers the additional benefits of assessing skeletal complications, such as spinal canal and/or nerve root compression, and is the most accurate method for differentiating benign from malignant vertebral compression fractures [5].
MY-RADS categorises the extent of disease and treatment response based on scores. This score helps clinicians in assessing how well a patient is responding to a given therapy. By establishing a clear and systematic approach, MY-RADS helps to reduce variability in imaging assessments, making it simple and easy to track disease progression and monitor treatment effectiveness over time.
MY-RADS utility is important and significant, given the complex nature of (MM) multiple myeloma, where accurate as well as timely evaluations plays a critical role and can affect treatment decisions and final outcomes [4].
Therefore, the present study was conducted to evaluate the effectiveness of the MY-RADS scoring system using whole-body MRI for treatment response assessment of patients with multiple myeloma focusing on quantifiable imaging parameters i.e., tumour burden score, ADC, and fat fraction so as to enhance consistency in reporting and minimising the exposure to ionizing radiation.
Materials and Methods
A prospective observational study was conducted in the Department of Radiology at Gauhati Medical College and Hospital from April 2021 to September 2022. The study included 50 patients referred from the Haematology Department and diagnosed with (MM) multiple myeloma based on specific defined clinical and biochemical parameters.
Before the commencement of the study, ethical approval was obtained from the Institutional Ethics Committee (IEC) with approval number MC/190/2007/Pt-II/April 2021/TH-44.
To ensure patient safety, a comprehensive medical history was collected to identify any potential contraindications for MRI, such as the presence of pacemakers, metallic objects, artificial heart valves, or cochlear implants etc. Before the commencement of the study, each participant was required to provide written informed consent. Individuals who did not give written informed consent were excluded from participation in the study.
Before the MRI procedure, patients received a brief explanation to ensure their understanding and comfort. The Magnetic Resonance Imaging (MRI) evaluation was conducted using a 3 Tesla (3T) Siemens Magnetom Skyra machine.
All 50 patients were positioned in a supine position for the entire scanning duration. They underwent multi-parametric MRI sequences, which included T1 and T2 weighted anatomical imaging, whole-body diffusion, and STIR sequences. The protocol allowed for multi-station acquisition of contiguous body regions, achieving full-body coverage from the vertex to the knee [4].
This included coronal and sagittal T2-weighted STIR sequences, as well as coronal T1-weighted imaging with low and high b-values of 0 and 800 s/mm2. Additionally, a 3D inverted grayscale PET-like display of the high b-value acquisition was included in the reconstructed image sets for Diffusion Weighted Imaging (DWI) [Table/Fig-1].
A prescribed parameter specification for MY-RADS [4].
| S. No. | Sequence type | Additional
parameter |
|---|
| 1 | Whole spine: sagittal, T1-weighted, fast spin-echo; section thickness of 4-5 mm | |
| 2 | Whole spine: sagittal, T2, STIR or fat-suppressed T2-weighted, section thickness of 4-5 mm | |
| 3 | Whole body (vertex to knees): T1-weighted, gradient-echo Dixon technique | |
| 4 | Whole body (vertex to knees): axial, diffusion-weighted, STIR fat suppression, 5 mm contiguous sectioning, multiple stations
ADC calculations with monoexponential data fitting 3D MIP reconstructions of highest b-value images | 2b values
(50-100 sec/mm2 and 800-900 sec/mm2) |
| 5 | Whole body (vertex to knees): axial, T2-weighted,
fast spin-echo without fat suppression, 5-mm contiguous sectioning, multiple stations, preferably matching the diffusion-weighted images | |
| 6 | Regional assessments: for example, symptomatic or known sites outside standard field of view, through sites of suspected
cord compression, nerve root involvement, extramedullary disease
Axial or coronal | |
Imaging evaluation:
The patients underwent whole-body MRI with all essential sequences at two stages: Pre-treatment (serving as a baseline for comparison) and post-treatment, after completing the treatment cycle, to assign a MY-RADS score [4].
The baseline MRI was primarily evaluated as follows [5-6]:
The burden score was evaluated in the seven anatomical sites (cervical vertebrae, thoracic vertebrae, lumbar vertebrae, sacral vertebrae, pelvis, skull and long bones). Each of the seven sites was scored based on the number of lesions present: 1 point was assigned for the presence of diffuse illness. A maximum score of 3 was awarded for sites with 10 or more lesions, 2 points for 2 to 9 lesions, 1 point for a single lesion, and 0 points if no lesions were detected. Additionally, the size of a lesion influences its scoring with larger lesions (greater than 15 mm) receiving a score of 3, lesions between 5 and 15 mm scoring 2, and smaller lesions (less than 5 mm) scoring 1. The total burden score was then compiled [5].
The ADC values were evaluated for the lesions and the lowest ADC value was then recorded for all the seven anatomical regions. The mean values were computed across all sites of disease (diffuse and focal) to identify a single overall ADC value per patient.
The fat fraction of the index lesion was evaluated and recorded using Dixon T1 fat and water-weighted images.
Any extramedullary disease, if found, was recorded concerning its size, site, relation to adjacent structures, ADC value and other associated findings.
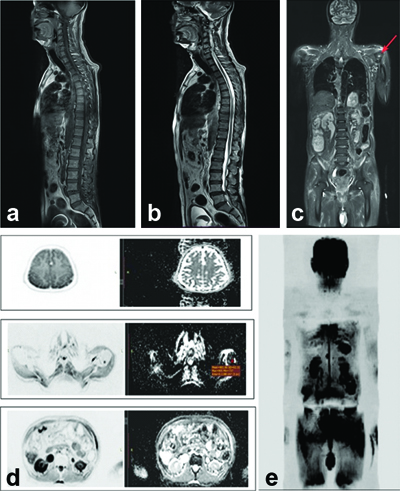
Any vertebral compression fracture, if seen, was recorded concerning specific level (s) involved, type (benign/malignant) and other associated findings like cord compression, nerve root impingement, pre and para-vertebral components etc. Patients diagnosed with multiple myeloma were evaluated with baseline MRI using the standard sequences [Table/Fig-2a-e].
Sequence of MRI evaluation at the baseline: a) Sagittal T1W whole spine; b) Sagittal T2W whole spine; c) Whole body STIR coronal; d) Whole body axial DWI; e) Whole body maximum intensity projection (inverted grey scale).
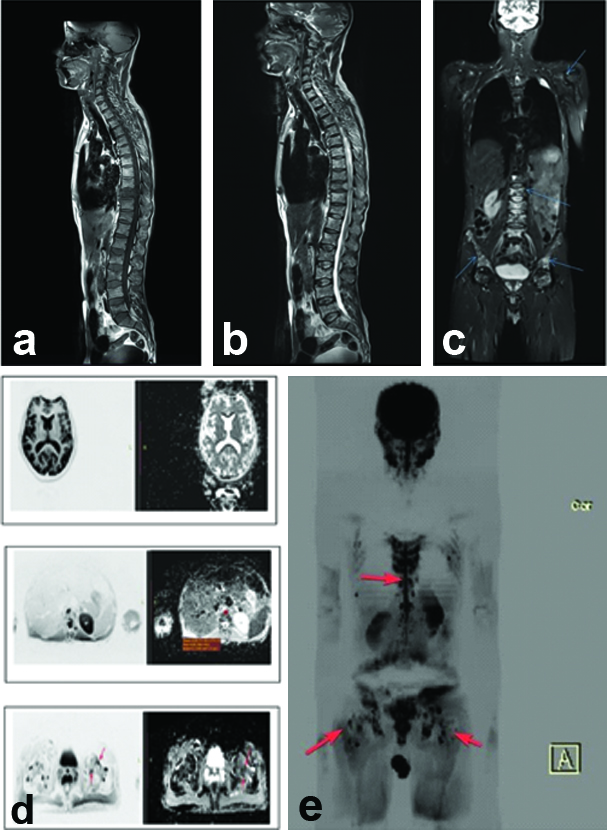
After the completion of four cycles of chemotherapy, the patients underwent re-evaluation utilising whole-body MRI with the same standardised sequences. The findings were systematically documented (refer to Table/Fig-3a-e).
Post-treatment MRI evaluation: a) Sagittal T1W; b) Sagittal T2W; c) STIR whole body coronal; d) Whole body DWI axial; e) Maximum intensity projection in DWI.
The assessment of clinical response adhered to the guidelines established by the International Myeloma Working Group (IMWG) [7]. Nonetheless, due to various limitations and for simplification, the patients were categorised into three groups: those exhibiting improvement (consisting of stringent complete/complete responses, very good partial responses/Partial responses, minimal responses), those demonstrating no change (stable disease), and those presenting with deteriorating clinical biomarkers (progressive disease) [7].
Statistical Analysis
Statistical analyses were conducted utilising IBM SPSS Statistics version 26.0. The quantitative values, including Mean ADC and Fat Fraction, were summarised as Mean (SD) according to the data distribution. The Pearson Correlation Coefficient was employed to determine the correlation between parameters. A p-value of less than 0.05 was considered statistically significant.
Results
The total burden score in the pretreatment stage was 2 with a mean overall ADC of 0.8×10⁻³ mm2/sec. There were no other ancillary findings [Table/Fig-4]. The post treatment burden score and the mean ADC values have been illustrated in [Table/Fig-5]. Post-treatment mean ADC value was 0.62.
Pre-treatment parameters.
| S. No. | Anatomic site | Diffuse (D) | Focal (F) | Description |
|---|
| 1 | Cervical vertebrae | 0 | 0 | NLD |
| 2 | Thoracic vertebrae | 0 | 0 | NLD |
| 3 | Lumbar vertebrae | 0 | 0 | NLD |
| 4 | Sacral vertebrae | 0 | 0 | NLD |
| 5 | Pelvis | 0 | 0 | NLD |
| 6 | Skull | 0 | 0 | NLD |
| 7 | Long-bones | 0 | 2 | Two focal lesions in the head of the left humerus, each 5-10 mm in size |
*NLD: No lesions detected
Post-treatment parameters.
| S. No. | Anatomic site | Number of lesions | Burden score | Mean ADC | FF (index lesion) | Fractures |
|---|
| 1 | Cervical | 03 | D0F3 | 0.71 | 0.15 | - |
| 2 | Thoracic | 08 | D1F4 | 0.73 | 0.14 | - |
| 3 | Lumbar | 12 | D1F4 | 0.62 | 0.14 | - |
| 4 | Sacral | 10 | D1F5 | 0.78 | 0.15 | - |
| 5 | Long-bones | 14 | D0F4 | 1.0 | 0.16 | - |
| 6 | Pelvis | 13 | D0F4 | 1.1 | 0.15 | - |
| 7 | Skull | 0 | D0F0 | - | - | - |
In this study, it was found that majority of the patients were in the MY-RADS 5 category (36%) followed by those with MY-RADS score 4 (26%) [Table/Fig-6].
Distribution of MY-RADS score among the study subjects.
| MY-RADS score | Number
(N) | Percentage
(%) |
|---|
| 1 | 4 | 8 |
| 2 | 11 | 22 |
| 3 | 4 | 8 |
| 4 | 13 | 26 |
| 5 | 18 | 36 |
| Total | 50 | 100% |
Higher prevalence of vertebral fractures was observed in patients with elevated MY-RADS scores, indicating that as disease severity (reflected by MY-RADS) increased, so did the frequency of fractures [Table/Fig-7].
Distribution of average number of vertebral fractures vs MY-RADS score.
| MY-RADS score assigned to patient group | Average number of fractures in patients with respective MY-RADS score |
|---|
| 1 | 1 |
| 2 | 1 |
| 3 | 1 |
| 4 | 2 |
| 5 | 4 |
Total Burden Score
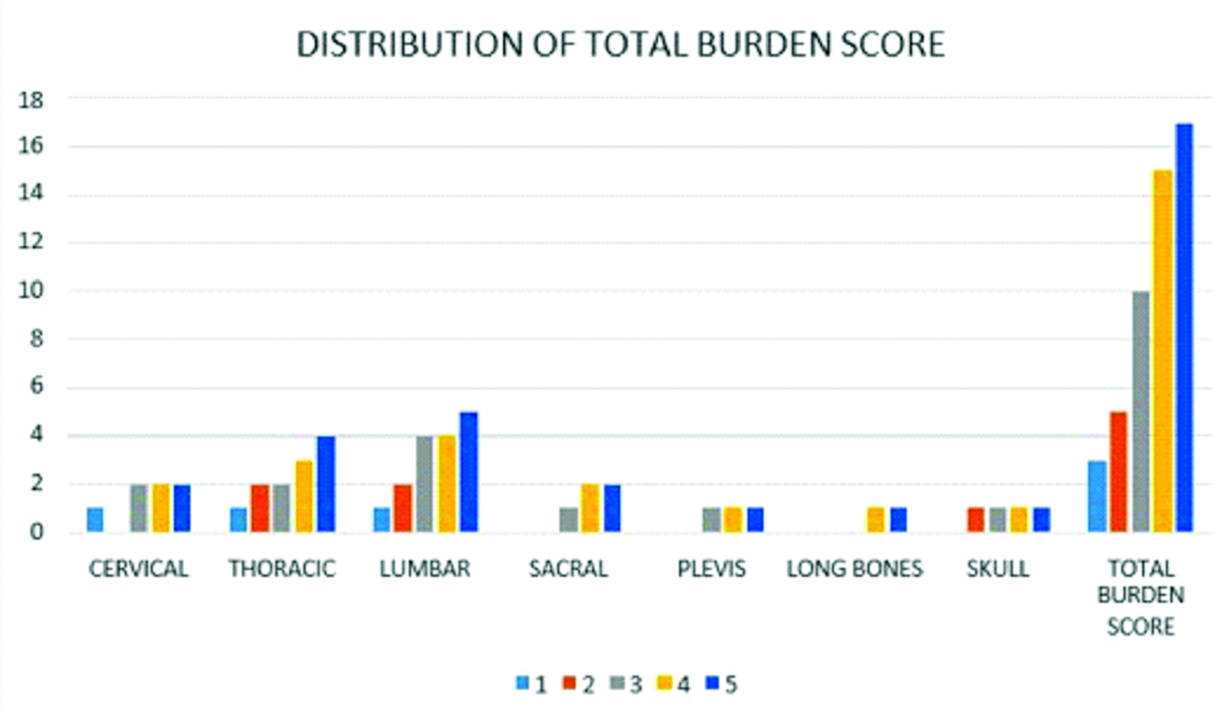
Out of the 50 patients observed, the mean burden score was 17±3 in MY-RADS score 5, followed by 15±2 in MY-RADS score 4, 10±1 in MY-RADS score 3, 5±2 in MY-RADS score 2 and 3±1 in MY-RADS score 1 [Table/Fig-8,9].
Distribution of Mean Burden Score (post treatment) according to assigned MY-RADS score indicating trend of increased burden score (i.e. more extensive disease) with increasing MY-RADS score.
| MY-RADS score | Mean Burden score (±SD) | Interpretation |
|---|
| Score 5 | 17±3 | Highest Burden Score indicating more extensive disease involvement |
| Score 4 | 15±2 | Modern-to-high Burden Score |
| Score 3 | 10±1 | Intermediate Burden Score |
| Score 2 | 05±2 | Lower Burden Score |
| Score 1 | 03±1 | Lower Burden Score; Minimum disease involvement |
Distribution of total burden score vs MY-RADS score.
Diffuse Disease vs. MY-RADS Score
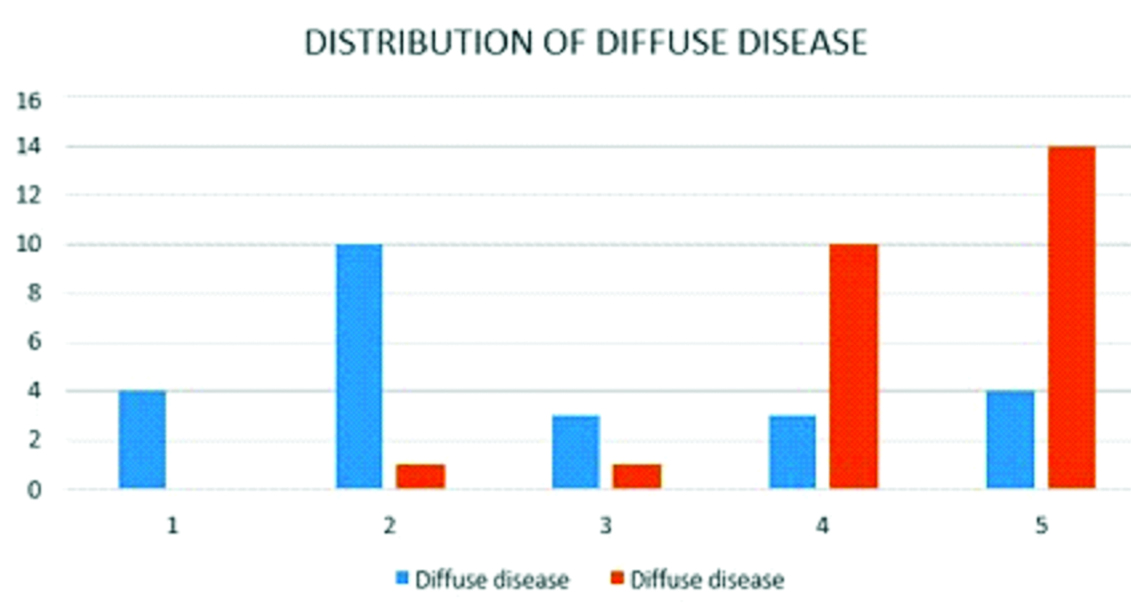
Total patients with diffuse disease were 26 (52%) out of the 50 patients. Out of the 18 patients of the MY-RADS category 5,14 patients were having diffuse disease/lesion.
In this study, it was found that majority of the patients were in the MY-RADS 5 category followed by those with MY-RADS score 4 (26%) [Table/Fig-10,11].
Showing high MY-RADS scores and diffuse disease.
MY-RADS
score | Total
patients | Patients with
diffuse disease | Percentage
(%) |
|---|
| Highest i.e. score 5 | 18 | 14 | 77.8% |
| Other score | 32 | 12 | 37.5% |
| Total | 50 | 26 | 52% |
Distribution of diffuse disease vs MY-RADS score.
Blue is Focal; Red is Diffuse
Lesion Size Changes in different MY-RADS Score
Out of the 50 patients observed, it was seen that the size of the lesions increased in 100% of the patients having MY-RADS score 5, increased in 61.5% of the patients having MY-RADS score 4, no change in 100% patients having MY-RADS score 3, decreased in 90.9% of the patients having MY-RADS score 2 and decreased in 75% of the patients having MY-RADS score 1. The p-value was <0.05 [Table/Fig-12].
Distribution of trend of change in lesion size (whether increased, decreased or no change in size in post-treatment).
| MY-RADS | Increased lesion size (N) | Increased lesion size (%) | No change in lesion size (N) | No change in lesion size (%) | Decreased lesion size (N) | Decreased lesion size (%) |
|---|
| 5 | 18 | 100% | 0 | 0% | 0 | 0% |
| 4 | 8 | 61.5% | 0 | 0% | 5 | 38.5% |
| 3 | 0 | 0% | 4 | 100% | 0 | 0% |
| 2 | 0 | 0% | 1 | 9.1% | 10 | 90.9% |
| 1 | 0 | 0% | 1 | 25% | 3 | 75% |
| Total | 26 | 6 | 18 | |
| TOTAL | 50 | |
18 (36%) patients showed deterioration of the clinical biomarkers, 15 (30%) showed no change in the biomarkers and 17 (34%) showed improvement in clinical biomarkers. In accordance to the MY-RADS score assigned, 77.8% of the patients who were assigned RAC score 5 showed deterioration in the biomarker levels, 30.8% of the patients who were assigned RAC score 4 showed deterioration in the biomarker levels and 53.8% showed no change in the biomarker levels, 75% of the patients who were assigned RAC score 3 showed no change in the biomarker levels and 25% showed improvement, 63.6% of the patients who were assigned RAC score 2 showed improvement in the biomarker levels and 75% of the patients who were assigned RAC score 1 showed clinical improvement [Table/Fig-13].
Distribution of trend in clinical biomarkers (in post treatment stage) according to assigned MY-RADS score indicating worsening clinical picturenin patients with a higher score.
| MY-RADS score | Deterioration in biomarkers (N) | Deterioration in biomarkers (%) | No change in biomarkers (N) | No change in biomarkers (%) | Improvement in biomarkers (N) | Improvement in biomarkers (%) |
|---|
| 5 | 14 | 77.8% | 0 | 0% | 4 | 22.2% |
| 4 | 4 | 30.8% | 7 | 53.8% | 2 | 15.4% |
| 3 | 0 | 0% | 3 | 75% | 1 | 25% |
| 2 | 0 | 0% | 4 | 36.4% | 7 | 63.6% |
| 1 | 0 | 0% | 1 | 25% | 3 | 75% |
| Total | 18 | 15 | 17 |
| TOTAL | 50 | |
In the study it was seen that the mean fat fraction came out to be 0.16 with a SD of 0.08. The mean fat fraction in scores MY-RADS RAC 1, 2, 3, 4 and 5 were respectively 0.31, 0.25, 0.2, 0.12 and 0.1 The mean fat fraction in the patients having deterioration of biomarker levels was 0.10 and that in patients having improvement of biomarkers was 0.23 [Table/Fig-14].
Mean fraction in different MY-RADS score.
| MY-RAD | Baseline fat fraction | Post treatment fat fraction |
|---|
| 1 | 0.25±0.08 | 0.31±0.08 |
| 2 | 0.20±0.08 | 0.25±0.08 |
| 3 | 0.18±0.08 | 0.2±0.08 |
| 4 | 0.17±0.08 | 0.12±0.08 |
| 5 | 0.14±0.08 | 0.1±0.08 |
| Clinical biomarkers | Baseline fat fraction | Post treatment fat fraction |
| Deterioration | 0.15±0.03 | 0.1±0.03 |
| Improvement | 0.18±0.03 | 0.23±0.06 |
The mean of the ADC values seen on follow-up was 0.71±0.08×10⁻³ mm2/sec in MY-RADS score 5, 0.92±0.07×10⁻³ mm2/sec in MY-RADS score 4, 1.14±0.12×10⁻³ mm2/sec in MY-RADS score 3, 1.35±0.12×10⁻³ mm2/sec in MY-RADS score 2 and 1.47±0.22×10⁻³ mm2/sec in MY-RADS score 1.
There was a statistically significant relationship between ADC value and MY-RADS score with a statistically significant increase in ADC seen in MY-RADS scores 1 and 2 and a statistically significant decrease in MY-RADS scores 4 and 5 [Table/Fig-15].
Distribution of ADC score according to MY-RADS score.
| MY-RADS score | p-value |
|---|
| 1 | 2 | 3 | 4 | 5 |
|---|
| Mean±SD | Mean±SD | Mean±SD | Mean±SD | Mean±SD |
|---|
| Baseline ADC value (10-3 mm2/sec) | 1.04±0.18 | 1.09±0.13 | 1.06±0.14 | 1.02±0.09 | 0.78±0.13 | <0.001 |
| Follow-up ADC score | 1.47±0.22 | 1.35±0.12 | 1.14±0.12 | 0.92±0.07 | 0.71±0.08 | <0.001 |
In the present study, there was a moderate negative correlation between MY-RADS score and clinical biomarkers with a higher score of MY-RADS signifying a deterioration of clinical biomarkers (r=-0.703, p-value <0.05).
A moderate correlation was noted between the mean ADC value and improved clinical outcome (r=0.631, p-value <0.05).
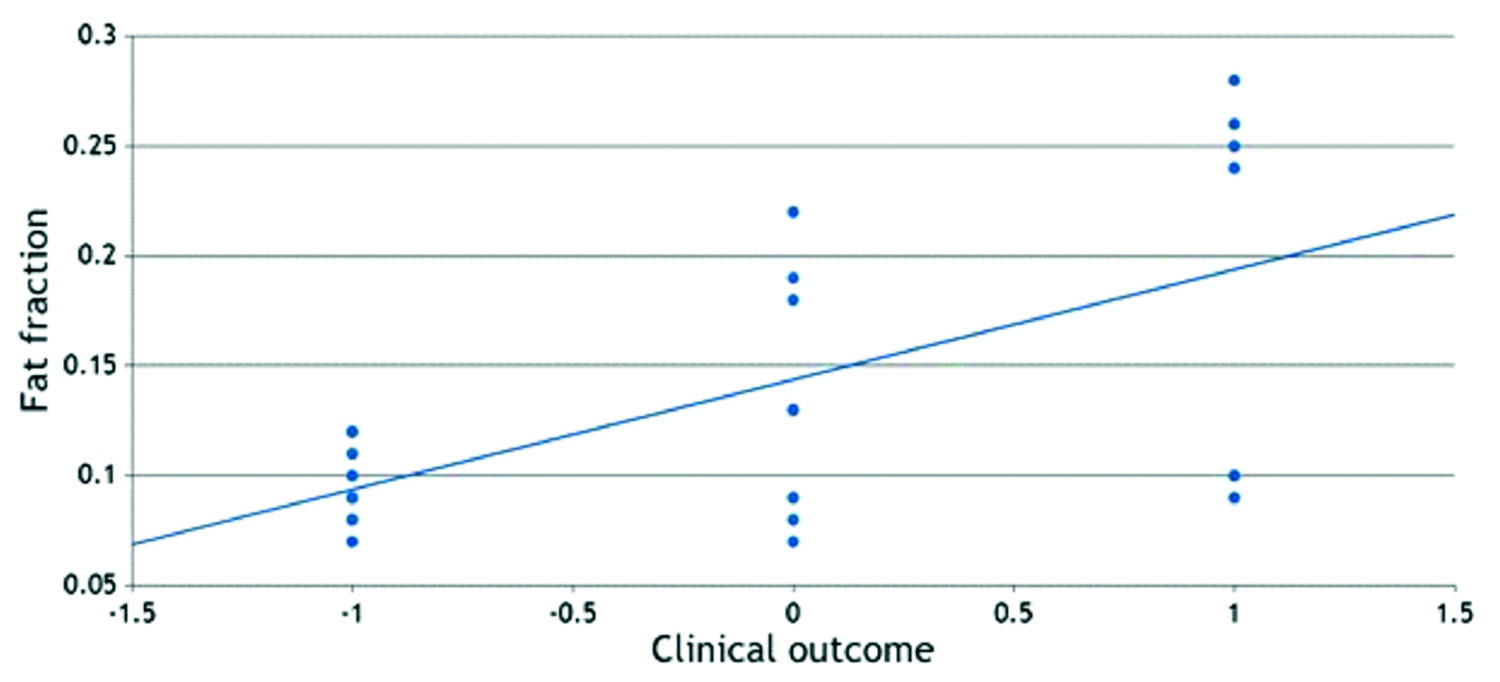
A strong positive correlation was found between fat fraction and clinical response in patients (r=0.954, p-value <0.05) [Table/Fig-16].
Scatter plot diagram showing the correlation between fat fraction and clinical outcome.
A strong correlation was noted between the total burden score and MY-RADS (r=0.905 and p-value <0.05) and a strong negative correlation was found between the mean ADC value and total burden score (r=-0.879 and p-value <0.05).
There was a mild correlation between the total burden score and number of vertebral fractures (r=0.202, p<0.05).
Discussion
In the context of Multiple Myeloma, the standardisation of imaging sequence parameters has facilitated the establishment of a clear and consistent reporting format. This standardisation enables straightforward interpretation of critical imaging findings, including tumor burden, current disease status, and response assessment for ongoing therapy. These factors have been integrated into the MY-RADS score, which provides a structured framework and reliable information pertinent to the evaluation of disease progression and the effectiveness of treatment. This methodology has not only improved the uniformity of evaluations across all patients but has also streamlined the monitoring of clinical outcomes based on fair and objective imaging criteria. [5].
The tumour burden score furnishes a quantitative assessment of the extent of the disease, remaining consistent when comparing pre- and post-treatment changes. Such consistency is essential for appropriate patient stratification and for guiding subsequent treatment decisions. Likewise, fat fraction measurements have proven to be invaluable objective indicators of both progression and regression in Multiple Myeloma [2,5].
The present study revealed a robust positive correlation between the mean ADC value and the total burden score, consistent with findings reported by Dong H et al., [8] Additionally, this investigation identified a significant moderate negative correlation between the MY-RADS score and clinical biomarkers, indicating that higher MY-RADS scores are associated with a decline in clinical biomarkers. These findings are congruent with research conducted by Paternain A et al., which demonstrated a strong agreement between the IMWG response classification and MY-RADS response criteria, yielding a kappa (κ) value of 0.852 [9]. This comparative analysis underscores a reliable relationship between MY-RADS scores and clinical deterioration, thereby supporting the utility of MY-RADS as a credible imaging-based tool for treatment response assessment in Multiple Myeloma. Furthermore, the results indicate a statistically significant association between elevated ADC values and improved clinical outcomes. A comparative study by Paternain A et al., also established a significant correlation between variations in ADC values and clinical response, with a significant p-value <0.05 [9]. This reinforces the applicability of ADC measurements as reliable imaging parameters for monitoring clinical improvement and aligns with prior literature. In terms of the relationship between Total Burden Score and MY-RADS score, the study findings resonate with those reported by Dong H et al., [8], which indicated that patients exhibiting a deep response had a lower total burden score. Additionally, our results regarding Fat Fraction in relation to Clinical Response are consistent with the study conducted by Dong H et al., [8], which observed that patients with a deep response exhibited higher fat fraction.
Thus, the implementation of a standardised template for whole-body MRI in conjunction with the MY-RADS scoring system has proven advantageous in ensuring consistency throughout the evaluation process. This increased reproducibility of findings has facilitated better and more accurate assessment of treatment responses. The imaging parameters, including total burden score, ADC values, and fat fraction, demonstrated strong correlations with clinical outcomes, reinforcing the notion that MRI could serve as a valuable tool for evaluating treatment response in patients diagnosed with Multiple Myeloma.
Limitation(s)
Not with standing the aforementioned findings, it is important to acknowledge certain limitations inherent in the present study that may affect the interpretation or generalisation of results on a larger scale. Key considerations include the presence of subject selection bias due to the hospital-based nature of the study, which may hinder generalisability. Another limitation was the small sample size of the study due to time and logistical constraints and challenges associated with maintaining a consistent standard in the acquisition of various MRI sequences across all patients, potentially affecting the uniformity of imaging data. Although there was an intention to enhance the robustness of our findings by further investigating the correlation between follow-up results and PET-CT scans, this aspect was ultimately excluded from the study due to resource limitations and the potential strain on available resources.
Conclusion(s)
This study demonstrates that the MY-RADS score applied using whole-body MRI is a potential tool to effectively assess treatment response in Multiple Myeloma.
Incorporating objective imaging parameters like the burden score, ADC (Apparent Diffusion Coefficient), and fat fraction, MY-RADS enhances the result’s reproducibility and variability reduction while reporting. These parameters clearly support the identification of response to therapy along with timely treatment plan adjustment and modification as per the individual patient’s needs. In addition, the use of whole-body MRI assists in mitigating the need for radiation exposure repetition, which is a clear and significant advantage over traditional imaging modalities involving ionizing radiations like CT and PET scans.
*NLD: No lesions detected